GBPUSD Will Go Up From Support! Long!
Please, check our technical outlook for GBPUSD.
Time Frame: 9h
Current Trend: Bullish
Sentiment: Oversold (based on 7-period RSI)
Forecast: Bullish
The market is trading around a solid horizontal structure 1.321.
The above observations make me that the market will inevitably achieve 1.333 level.
P.S
The term oversold refers to a condition where an asset has traded lower in price and has the potential for a price bounce.
Overbought refers to market scenarios where the instrument is traded considerably higher than its fair value. Overvaluation is caused by market sentiments when there is positive news.
Like and subscribe and comment my ideas if you enjoy them!
Long!!!!

NZDUSD Will Go Higher! Buy!
Here is our detailed technical review for NZDUSD.
Time Frame: 9h
Current Trend: Bullish
Sentiment: Oversold (based on 7-period RSI)
Forecast: Bullish
The market is testing a major horizontal structure 0.571.
Taking into consideration the structure & trend analysis, I believe that the market will reach 0.577 level soon.
P.S
We determine oversold/overbought condition with RSI indicator.
When it drops below 30 - the market is considered to be oversold.
When it bounces above 70 - the market is considered to be overbought.
Like and subscribe and comment my ideas if you enjoy them!

NZDCAD Will Go Up! Long!
Take a look at our analysis for NZDCAD.
Time Frame: 1D
Current Trend: Bullish
Sentiment: Oversold (based on 7-period RSI)
Forecast: Bullish
The market is approaching a key horizontal level 0.802.
Considering the today's price action, probabilities will be high to see a movement to 0.810.
P.S
Overbought describes a period of time where there has been a significant and consistent upward move in price over a period of time without much pullback.
Like and subscribe and comment my ideas if you enjoy them!

AUDJPY Trading Opportunity! BUY!
My dear followers,
I analysed this chart on AUDJPY and concluded the following:
The market is trading on 100.92 pivot level.
Bias - Bullish
Technical Indicators: Both Super Trend & Pivot HL indicate a highly probable Bullish continuation.
Target - 101.16
Safe Stop Loss - 100.81
About Used Indicators:
A super-trend indicator is plotted on either above or below the closing price to signal a buy or sell. The indicator changes color, based on whether or not you should be buying. If the super-trend indicator moves below the closing price, the indicator turns green, and it signals an entry point or points to buy.
Disclosure: I am part of Trade Nation's Influencer program and receive a monthly fee for using their TradingView charts in my analysis.
———————————
WISH YOU ALL LUCK

GBPNZD Massive Long! BUY!
My dear subscribers,
My technical analysis for GBPNZD is below:
The price is coiling around a solid key level - 2.3126
Bias - Bullish
Technical Indicators: Pivot Points Low anticipates a potential price reversal.
Super trend shows a clear buy, giving a perfect indicators' convergence.
Goal - 2.3243
About Used Indicators:
By the very nature of the supertrend indicator, it offers firm support and resistance levels for traders to enter and exit trades. Additionally, it also provides signals for setting stop losses
Disclosure: I am part of Trade Nation's Influencer program and receive a monthly fee for using their TradingView charts in my analysis.
———————————
WISH YOU ALL LUCK

GBPAUD Technical Analysis! BUY!
My dear friends,
My technical analysis for GBPAUD is below:
The market is trading on 2.0266 pivot level.
Bias - Bullish
Technical Indicators: Both Super Trend & Pivot HL indicate a highly probable Bullish continuation.
Target - 2.0284
Recommended Stop Loss - 2.0253
About Used Indicators:
A pivot point is a technical analysis indicator, or calculations, used to determine the overall trend of the market over different time frames.
Disclosure: I am part of Trade Nation's Influencer program and receive a monthly fee for using their TradingView charts in my analysis.
———————————
WISH YOU ALL LUCK

EURAUD: Expecting Bullish Continuation! Here is Why:
Our strategy, polished by years of trial and error has helped us identify what seems to be a great trading opportunity and we are here to share it with you as the time is ripe for us to buy EURAUD.
Disclosure: I am part of Trade Nation's Influencer program and receive a monthly fee for using their TradingView charts in my analysis.
❤️ Please, support our work with like & comment! ❤️

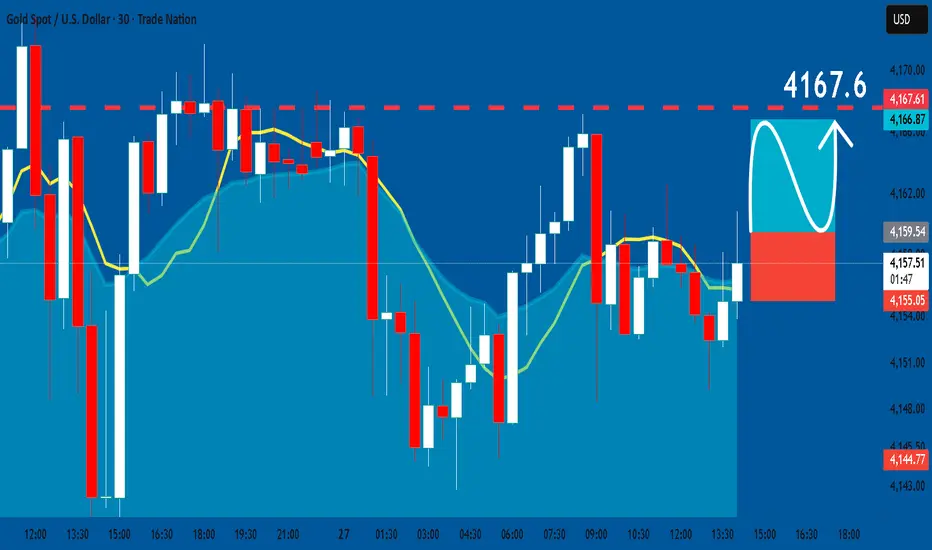
GOLD: Long Trade with Entry/SL/TP
GOLD
- Classic bullish formation
- Our team expects growth
SUGGESTED TRADE:
Swing Trade
Buy GOLD
Entry Level - 4159.5
Sl - 4155.0
Tp - 4167.6
Our Risk - 1%
Start protection of your profits from lower levels
Disclosure: I am part of Trade Nation's Influencer program and receive a monthly fee for using their TradingView charts in my analysis.
❤️ Please, support our work with like & comment! ❤️
TWST bull ready to unleash?Genomics: The Next Decade’s Most Underpriced Revolution?
If you had to pick one scientific field with the potential to redefine medicine, agriculture, and consumer health over the next decade, genomics should be at the top of the list. At its core, genomics is the study of the entire genetic code—our DNA—and how it influences everything from disease risk to drug response to crop resilience.
Modern genomics companies offer far more than ancestry reports. The industry now spans three major pillars:
1. Genetic sequencing and analysis.
2. Personalised health and diagnostics.
3. Therapeutics and gene editing.
What's going for the Genomic Industry now heading into 2026 vs crushing years following 2021:
Regulation is maturing. The FDA is warming to gene-edited therapies, and reimbursement frameworks are slowly aligning with personalised medicine.
Costs are collapsing. Sequencing is approaching the “$10 genome,” unlocking applications that were previously uneconomical.
AI accelerates discovery. Large-scale biological datasets are exactly the domain where AI thrives, shrinking timelines for drug development and variant interpretation.
In terms of current rating, we anticipate momentum may shift to a 'bullish' reading if price can push and hold above $38.00 and note significant risk should price fall below the $27.50 mark.
We're inspired to bring you the latest developments across worldwide markets, helping you look in the right place, at the right time.
Thank you for reading! Stay tuned for further updates, and we look forward to being of service along your trading & investing journey...
Disclaimer: As always, please note all information contained within this post and all other Bullfinder-official Tradingview content is strictly for informational purposes only and is not intended to be investment advice. Please DYOR & Consult your licensed financial advisors before acting on any information contained within this post, or any other Bullfinder-official TV content.

EURUSD Long: Upside Pressure Targets Retest of 1.1610 LevelHello traders! EURUSD is forming a clear technical structure after reacting precisely to both the Supply and Demand levels, creating a clean sequence of trend shifts and breakout points. Earlier, the pair moved inside a strong Descending Channel, where each retest of the upper boundary produced sharp bearish impulses. This confirmed that sellers were fully in control during that phase. A breakout from the channel led to a short consolidation Range, showing temporary buyer accumulation before a trend reversal. Following this accumulation, EURUSD entered an Ascending Channel, where price consistently made higher highs and higher lows. Multiple breakouts occurred along the way, showing how buyers gained strength while defending each pullback. However, an important Fake Breakout near 1.1570 revealed that bullish momentum was still fragile, and price slipped back into the channel before resuming the upward movement.
Currently,, the market formed a clear Inverse Head and Shoulders reversal pattern at the bottom, located directly inside the 1.1500–1.1520 Demand Zone. This zone acted as a major support cluster, generating strong bullish reactions. After confirming the neckline breakout, EURUSD rallied aggressively toward the current structure. At the moment, price is pushing higher and approaching the 1.16100 Supply Zone, which has repeatedly acted as resistance in previous market swings. This level is now the main obstacle for bulls and the next key reaction zone.
My scenario as long as EURUSD remains above the 1.15700 Demand Zone, the bullish trend structure remains intact. A continuation toward the 1.16100 Supply Zone (TP1) is the most likely scenario. This level is expected to create the next significant reaction, as it aligns with previous selling pressure. A clean breakout above 1.16100 would reinforce the bullish momentum and open the path toward the next upside levels. However, if EURUSD rejects the supply area, a pullback toward 1.15700–1.15500 may occur before buyers attempt another upward move. Only a breakdown below the demand zone would weaken the bullish outlook and shift momentum back toward sellers. For now, the market favors buying pullbacks into demand while monitoring reactions closely at the 1.16100 resistance. Manage your risk!

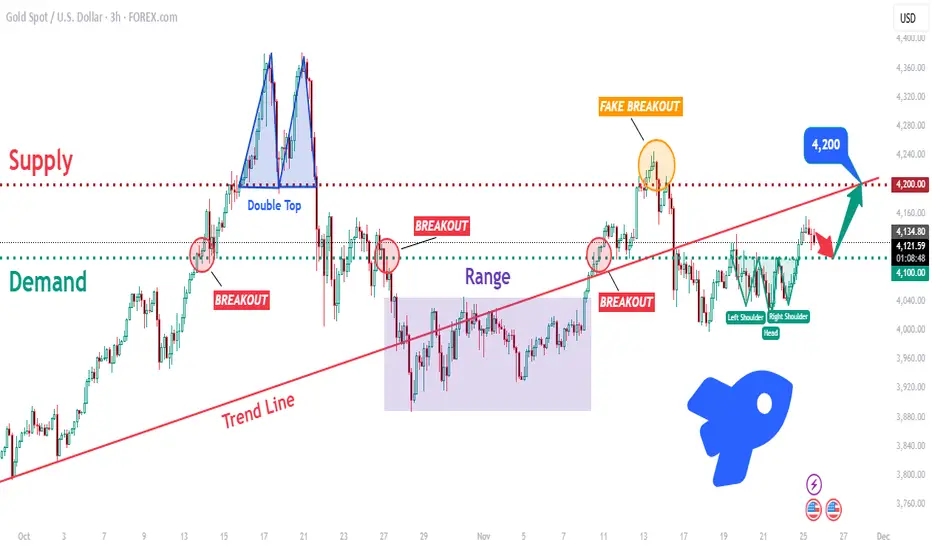
XAUUSD: Bulls Defend 4100! Is a Breakout to 4220 Imminent?Hello traders! XAUUSD continues to trade within a broader bullish structure, but with repeated volatility around key zones. The chart highlights how Gold has reacted multiple times to the major Demand Zone near 4,100, which has consistently acted as a strong support area. Each dip into this zone triggered a bullish response, confirming active buyers. Earlier in the structure, price formed a clear Double Top inside the Supply Zone around 4,220–4,230, which led to a strong bearish reversal and a breakdown below the trend line. After that, Gold entered a prolonged Range Phase, where the market consolidated sideways before breaking out to the upside. Recently, XAUUSD attempted a bullish continuation, but the move resulted in a Fake Breakout above the supply zone, signaling that buyers lacked the strength to maintain momentum above 4,220. This rejection pushed price downward and back below the main Trend Line, which now acts as dynamic resistance.
Currently, Gold is trading above the 4,100 Demand Zone, forming a potential Inverse Head and Shoulders pattern — an early sign that buyers may be preparing for another upward push. As long as price holds above 4,100 and stays above local structure, the bullish scenario remains valid.
My scenario, if XAUUSD holds above the 4,100 Demand Zone, buyers may gain momentum and attempt another breakout toward the 4,200–4,220 Supply Zone, which is the next major resistance and the primary upside target. A sustained break above 4,220 would confirm bullish strength and could open the path toward higher continuation targets. However, if buyers fail to hold the 4,100 level, Gold may drop back into the previous range or retest lower support areas before attempting another reversal. For now, the bias is moderately bullish, supported by demand reactions and reversal patterns — but a confirmed breakout above 4,200 is needed for stronger trend continuation. Manage your risk!
BTCUSD: Buyers Preparing for a Move Toward $90,000Hello everyone, here is my breakdown of the current Bitcoin setup.
Market Analysis
BTCUSD continues to recover after a prolonged downtrend, where the market consistently respected the descending Trend Line and formed a series of Range structures. Each range acted as a consolidation phase inside the broader bearish movement, with multiple breakdowns continuing the trend to the downside. Despite occasional bullish breakouts, none of them were strong enough to reverse the bearish structure, leading to further declines. Eventually, price reached the Support Zone around $84,000–$85,000, where the market produced a fake breakdown, signaling initial buyer activity. This fake breakout formed a local bottom that became the base for a reversal attempt. Following this reaction, BTCUSD began forming an Upward Channel, marking a shift in market structure from bearish to early-stage bullish. Inside this channel, price has started to create higher highs and higher lows—an essential signal of growing bullish momentum. The structure remains clean and technical: every pullback respects the lower boundary of the channel, while short impulses are reaching toward the midline of the structure. Buyers are gradually gaining control.
Currently, BTCUSD is stabilizing above the Support Zone while trading near the lower half of the ascending channel. As long as price respects this channel structure, sentiment remains bullish. The key area ahead is the Resistance Zone around $90,000, which previously acted as a pivot point and rejected bullish attempts multiple times. A clean breakout above this zone would confirm broader bullish strength.
Scenario & Strategy
I expect BTCUSD to continue moving inside the Upward Channel, gradually approaching the $90,000 Resistance Zone. A retest of this area is the most probable outcome if buyers maintain control. Short-term corrections may occur as the price approaches resistance, but overall structure favors a bullish continuation. A confirmed breakout above $90,000 could trigger a stronger move toward higher targets, opening the way for a larger trend reversal. This level remains the key barrier for buyers in the short and medium term.
However, if BTCUSD breaks down from the Upward Channel and falls below the $84,000 Support Zone, the bullish scenario becomes invalid. Such a move would likely signal a deeper correction or a return to bearish conditions. For now, buying the dips within the channel remains the more favorable approach as long as the structure stays intact and buyers continue defending support.
That's the setup I'm tracking. Thank you for your attention, and always manage your risk.

NZD/USD BULLS ARE STRONG HERE|LONG
Hello, Friends!
NZD/USD pair is in the downtrend because previous week’s candle is red, while the price is clearly falling on the 9H timeframe. And after the retest of the support line below I believe we will see a move up towards the target above at 0.568 because the pair oversold due to its proximity to the lower BB band and a bullish correction is likely.
Disclosure: I am part of Trade Nation's Influencer program and receive a monthly fee for using their TradingView charts in my analysis.
✅LIKE AND COMMENT MY IDEAS✅

BTC Rebounds From 85K Support — Rally Toward 93K ResistanceHello traders! Let’s take a look at BTCUSD (Bitcoin). BTCUSD continues to trade within a broader corrective structure after a long bearish decline. Earlier, the market formed a large descending wedge, where price consistently respected both the Resistance Line and the Support Line. After the breakout from this wedge pattern, Bitcoin briefly turned bullish but soon entered a sideways Range, showing indecision and weakening momentum. The Range eventually broke to the downside, sending BTCUSD directly into the Seller Zone around $93,000, a key area that triggered several strong rejections in the past. A clean retest of this zone confirmed bearish pressure, leading to another impulsive drop. During the decline, price briefly pushed below the Support Zone near $85,000, creating a fake breakout, which trapped sellers and sparked a strong bullish reaction. From this point, buyers gained control and pushed price into a new ascending structure, supported by a rising Support Line shown on the chart. This indicates a shift in short-term momentum, with BTCUSD now forming higher highs and higher lows. Currently, Bitcoin is approaching the $93,000 Resistance Level, which aligns with the upper boundary of the previous Seller Zone. This is the key barrier for buyers. If price manages a clean breakout above this level, bullish continuation toward higher resistance zones becomes likely. As long as BTCUSD holds above the ascending Support Line and the $85,000 Support Area, the outlook remains bullish in the short term. From my perspective, BTCUSD is showing a short-term bullish continuation setup, supported by the ascending Support Line and the strong rejection from the $85,000 demand zone. If BTCUSD breaks back below $85,000, the bullish scenario becomes invalid, and a deeper correction could follow. For now, market structure supports a bullish recovery as long as buyers defend support and maintain the ascending trend. Please share this idea with your friends and click Boost 🚀

GBPUSD Breakout and Potential RetraceHey Traders, in today's trading session we are monitoring GBPUSD for a buying opportunity around 1.31100 zone, GBPUSD was trading in a downtrend and successfully managed to break it out. Currently is in a correction phase in which it is approaching the retrace area at 1.31100 zone.
Trade safe, Joe.

Market Mispricing? EURUSD Ready to Surge on FED PivotHey Traders,
In today’s trading session we are monitoring EURUSD for a buying opportunity around the 1.15300 zone. The pair has been trading in a clear uptrend, and is now entering a healthy correction phase, approaching a key trend support / S&R confluence at 1.15300.
Fundamentals continue to lean strongly in favor of EURUSD bulls:
Markets now expect the FED to cut rates in December, a clear bearish driver for the USD as easing expectations gain traction.
Rumors yesterday suggested that Kevin Hassett is now the top contender for the next FED Chair.
Hassett is widely viewed as the most dovish possible pick, which only deepens downside pressure on the Dollar.
With USD sentiment turning increasingly soft and price nearing a major technical support, the 1.15300 area becomes a highly strategic zone to look for bullish continuation.
Trade safe,
Joe.

GBPUSD Is Going Up! Long!
Here is our detailed technical review for GBPUSD.
Time Frame: 6h
Current Trend: Bullish
Sentiment: Oversold (based on 7-period RSI)
Forecast: Bullish
The market is on a crucial zone of demand 1.309.
The oversold market condition in a combination with key structure gives us a relatively strong bullish signal with goal 1.317 level.
P.S
Overbought describes a period of time where there has been a significant and consistent upward move in price over a period of time without much pullback.
Like and subscribe and comment my ideas if you enjoy them!

EURUSD Will Move Higher! Buy!
Here is our detailed technical review for EURUSD.
Time Frame: 1h
Current Trend: Bullish
Sentiment: Oversold (based on 7-period RSI)
Forecast: Bullish
The market is testing a major horizontal structure 1.151.
Taking into consideration the structure & trend analysis, I believe that the market will reach 1.155 level soon.
P.S
Please, note that an oversold/overbought condition can last for a long time, and therefore being oversold/overbought doesn't mean a price rally will come soon, or at all.
Like and subscribe and comment my ideas if you enjoy them!

EURUSD My Opinion! BUY!
My dear friends,
Please, find my technical outlook for EURUSD below:
The instrument tests an important psychological level 1.1515
Bias - Bullish
Technical Indicators: Supper Trend gives a precise Bullish signal, while Pivot Point HL predicts price changes and potential reversals in the market.
Target - 1.1553
About Used Indicators:
Super-trend indicator is more useful in trending markets where there are clear uptrends and downtrends in price.
Disclosure: I am part of Trade Nation's Influencer program and receive a monthly fee for using their TradingView charts in my analysis.
———————————
WISH YOU ALL LUCK

USDCHF: Bullish Continuation & Long Trade
USDCHF
- Classic bullish formation
- Our team expects pullback
SUGGESTED TRADE:
Swing Trade
Long USDCHF
Entry - 0.8041
Sl - 0.8030
Tp - 0.8062
Our Risk - 1%
Start protection of your profits from lower levels
Disclosure: I am part of Trade Nation's Influencer program and receive a monthly fee for using their TradingView charts in my analysis.
❤️ Please, support our work with like & comment! ❤️

USDCAD Expected Growth! BUY!
My dear friends,
USDCAD looks like it will make a good move, and here are the details:
The market is trading on 1.4039 pivot level.
Bias - Bullish
Technical Indicators: Supper Trend generates a clear long signal while Pivot Point HL is currently determining the overall Bullish trend of the market.
Goal - 1.4080
About Used Indicators:
Pivot points are a great way to identify areas of support and resistance, but they work best when combined with other kinds of technical analysis
Disclosure: I am part of Trade Nation's Influencer program and receive a monthly fee for using their TradingView charts in my analysis.
———————————
WISH YOU ALL LUCK

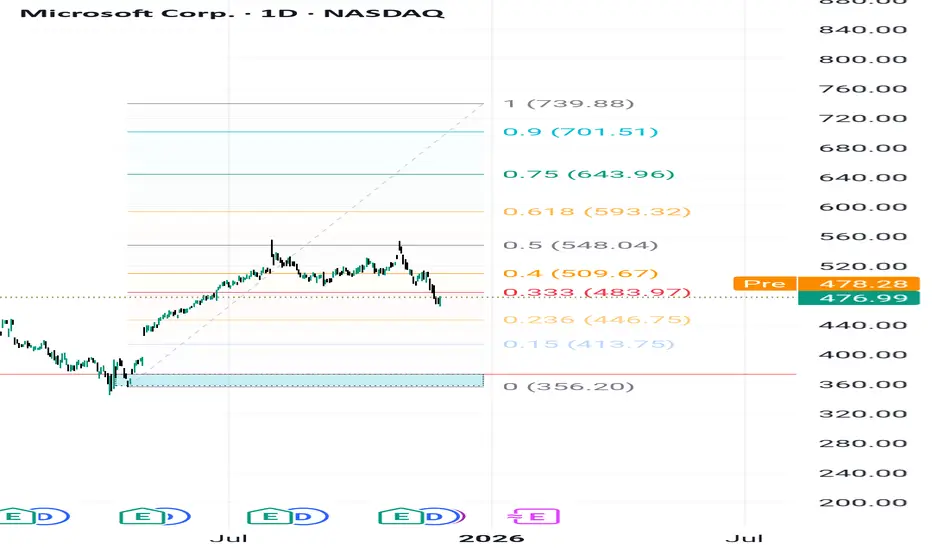
MSFT — Bullish Structure Intact Above 373.22, Targeting 739.88.Microsoft remains in a well-defined long-term bullish structure despite the current pullback from the 0.40–0.50 Fibonacci resistance cluster. The recent decline appears corrective in nature and does not signal any structural weakness as long as the stock preserves its main support foundation.
Key Support (Primary Structural Level): 373.22
The level at 373.22 represents the most critical demand zone on the chart.
It marks:
The origin of the previous bullish impulse,
A zone of strong institutional accumulation,
The base that
continues to anchor the long-term trend.
As long as price stays above 373.22, the broader upward cycle remains intact.
Fibonacci Expansion Targets (Long-Term Investor Levels)
The current impulsive leg projects the following upside targets:
483.97 (0.333)
509.67 (0.40)
548.04 (0.50)
593.32 (0.618)
643.96 (0.75)
701.51 (0.90)
739.88 (1.00 — primary long-term extension)
These levels correspond to strategic zones where institutional models anticipate consolidation or profit-taking.
Market Structure & Investor Outlook
The long-term trend remains strongly bullish.
The current pullback is normal retracement behavior.
Secondary demand pockets sit at 446.75 and 413.75 if the pullback deepens.
Macro structure remains fully intact above 373.22.
Bullish Continuation Scenario (Base Case)
If MSFT holds above 483.97 and regains momentum, the price can progress through:
509 → 548 → 593 → 643 → 701 → 739.88
This represents the natural continuation path of the current expansion.
Bearish Scenario (Limited & Non-Structural)
The only valid bearish scenario for now is a return to retest the key support at 373.22.
This move would represent:
A technical retest,
A liquidity sweep,
A refresh of institutional demand, not a trend reversal
As long as price holds 373.22, the long-term bullish structure remains unchanged.
Conclusion
Microsoft continues to demonstrate strong long-term structural integrity.
The only bearish possibility is a corrective move back toward the 373.22 support, after which the broader trend is expected to resume toward the long-term targets: 509, 548, 593, 643, 701, and 739.88.
BTCUSD Long: Demand-Zone Rebound Targets $91,000 ResistanceHello traders! BTCUSD continues to trade inside a well-defined Descending Channel, confirming a strong bearish structure where the market consistently forms lower highs and lower lows. Throughout the chart, price repeatedly respects both channel boundaries, showing that sellers continue to dominate the trend. Earlier in the chart, Bitcoin created a Range Phase, indicating consolidation before sellers regained control and pushed price back down toward the mid-channel zone. Each time BTCUSD approached the channel’s upper boundary, it reacted with a clear pivot rejection, which initiated new downward waves — a classic pattern showing persistent sell-side pressure. A notable highlight is the Fake Breakout below the $84,000 area, where liquidity was swept before buyers stepped back in. This move created a strong reaction and initiated the current upward correction. The Demand Line drawn from recent lows has supported the price, helping BTCUSD climb back toward the mid-channel area.
Currently, Bitcoin is trading just above the $84,000 Demand Zone, which previously generated significant buying interest. The structure suggests that buyers may continue defending this zone, especially as price remains supported by the rising demand trendline. However, BTCUSD is still positioned below the $91,000–$92,000 Supply Zone, where sellers previously took control and where another reaction may occur.
My scenario, If buyers maintain momentum, price may attempt a corrective push toward the $91,000 resistance level — a key supply area aligned with the descending channel’s mid-line. A rejection here would be fully in line with the prevailing bearish trend. Manage your risk!
