BTCUSD Pauses at Structure Top — Bulls Aim for 95,500 RetestHello traders! Here is my breakdown of the current BTCUSD setup. After a strong bearish phase, Bitcoin found support near the major Support Level around $89,100. Before reaching this zone, price was trading inside a broad descending channel, where both the Resistance Line and Support Line guided the downtrend. A fake breakout occurred near the lower boundary, showing early buyer interest, but overall momentum remained bearish until price reached the support. From there, BTC formed a clear sideways Range, signaling accumulation before a reversal attempt. Once buyers gained strength, price broke out of the range and shifted into a bullish structure. BTC began climbing within a rising wedge-like channel, respecting both the ascending Support Line and the diagonal Resistance Line. Along the way, the market formed multiple breakouts and fake breakouts, confirming active participation from both sides. However, buyers consistently defended the rising trendline, maintaining higher lows while approaching the key horizontal Resistance Level near $95,500. Currently, BTCUSD is pulling back slightly after touching the wedge resistance. As long as price holds above the ascending support and stays above $89,100, the bullish structure remains intact. My scenario suggests a potential continuation toward TP1 → $95,500 upon a successful rebound from the local support. If the market breaks below the rising structure, however, a deeper correction may unfold before any further upward attempt. For now, buyers are favored while the price remains inside the ascending channel. Please share this idea with your friends and click Boost 🚀
Long!!

AUDCAD: Bullish Continuation is Expected! Here is Why:
Balance of buyers and sellers on the AUDCAD pair, that is best felt when all the timeframes are analyzed properly is shifting in favor of the buyers, therefore is it only natural that we go long on the pair.
Disclosure: I am part of Trade Nation's Influencer program and receive a monthly fee for using their TradingView charts in my analysis.
❤️ Please, support our work with like & comment! ❤️

GOLD The Target Is UP! BUY!
My dear subscribers,
GOLD looks like it will make a good move, and here are the details:
The market is trading on 4206.0 pivot level.
Bias - Bullish
My Stop Loss - 4196.6
Technical Indicators: Both Super Trend & Pivot HL indicate a highly probable Bullish continuation.
Target - 4221.3
About Used Indicators:
The average true range (ATR) plays an important role in 'Supertrend' as the indicator uses ATR to calculate its value. The ATR indicator signals the degree of price volatility.
Disclosure: I am part of Trade Nation's Influencer program and receive a monthly fee for using their TradingView charts in my analysis.
———————————
WISH YOU ALL LUCK

EURUSD Sellers In Panic! BUY!
My dear followers,
I analysed this chart on EURUSD and concluded the following:
The market is trading on 1.1642 pivot level.
Bias - Bullish
Technical Indicators: Both Super Trend & Pivot HL indicate a highly probable Bullish continuation.
Target - 1.1653
Safe Stop Loss - 1.1636
About Used Indicators:
A super-trend indicator is plotted on either above or below the closing price to signal a buy or sell. The indicator changes color, based on whether or not you should be buying. If the super-trend indicator moves below the closing price, the indicator turns green, and it signals an entry point or points to buy.
Disclosure: I am part of Trade Nation's Influencer program and receive a monthly fee for using their TradingView charts in my analysis.
———————————
WISH YOU ALL LUCK

Nasdaq nearing critical balanceIn November, we observed a Hagopian pattern - the market failed to reach the centerline despite the high probability of doing so (see weekly chart left). MACD-V is in divergence since then. A sign to be especially cautious.
This led to the current rally lasting more than ten days without a single close below a prior low. It seems the Plunge Protection Team may be at work.
In any case, we are now approaching the yellow centerline, the market’s point of balance. From there, the market will determine whether we push once more above the yellow centerline toward the white U-MLH, or turn downward, producing a second Hagopian and falling back toward the white centerline.
If the second scenario unfolds, the path toward significantly lower prices would be wide open.
Let’s see what we get for Christmas…

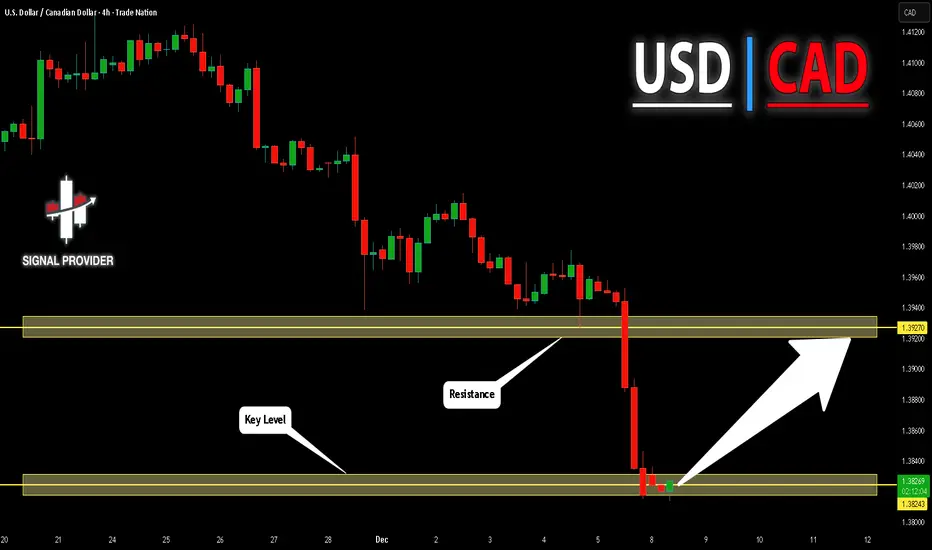
USDCAD Will Go Higher! Long!
Take a look at our analysis for USDCAD.
Time Frame: 4h
Current Trend: Bullish
Sentiment: Oversold (based on 7-period RSI)
Forecast: Bullish
The market is on a crucial zone of demand 1.382.
The oversold market condition in a combination with key structure gives us a relatively strong bullish signal with goal 1.392 level.
P.S
Please, note that an oversold/overbought condition can last for a long time, and therefore being oversold/overbought doesn't mean a price rally will come soon, or at all.
Like and subscribe and comment my ideas if you enjoy them!
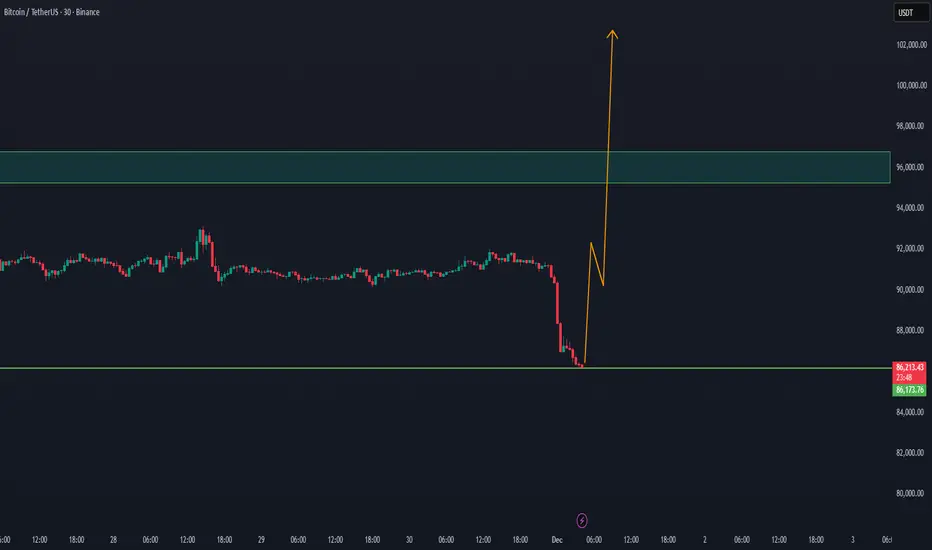
AFTER THE EXPECTED CORRECTION BTC ON WAY TO 100k+WE did expect with the last BTC update that a correction could happen at Bitcoin.
With the new study update, there is a good chance BTC will return step by step to the 100k level
Since the price action, new whale volume can enter BTC.
our previous update with the expectation of BTC fall
AUDUSD Potential UpsidesHey Traders, in tomorrow's trading session we are monitoring AUDUSD for a buying opportunity around 0.66300 zone, AUDUSD is trading in an uptrend and currently is in a correction phase in which it is approaching the trend at 0.66300 support and resistance area.
Trade safe, Joe.

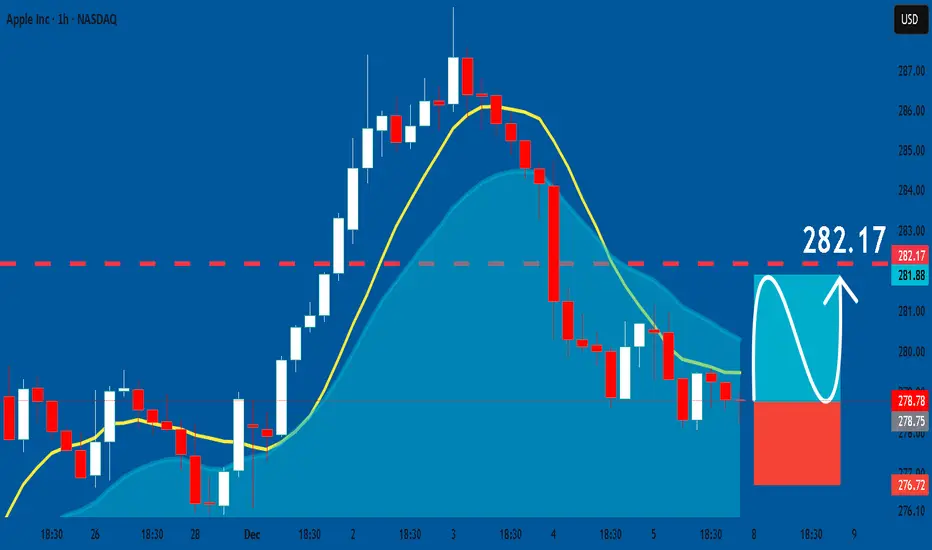
APPLE: Bullish Continuation & Long Signal
APPLE
- Classic bullish pattern
- Our team expects retracement
SUGGESTED TRADE:
Swing Trade
Buy EURUSD
Entry - 278.78
Stop- 276.72
Take - 282.17
Our Risk - 1%
Start protection of your profits from lower levels
Disclosure: I am part of Trade Nation's Influencer program and receive a monthly fee for using their TradingView charts in my analysis.
❤️ Please, support our work with like & comment! ❤️
XAUUSD Long: The 4,160 Support Holds – Path to 4,260 is OpenHello, traders! The price action for XAUUSD is currently developing within a well-defined ascending trend structure, supported by a rising major Trend Line from the lows. The market previously showed multiple rejections from the Triangle Supply Line, each marked by clear breakout attempts followed by corrective pullbacks. These reactions formed a sequence of higher lows, confirming that buyers remain in control of the broader structure.
Currently, after the last strong impulsive move upward, Gold reacted from the Supply Zone around 4,260, forming a short-term corrective phase while respecting the rising Triangle Demand Line near the 4,160 demand level. Price is now compressing between the descending supply line and the ascending demand line, creating a tightening triangle structure that signals growing pressure for a directional expansion. This compression reflects a balance between profit-taking sellers at resistance and aggressive dip-buyers along demand.
My scenario for the further development is bullish continuation as long as price holds above the Triangle Demand Line and the 4,160 demand zone. I expect a rebound from current levels, followed by a renewed attack on the 4,260 Supply Zone. If buyers manage to produce a clean breakout above this resistance, Gold may accelerate toward higher targets with strong momentum continuation. However, if the supply zone holds and price breaks below the demand line, a deeper corrective pullback toward the main rising Trend Line could develop. For now, the structure favors buyers, with the key focus on a breakout attempt toward 4,260. Manage your risk!

BTCUSDT Long: Buyers Defend 91K Zone – Targeting 96K ExpansionHello, traders! The current BTCUSDT price action is developing within a strongly structured bullish environment after a prolonged decline driven by the Descending Channel. Earlier, the market broke down from the upper supply region and continued to move lower while respecting the descending channel boundaries. After reaching a pivot low near the demand zone around 91,000, buyers stepped in, initiating a reversal and shifting momentum to the upside. Following this, Bitcoin formed a clean Ascending Channel that confirmed growing bullish pressure. Price then entered a Range phase, indicating temporary equilibrium before the next impulsive move. After completing this consolidation, BTCUSDT created a clear Head and Shoulders reversal structure near demand, signaling a strong bullish reversal. Buyers took control and pushed price sharply upward, breaking through the range and reclaiming higher structure levels.
Currently, BTCUSDT is trading inside a new Ascending Channel, steadily climbing toward the 96,000 supply level, where sellers previously reacted. As long as price remains above the 91,000 demand zone and continues to respect the ascending channel structure, the bullish scenario remains valid. The next upside target is the 96,000 resistance area, aligned with the upper channel boundary.
My scenario is a continuation toward 96,000 as long as buyers maintain control of the channel. However, a strong rejection from this supply zone may trigger a corrective pullback back toward demand before buyers attempt another move upward. Manage your risk!

EURUSD Uptrend Structure Intact — Path Toward 1.1700 ResistanceHello traders! I want to share my view on the current EURUSD setup. After a corrective decline, the pair formed a solid local bottom around the Support Level near 1.16200–1.16400, where buyers stepped in and stopped the downward momentum. As shown on the chart, price is now trading inside a clear ascending structure, supported by the rising Support Line and guided by a parallel Resistance Line, forming a well-defined upward channel. Inside this structure, the Buyer Zone has played a key role, serving as the base for multiple impulsive breakouts in the past. Several breakdown attempts turned into fake breakouts, confirming that buyers continue to defend this area and maintain short-term trend control. After these rebounds, EURUSD pushed into the upper part of the channel, reaching the Resistance Line and forming a local rejection that caused a pullback back toward the Buyer Zone. Currently, price is hovering near the ascending support line, and as long as EURUSD stays above the 1.16400 support area, the bullish scenario remains intact. If buyers successfully defend this zone and maintain structure inside the rising channel, I expect the market to move toward TP1 → 1.17000, which aligns with the major Resistance Level highlighted on the chart. A clean breakout above this level would open the way for further continuation, potentially driving the pair deeper into the higher resistance zone. However, if the price breaks below the Buyer Zone and violates the ascending Support Line, the bullish scenario becomes invalid, and the pair may revisit lower support levels around the 1.16000 area. For now, the structure remains moderately bullish as long as demand holds and EURUSD continues respecting the rising channel. Please share this idea with your friends and click Boost 🚀

NML (PSX) – Bullish Setup on 4H Chart📈 Nishat Mills (NML) – 4H Bullish Reversal Setup with Multi-High Divergence
📍 Entry Zone: 148.96 – 150.75
🛑 Stop Loss: Below 140.93
🎯 Targets: TP1 @ 156 | TP2 @ 164 | TP3 @ 172+
✅ Key Trigger: Bullish RSI Divergence + Higher Lows (LL) forming after sharp decline
✅ Confirmation: Price reclaiming key trendline & breaking descending structure
✅ Risk-Reward: > 1:3 (Conservative entry near support)
Disclaimer:
*This idea is for educational and research purposes only, based on technical patterns. It is not investment advice. Always conduct your own analysis (DYOR) and manage your risk carefully before entering any trade.*

BTCUSD Massive Long! BUY!
My dear subscribers,
My technical analysis for BTCUSD is below:
The price is coiling around a solid key level - 89308
Bias - Bullish
Technical Indicators: Pivot Points Low anticipates a potential price reversal.
Super trend shows a clear buy, giving a perfect indicators' convergence.
Goal - 91550
About Used Indicators:
By the very nature of the supertrend indicator, it offers firm support and resistance levels for traders to enter and exit trades. Additionally, it also provides signals for setting stop losses
Disclosure: I am part of Trade Nation's Influencer program and receive a monthly fee for using their TradingView charts in my analysis.
———————————
WISH YOU ALL LUCK

EURUSD: Long Trading Opportunity
EURUSD
- Classic bullish setup
- Our team expects bullish continuation
SUGGESTED TRADE:
Swing Trade
Long EURUSD
Entry Point - 1.1642
Stop Loss - 1.1635
Take Profit - 1.1656
Our Risk - 1%
Start protection of your profits from lower levels
Disclosure: I am part of Trade Nation's Influencer program and receive a monthly fee for using their TradingView charts in my analysis.
❤️ Please, support our work with like & comment! ❤️

NZD/CAD BULLS ARE STRONG HERE|LONG
Hello, Friends!
The BB lower band is nearby so NZD-CAD is in the oversold territory. Thus, despite the downtrend on the 1W timeframe I think that we will see a bullish reaction from the support line below and a move up towards the target at around 0.802.
Disclosure: I am part of Trade Nation's Influencer program and receive a monthly fee for using their TradingView charts in my analysis.
✅LIKE AND COMMENT MY IDEAS✅

AUD/CAD LONG FROM SUPPORT
Hello, Friends!
Bullish trend on AUD/CAD, defined by the green colour of the last week candle combined with the fact the pair is oversold based on the BB lower band proximity, makes me expect a bullish rebound from the support line below and a retest of the local target above at 0.921.
Disclosure: I am part of Trade Nation's Influencer program and receive a monthly fee for using their TradingView charts in my analysis.
✅LIKE AND COMMENT MY IDEAS✅

CHF/JPY BUYERS WILL DOMINATE THE MARKET|LONG
CHF/JPY SIGNAL
Trade Direction: long
Entry Level: 192.579
Target Level: 193.023
Stop Loss: 192.284
RISK PROFILE
Risk level: medium
Suggested risk: 1%
Timeframe: 1h
Disclosure: I am part of Trade Nation's Influencer program and receive a monthly fee for using their TradingView charts in my analysis.
✅LIKE AND COMMENT MY IDEAS✅

CAD/JPY BULLS ARE GAINING STRENGTH|LONG
Hello,Friends!
CAD/JPY pair is in the uptrend because previous week’s candle is green, while the price is obviously falling on the 4H timeframe. And after the retest of the support line below I believe we will see a move up towards the target above at 111.532 because the pair is oversold due to its proximity to the lower BB band and a bullish correction is likely.
Disclosure: I am part of Trade Nation's Influencer program and receive a monthly fee for using their TradingView charts in my analysis.
✅LIKE AND COMMENT MY IDEAS✅

AUDCAD: Long Trade Explained
AUDCAD
- Classic bullish formation
- Our team expects growth
SUGGESTED TRADE:
Swing Trade
Buy AUDCAD
Entry Level - 0.9188
Sl - 0.9176
Tp - 0.9210
Our Risk - 1%
Start protection of your profits from lower levels
Disclosure: I am part of Trade Nation's Influencer program and receive a monthly fee for using their TradingView charts in my analysis.
❤️ Please, support our work with like & comment! ❤️

EURUSD Technical Analysis! BUY!
My dear followers,
This is my opinion on the EURUSD next move:
The asset is approaching an important pivot point 1.1643
Bias - Bearish
Safe Stop Loss - 1.1635
Technical Indicators: Supper Trend generates a clear short signal while Pivot Point HL is currently determining the overall Bearish trend of the market.
Goal - 1.1658
About Used Indicators:
For more efficient signals, super-trend is used in combination with other indicators like Pivot Points.
Disclosure: I am part of Trade Nation's Influencer program and receive a monthly fee for using their TradingView charts in my analysis.
———————————
WISH YOU ALL LUCK

GOLD Sellers In Panic! BUY!
My dear followers,
I analysed this chart on GOLD and concluded the following:
The market is trading on 4192.4 pivot level.
Bias - Bullish
Technical Indicators: Both Super Trend & Pivot HL indicate a highly probable Bullish continuation.
Target - 4205.9
Safe Stop Loss - 4184.7
About Used Indicators:
A super-trend indicator is plotted on either above or below the closing price to signal a buy or sell. The indicator changes color, based on whether or not you should be buying. If the super-trend indicator moves below the closing price, the indicator turns green, and it signals an entry point or points to buy.
Disclosure: I am part of Trade Nation's Influencer program and receive a monthly fee for using their TradingView charts in my analysis.
———————————
WISH YOU ALL LUCK

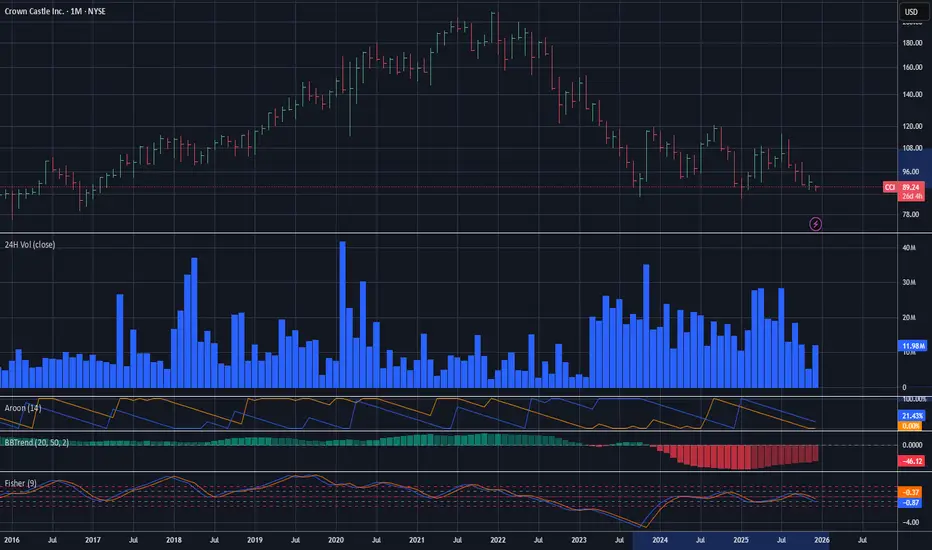
Crown Castle - Next Long Target $95Bearish trendline support seems to be breaking. The patterns look like a possible retracement could be soon. As always, none of this is investment or financial advice. Please do your own due diligence and research.