NZDJPY Will Go Higher! Buy!
Here is our detailed technical review for NZDJPY.
Time Frame: 2h
Current Trend: Bullish
Sentiment: Oversold (based on 7-period RSI)
Forecast: Bullish
The market is testing a major horizontal structure 86.456.
Taking into consideration the structure & trend analysis, I believe that the market will reach 87.323 level soon.
P.S
Please, note that an oversold/overbought condition can last for a long time, and therefore being oversold/overbought doesn't mean a price rally will come soon, or at all.
Like and subscribe and comment my ideas if you enjoy them!
Long!!

GBPJPY Will Go Up! Long!
Take a look at our analysis for GBPJPY.
Time Frame: 1h
Current Trend: Bullish
Sentiment: Oversold (based on 7-period RSI)
Forecast: Bullish
The market is approaching a key horizontal level 201.854.
Considering the today's price action, probabilities will be high to see a movement to 202.612.
P.S
The term oversold refers to a condition where an asset has traded lower in price and has the potential for a price bounce.
Overbought refers to market scenarios where the instrument is traded considerably higher than its fair value. Overvaluation is caused by market sentiments when there is positive news.
Like and subscribe and comment my ideas if you enjoy them!

EURCHF: Bullish Continuation is Highly Probable! Here is Why:
Balance of buyers and sellers on the EURCHF pair, that is best felt when all the timeframes are analyzed properly is shifting in favor of the buyers, therefore is it only natural that we go long on the pair.
Disclosure: I am part of Trade Nation's Influencer program and receive a monthly fee for using their TradingView charts in my analysis.
❤️ Please, support our work with like & comment! ❤️

GBPCAD Is Going Up! Buy!
Please, check our technical outlook for GBPCAD.
Time Frame: 1h
Current Trend: Bullish
Sentiment: Oversold (based on 7-period RSI)
Forecast: Bullish
The market is trading around a solid horizontal structure 1.867.
The above observations make me that the market will inevitably achieve 1.872 level.
P.S
The term oversold refers to a condition where an asset has traded lower in price and has the potential for a price bounce.
Overbought refers to market scenarios where the instrument is traded considerably higher than its fair value. Overvaluation is caused by market sentiments when there is positive news.
Like and subscribe and comment my ideas if you enjoy them!

GOLD: Long Trading Opportunity
GOLD
- Classic bullish setup
- Our team expects bullish continuation
SUGGESTED TRADE:
Swing Trade
Long GOLD
Entry Point - 4137.6
Stop Loss - 4123.3
Take Profit - 4164.5
Our Risk - 1%
Start protection of your profits from lower levels
Disclosure: I am part of Trade Nation's Influencer program and receive a monthly fee for using their TradingView charts in my analysis.
❤️ Please, support our work with like & comment! ❤️

NZDJPY Expected Growth! BUY!
My dear followers,
This is my opinion on the NZDJPY next move:
The asset is approaching an important pivot point 86.487
Bias - Bullish
Technical Indicators: Supper Trend generates a clear long signal while Pivot Point HL is currently determining the overall Bullish trend of the market.
Goal - 87.374
About Used Indicators:
For more efficient signals, super-trend is used in combination with other indicators like Pivot Points.
Disclosure: I am part of Trade Nation's Influencer program and receive a monthly fee for using their TradingView charts in my analysis.
———————————
WISH YOU ALL LUCK

BITCOIN – WAIT FOR ARBITRAGE TO BALANCE SPOT MARKETSTraders,
What a week it’s been. A lot of people got rekt, and I hope you were on the right side of the move. If not, it’s fine: this is how markets reset. I’ve been getting a lot of questions about what comes next, so here’s my current view.
The Situation
Binance/USDT wicked down to 102,000
Binance/USD wicked to 107,485.59
Coinbase/USD wicked to 107,000
That’s roughly a $5,000 difference, or about 5%, which is huge for major spot markets.
Under normal conditions, spreads between top venues like Coinbase and Binance are usually below 1% (Bitwise, 2019 SEC Study on Real Bitcoin Trading Volume - for the nerds interested ;)).
Why It Matters
Both Binance and Coinbase printed round-number lows (102k and 107k).
Round-number lows are considered “bad lows” because they attract clustered stop-loss orders and create obvious liquidity pools underneath.
Studies on market microstructure (e.g., Osler 2003; Kamps & Klein 2018) confirm that price clustering at round numbers is a real behavioral bias in FX and crypto markets.
Real market bottoms are messy, chaotic, and rarely form at clean, even levels.
These “perfect” lows often get revisited or swept later as the market clears liquidity and finds true balance.
How the Flush Works in Spot Markets
Even though spot markets don’t have leverage liquidations, they still experience stop cascades and panic selling.
When price breaks below a clean low, it triggers stops, sending a surge of sell orders into thin liquidity.
Market makers step in to absorb those orders and rebuild liquidity from a more stable base.
This is what traders call a spot flush — the market removing weak hands and resetting liquidity.
Conceptually, it’s the same as a liquidation flush in futures, just without forced margin calls.
What Arbitrage Does
Arbitrage keeps prices between exchanges in check.
When Bitcoin trades cheaper on Binance than on Coinbase, arbitrage traders buy on Binance and sell on Coinbase.
This pushes the cheap venue’s price up and the expensive one down until they align.
Makarov & Schoar (2020, NBER) showed that cross-exchange price deviations in Bitcoin are temporary and mean-reverting, driven by arbitrage capital restoring equilibrium.
Kaiko research (2021–2023) also found that USD and USDT pairs often decouple during stress events, especially when stablecoin liquidity or banking rails get disrupted, and later realign once volatility settles.
That’s exactly what we’re seeing now: a temporary dislocation that arbitrage will eventually close.
What I Expect
Binance already swept liquidity down to 102k.
Coinbase still has a clean 107k low that hasn’t been tested.
To rebalance both exchanges, I expect Coinbase to trade within 1% of the Binance 102k low, meaning roughly 103k–104k.
That would bring both markets back into alignment and complete a proper spot flush.
This isn’t a guaranteed move, but it’s a logical rebalancing target supported by historical arbitrage behavior.
What Could Happen Before That
We could still see Bitcoin move back toward 118k–120k before a potential drop.
After major liquidation events, markets often retrace sharply as liquidity rebuilds and shorts get squeezed.
A move higher doesn’t invalidate the idea of a later sweep; it could just be part of the natural reset phase before the market finds true equilibrium.
What I’m Watching
The spread between Coinbase/USD and Binance/USDT narrowing from around 5% to about 1%.
Coinbase breaking below 107k and testing the 104–102k zone.
A liquidity sweep followed by a strong reclaim and visible buy volume.
If we move up first, I’ll watch price behavior around 118k–120k for signs of exhaustion.
My Plan (Not Financial Advice)
I’m staying patient and letting the market mechanics reset.
If Coinbase trades into the 103k–102k zone, that’s my “let’s see what’s going on now” trigger.
That doesn’t mean I’ll instantly go long — it means I’ll start watching the data:
Volume and delta (are buyers stepping in?)
Strength of reclaim (is the recovery fast and decisive?)
Order book depth (is liquidity returning?)
What is Open Interest doing?
Do we see absorption? Or maybe a continuation pattern even?
Only if those metrics confirm strength will I consider entering.If not, I’ll stay flat and wait for the next confirmation.
So, TLDR;
Both Binance and Coinbase printed clean, round-number lows that are likely to be swept again. Arbitrage will eventually bring the spot markets back into balance, which should pull Coinbase closer to Binance’s 102k low. We might even see a push toward 120k first as liquidity resets. Either way, patience is key: let arbitrage, liquidity, and order flow do their job before taking any position.
And remember: Patience in trading isn’t about doing nothing, it’s about waiting for the odds to align in your favor. Chasing every move might feed the ego, but patience compounds the account. The market always rewards the trader who can sit still when everyone else is reacting.
Trade safe!

EURUSD On The Rise! BUY!
My dear friends,
My technical analysis for EURUSD is below:
The market is trading on 1.1559 pivot level.
Bias - Bullish
Technical Indicators: Both Super Trend & Pivot HL indicate a highly probable Bullish continuation.
Target - 1.1580
Recommended Stop Loss - 1.1547
About Used Indicators:
A pivot point is a technical analysis indicator, or calculations, used to determine the overall trend of the market over different time frames.
Disclosure: I am part of Trade Nation's Influencer program and receive a monthly fee for using their TradingView charts in my analysis.
———————————
WISH YOU ALL LUCK

TESLA My Opinion! BUY!
My dear friends,
Please, find my technical outlook for TESLA below:
The instrument tests an important psychological level 413.27
Bias - Bullish
Technical Indicators: Supper Trend gives a precise Bullish signal, while Pivot Point HL predicts price changes and potential reversals in the market.
Target - 428.09
Recommended Stop Loss - 405.57
About Used Indicators:
Super-trend indicator is more useful in trending markets where there are clear uptrends and downtrends in price.
Disclosure: I am part of Trade Nation's Influencer program and receive a monthly fee for using their TradingView charts in my analysis.
———————————
WISH YOU ALL LUCK

Post Flash-Crash BTC Despite such a large sell-off event, has the outlook on BTC actually changed? Structurally BTC remains very much rangebound with two clearly definable halves of the range. That is until Fridays move off the back of a Tariff Tweet from President Trump causing a liquidation event similar to that of April earlier this year and the Covid crash of 2020.
Bitcoin was less effected when compared to altcoins as is usually the case, some majors dropping as much as 80% in a single 1h candle! An entire bear market in an afternoon. Bitcoin on most exchanges fell roughly 20% on the news and eventually found support at range lows ($100,000), a significant amount of this drop got bought up and so BTC finds itself hovering around range midpoint.
To me this is a no trade zone initially, there is no clear directional bias that is actionable at this time but I am looking for clues as to where price may be going next:
- Should BTC stay above midpoint the next clear resistance level is 0.75 ($117,605). On the lower time frames the trend is bearish, 0.75 would be a good place for the bears to defend.
- A loss of the midpoint would open the door to backfilling the wick, this could get ugly as on the higher time frames a new lower low and price acceptance lower would signal a bearish shift in structure. Calls for "the top is in" will get much louder and so will the 4 year cycle theory comparisons.
- A V-shaped recovery and move straight to the highs would be max pain after such a brutal move down. Although IMO it's the least likely I would not rule it out.
EURUSD: Long Trade with Entry/SL/TP
EURUSD
- Classic bullish formation
- Our team expects pullback
SUGGESTED TRADE:
Swing Trade
Long EURUSD
Entry - 1.1574
Sl - 1.1560
Tp - 1.1598
Our Risk - 1%
Start protection of your profits from lower levels
Disclosure: I am part of Trade Nation's Influencer program and receive a monthly fee for using their TradingView charts in my analysis.
❤️ Please, support our work with like & comment! ❤️

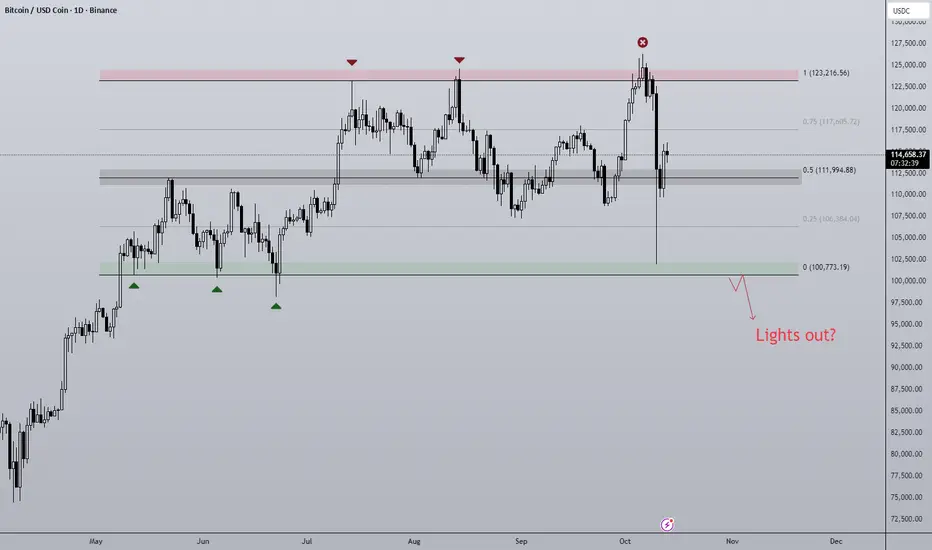
13/10/25 Weekly OutlookLast weeks high: $126,237.39
Last weeks low: $102,038.44
Midpoint: $114,137.92
Well that was an interesting week... A small reminder that when Trump talks about tariffs the markets move, and move fast!
From All-Time-High at the beginning of the week to a -19.2% move, a single hourly candle had -10.56% drawdown alone!
What can be learnt from this? Despite all the technical analysis in the world, if the President of the United States makes an announcement it can shift the market greatly causing a leverage unwind via liquidations that cascade aggressively. Although these large scale crashes are rare, they are inevitable in this market and this will not be the last of its kind.
This week will be very interesting because generally we do see a lot of backfilling the wick which would mean revisiting the key S/R level at 0.25 ($108,000). The bulls would not want to see price acceptance under this level or IMO this is the beginning of a bearish shift in HTF structure. This potential shift in structure would also line up with the 4 year cycle theory as October marks the end of the bull market.
On the other hand, the bounce from the low has been strong, although still some way off the origin of the dump a lot of ground has been recovered. In the past these liquidation events have marked local lows in the market and serve as a launchpad for the next leg up. I do think it's too early to tell if that is the case this time around, I am in no rush to position either way until at least Mondays range is established.
The altcoin market took a far worse turn, majors sinking as much as 80% in a single move! This week will be important to learn what projects are truly supported/fundamentally sound by how they recover.
Projects such as: ZEC, TAO, ANYONE and BNB have all closed higher than their original price before the crash, other projects may never recover.
Good luck this week everybody!

Bitcoin (BTCUSD): Bearish Short SetupHello everyone, Kilian here.
Let’s take a closer look at BTCUSD with a logical and structured approach.
Currently, the market is showing a classic bearish formation. The price has broken through a key support level and the first signs of dominant short-side pressure are already visible. This is not just noise but a signal that short positions are gaining control.
After the breakdown, the market is pulling back to retest the broken area. In technical analysis, such a retest often confirms that the bearish momentum is intact and that short traders remain in charge.
Given this context, it is unlikely that BTCUSD will recover the old support, which now acts as resistance. A rejection from this level could trigger the next short-driven move, with a projected target around 118,200.
Unless a strong reversal emerges, the probability remains in favor of continued downside pressure.
Stay disciplined, follow the signals carefully, and remember that in trading, logic and risk management always outperform emotions.

NZD/CAD BEST PLACE TO BUY FROM|LONG
Hello, Friends!
NZD/CAD pair is trading in a local downtrend which we know by looking at the previous 1W candle which is red. On the 12H timeframe the pair is going down too. The pair is oversold because the price is close to the lower band of the BB indicator. So we are looking to buy the pair with the lower BB line acting as support. The next target is 0.813 area.
Disclosure: I am part of Trade Nation's Influencer program and receive a monthly fee for using their TradingView charts in my analysis.
✅LIKE AND COMMENT MY IDEAS✅

AUD/CAD BULLS ARE STRONG HERE|LONG
Hello, Friends!
We are going long on the AUD/CAD with the target of 0.917 level, because the pair is oversold and will soon hit the support line below. We deduced the oversold condition from the price being near to the lower BB band. However, we should use low risk here because the 1W TF is red and gives us a counter-signal.
Disclosure: I am part of Trade Nation's Influencer program and receive a monthly fee for using their TradingView charts in my analysis.
✅LIKE AND COMMENT MY IDEAS✅

NZDUSD Trading Opportunity! BUY!
My dear subscribers,
My technical analysis for NZDUSD is below:
The price is coiling around a solid key level - 0.5733
Bias - Bullish
Technical Indicators: Pivot Points High anticipates a potential price reversal.
Super trend shows a clear buy, giving a perfect indicators' convergence.
Goal - 0.5760
About Used Indicators:
By the very nature of the supertrend indicator, it offers firm support and resistance levels for traders to enter and exit trades. Additionally, it also provides signals for setting stop losses
Disclosure: I am part of Trade Nation's Influencer program and receive a monthly fee for using their TradingView charts in my analysis.
———————————
WISH YOU ALL LUCK

EUR/AUD BULLS ARE STRONG HERE|LONG
EUR/AUD SIGNAL
Trade Direction: long
Entry Level: 1.765
Target Level: 1.782
Stop Loss: 1.754
RISK PROFILE
Risk level: medium
Suggested risk: 1%
Timeframe: 9h
Disclosure: I am part of Trade Nation's Influencer program and receive a monthly fee for using their TradingView charts in my analysis.
✅LIKE AND COMMENT MY IDEAS✅

GBP/AUD BULLS ARE GAINING STRENGTH|LONG
GBP/AUD SIGNAL
Trade Direction: long
Entry Level: 2.027
Target Level: 2.033
Stop Loss: 2.022
RISK PROFILE
Risk level: medium
Suggested risk: 1%
Timeframe: 6h
Disclosure: I am part of Trade Nation's Influencer program and receive a monthly fee for using their TradingView charts in my analysis.
✅LIKE AND COMMENT MY IDEAS✅

GBP/JPY BUYERS WILL DOMINATE THE MARKET|LONG
Hello, Friends!
Bullish trend on GBP/JPY, defined by the green colour of the last week candle combined with the fact the pair is oversold based on the BB lower band proximity, makes me expect a bullish rebound from the support line below and a retest of the local target above at 202.880.
Disclosure: I am part of Trade Nation's Influencer program and receive a monthly fee for using their TradingView charts in my analysis.
✅LIKE AND COMMENT MY IDEAS✅

#032: LONG GBP/USD Investment Opportunity
After a period of consolidation, the pair is showing the first signs of strength near a key demand area. Hello, I'm Forex Trader Andrea Russo, an independent trader and prop trader with $200,000 in capital under management. Thank you in advance for your time.
The recent price structure suggests that the bearish pressure is gradually losing steam, while the market appears to be preparing for a possible directional recovery to the upside.
From a technical perspective, the sequence of lower highs and lower lows appears to be slowing. The latest pullback highlighted the absorption of selling pressure and the solid defense of a significant area of liquidity, tested several times in the past—a behavior that often precedes a structural reversal.
At the macroeconomic level, the most recent dynamics point to a temporary equilibrium between the two currencies. Dollar flow remains strong overall, but in the short term, the pound appears capable of recovering some of its lost ground. This scenario opens up room for corrective or technical rebound movements in favor of the British pound.
Market sentiment also still appears strongly biased toward the opposite side, reinforcing a contrarian view. When the majority of traders are positioned in one direction, liquidity tends to move in the opposite direction—and that's often where the best opportunities arise.
In summary, my decision is based on three converging factors: technical stabilization in an area of significant demand, the gradual exhaustion of bearish pressure, and a context of contrarian sentiment. If momentum holds, the subsequent move could unfold with favorable momentum and limited upside resistance.

USDCAD Technical Analysis! BUY!
My dear subscribers,
This is my opinion on the USDCAD next move:
The instrument tests an important psychological level 1.3986
Bias - Bullish
Technical Indicators: Supper Trend gives a precise Bullish signal, while Pivot Point HL predicts price changes and potential reversals in the market.
Target - 1.4010
My Stop Loss - 1.3973
About Used Indicators:
On the subsequent day, trading above the pivot point is thought to indicate ongoing bullish sentiment, while trading below the pivot point indicates bearish sentiment.
Disclosure: I am part of Trade Nation's Influencer program and receive a monthly fee for using their TradingView charts in my analysis.
———————————
WISH YOU ALL LUCK

GBPUSD Massive Long! BUY!
My dear friends,
My technical analysis for GBPUSD is below:
The market is trading on 1.3273 pivot level.
Bias - Bullish
Technical Indicators: Both Super Trend & Pivot HL indicate a highly probable Bullish continuation.
Target - 1.3337
About Used Indicators:
A pivot point is a technical analysis indicator, or calculations, used to determine the overall trend of the market over different time frames.
Disclosure: I am part of Trade Nation's Influencer program and receive a monthly fee for using their TradingView charts in my analysis.
———————————
WISH YOU ALL LUCK

EURUSD Is Bullish! Long!
Here is our detailed technical review for EURUSD.
Time Frame: 9h
Current Trend: Bullish
Sentiment: Oversold (based on 7-period RSI)
Forecast: Bullish
The market is on a crucial zone of demand 1.160.
The oversold market condition in a combination with key structure gives us a relatively strong bullish signal with goal 1.169 level.
P.S
Overbought describes a period of time where there has been a significant and consistent upward move in price over a period of time without much pullback.
Like and subscribe and comment my ideas if you enjoy them!
