NZD/CAD BULLS ARE STRONG HERE|LONG
Hello, Friends!
The BB lower band is nearby so NZD-CAD is in the oversold territory. Thus, despite the downtrend on the 1W timeframe I think that we will see a bullish reaction from the support line below and a move up towards the target at around 0.802.
Disclosure: I am part of Trade Nation's Influencer program and receive a monthly fee for using their TradingView charts in my analysis.
✅LIKE AND COMMENT MY IDEAS✅
Long!!

AUD/CAD LONG FROM SUPPORT
Hello, Friends!
Bullish trend on AUD/CAD, defined by the green colour of the last week candle combined with the fact the pair is oversold based on the BB lower band proximity, makes me expect a bullish rebound from the support line below and a retest of the local target above at 0.921.
Disclosure: I am part of Trade Nation's Influencer program and receive a monthly fee for using their TradingView charts in my analysis.
✅LIKE AND COMMENT MY IDEAS✅

CHF/JPY BUYERS WILL DOMINATE THE MARKET|LONG
CHF/JPY SIGNAL
Trade Direction: long
Entry Level: 192.579
Target Level: 193.023
Stop Loss: 192.284
RISK PROFILE
Risk level: medium
Suggested risk: 1%
Timeframe: 1h
Disclosure: I am part of Trade Nation's Influencer program and receive a monthly fee for using their TradingView charts in my analysis.
✅LIKE AND COMMENT MY IDEAS✅

CAD/JPY BULLS ARE GAINING STRENGTH|LONG
Hello,Friends!
CAD/JPY pair is in the uptrend because previous week’s candle is green, while the price is obviously falling on the 4H timeframe. And after the retest of the support line below I believe we will see a move up towards the target above at 111.532 because the pair is oversold due to its proximity to the lower BB band and a bullish correction is likely.
Disclosure: I am part of Trade Nation's Influencer program and receive a monthly fee for using their TradingView charts in my analysis.
✅LIKE AND COMMENT MY IDEAS✅

AUDCAD: Long Trade Explained
AUDCAD
- Classic bullish formation
- Our team expects growth
SUGGESTED TRADE:
Swing Trade
Buy AUDCAD
Entry Level - 0.9188
Sl - 0.9176
Tp - 0.9210
Our Risk - 1%
Start protection of your profits from lower levels
Disclosure: I am part of Trade Nation's Influencer program and receive a monthly fee for using their TradingView charts in my analysis.
❤️ Please, support our work with like & comment! ❤️

EURUSD Technical Analysis! BUY!
My dear followers,
This is my opinion on the EURUSD next move:
The asset is approaching an important pivot point 1.1643
Bias - Bearish
Safe Stop Loss - 1.1635
Technical Indicators: Supper Trend generates a clear short signal while Pivot Point HL is currently determining the overall Bearish trend of the market.
Goal - 1.1658
About Used Indicators:
For more efficient signals, super-trend is used in combination with other indicators like Pivot Points.
Disclosure: I am part of Trade Nation's Influencer program and receive a monthly fee for using their TradingView charts in my analysis.
———————————
WISH YOU ALL LUCK

GOLD Sellers In Panic! BUY!
My dear followers,
I analysed this chart on GOLD and concluded the following:
The market is trading on 4192.4 pivot level.
Bias - Bullish
Technical Indicators: Both Super Trend & Pivot HL indicate a highly probable Bullish continuation.
Target - 4205.9
Safe Stop Loss - 4184.7
About Used Indicators:
A super-trend indicator is plotted on either above or below the closing price to signal a buy or sell. The indicator changes color, based on whether or not you should be buying. If the super-trend indicator moves below the closing price, the indicator turns green, and it signals an entry point or points to buy.
Disclosure: I am part of Trade Nation's Influencer program and receive a monthly fee for using their TradingView charts in my analysis.
———————————
WISH YOU ALL LUCK

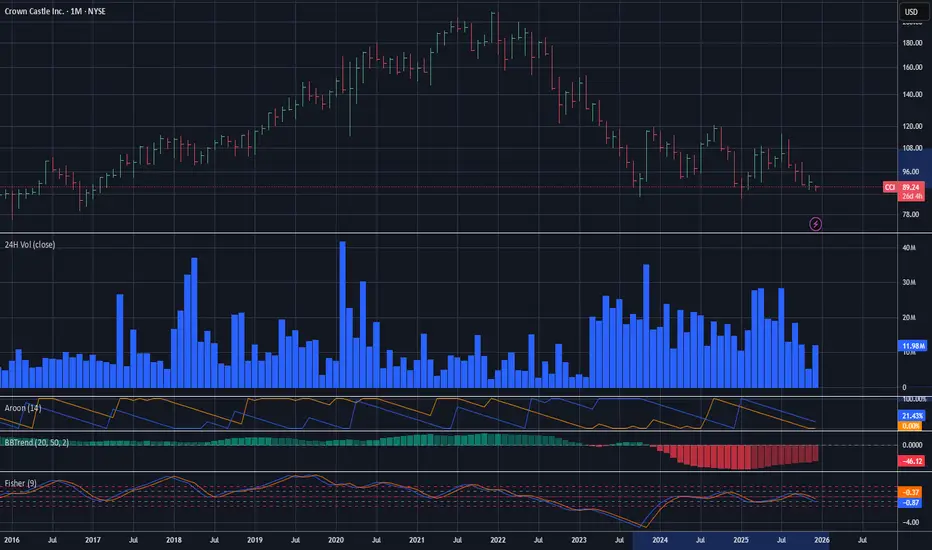
Crown Castle - Next Long Target $95Bearish trendline support seems to be breaking. The patterns look like a possible retracement could be soon. As always, none of this is investment or financial advice. Please do your own due diligence and research.
$UPRO Continued Long $150 by 2027?The AMEX:UPRO index is looking quite healthy and seems to be continuing its positive run along with positive cumulative volume. Overall, with these current patterns $150 by EOY 2026 seems possible. As always, none of this is investment or financial advice. Please do your own due diligence and research.

EURCAD Expected Growth! BUY!
My dear subscribers,
This is my opinion on the EURCAD next move:
The instrument tests an important psychological level 1.6182
Bias - Bullish
Technical Indicators: Supper Trend gives a precise Bullish signal, while Pivot Point HL predicts price changes and potential reversals in the market.
Target - 1.6228
About Used Indicators:
On the subsequent day, trading above the pivot point is thought to indicate ongoing bullish sentiment, while trading below the pivot point indicates bearish sentiment.
Disclosure: I am part of Trade Nation's Influencer program and receive a monthly fee for using their TradingView charts in my analysis.
———————————
WISH YOU ALL LUCK

EURUSD Long: The 1.16200 Support Holds – Path to 1.17000 is OpenHello, traders! The price action for EURUSD is unfolding inside a corrective structure after a prolonged bearish phase that was guided by the descending Triangle Supply Line. The market previously formed a consolidation Range on the left side of the chart before breaking down and continuing lower. Price respected both the descending supply line and the ascending Triangle Demand Line, creating a compression phase that ultimately resulted in a bearish breakout to the downside. After forming a pivot low, EURUSD initiated a strong bullish recovery, breaking back above the former structure and confirming a shift in short-term momentum. The market then formed a clear Head and Shoulders reversal pattern near the Triangle Demand Line, reinforcing buyers’ strength. Following this, price successfully broke through the key Demand Zone around 1.16200, confirming the transition from corrective to bullish conditions.
Currently, EURUSD is retesting this demand area after the breakout, showing signs of support holding. As long as price remains above the 1.16200 demand zone, the bullish scenario remains valid. The next upside objective is the 1.16650–1.17000 Supply Zone, where sellers previously showed strong activity.
My scenario is a clean continuation toward Supply 2 at 1.17000 becomes likely if buyers maintain control. However, a rejection from this supply region could trigger a corrective pullback back toward demand before any further upside continuation. Manage your risk!

BTCUSD: Bullish Pressure Targets the $94,000 Resistance AreaHello everyone, here is my breakdown of the current BTCUSD setup.
Market Analysis
Bitcoin remains in a broader recovery phase after breaking out of the descending wedge structure that previously guided price lower. The initial breakout from the wedge led to a strong bearish continuation, but once BTC reached the major $90,200 Support Zone, selling pressure weakened and buyers stepped in aggressively. This support area has now been defended multiple times, confirming it as a key demand zone. From this base, price formed a clear Upward Channel, signaling a short-term bullish structure with higher lows respected along the channel support.
Currently, BTC attempted to break above the $93,700 Resistance Zone, but this move resulted in a fake breakout, showing that sellers are still active at this level. After the rejection, price pulled back toward the channel support and the $92,000–$90,200 support cluster, where buyers once again defended the market. Currently, BTC is trading back inside the ascending channel and attempting to resume the upward swing toward the upper boundary. The overall structure suggests a recovery trend as long as the price holds above the main support zone.
My Scenario & Strategy
My scenario is bullish, as long as BTC holds above the $90,200 Support Zone and continues to respect the ascending channel structure. I expect price to continue climbing toward the $93,700 Resistance Zone, which remains the key short-term target for buyers. A clean and confirmed breakout above this resistance would open the way for a continuation toward higher levels near the top of the channel.
Therefore, if price reaches the resistance again and produces another strong rejection, we may see a temporary pullback back toward the mid-channel area or even a retest of support. The bullish structure remains valid as long as BTC stays above $90,200. For now, the market supports a long bias with focus on a renewed attempt toward the $93,700 resistance zone.
That's the setup I'm tracking. Thank you for your attention, and always manage your risk.

Gold Eyes 4,207 Rebound as USD Softens & Venezuela Tensions RiseHey Traders, in today’s trading session we are monitoring XAUUSD for a potential buying opportunity around the 4,207 zone. Gold continues to trade within a broader uptrend, and the current pullback is bringing price into a key support–resistance confluence aligned with the ascending trend structure.
Fundamentals:
The US Dollar remains under pressure, with markets increasingly leaning toward a dovish shift from the Federal Reserve, reinforcing gold’s classic negative correlation with the USD. A softer Dollar environment typically boosts demand for metals, and this week’s macro flow continues to point in that direction.
At the same time, geopolitical tensions between the U.S. and Venezuela are escalating, increasing global uncertainty and driving markets toward safe-haven assets. Gold is already reflecting this risk premium, and any further escalation could accelerate flows into XAU.
Next Step:
We’re watching price reaction closely around 4,207 for a potential continuation of the broader bullish structure.
Trade safe,
Joe.

Gold Bulls Hold Control — Targeting $4,320 ResistanceHello traders! Here’s my technical outlook on XAU/USD (Gold) based on the current market structure shown on the chart. After a strong bullish impulse earlier in the period, Gold formed a distribution Range below the main Resistance Level, where multiple upside attempts were rejected and the price eventually turned around from the upper range boundary. This rejection initiated a corrective decline that respected the descending Resistance Line, while buyers gradually began to defend the Support Line, leading to a compression structure that later transitioned into a reversal phase. Following this consolidation, Gold successfully broke above both the internal range and the descending resistance, confirming a shift in market structure. Price then entered a well-defined ascending channel, forming higher highs and higher lows along the rising Support Line. Several clean breakouts inside the channel confirm sustained bullish momentum, with buyers clearly in control as long as the channel structure remains intact. Currently, price is consolidating just above the $4,160–$4,140 support zone, holding above former breakout levels and respecting the lower boundary of the ascending channel. This behavior suggests a healthy bullish pullback rather than trend exhaustion. As long as Gold remains above this support area and holds inside the channel, the bullish scenario remains valid. My expectation is for a continuation move toward the upper boundary of the channel, with the main upside target at TP1 around $4,320, where the previous resistance and projected channel resistance converge. A clean breakout above this level would open the door for further bullish expansion. However, a sustained break below the $4,140 support or a drop out of the channel would weaken the bullish structure and could trigger a deeper corrective move. Please share this idea with your friends and click Boost 🚀

BITCOIN Will Go Higher From Support! Buy!
Take a look at our analysis for BITCOIN.
Time Frame: 4h
Current Trend: Bullish
Sentiment: Oversold (based on 7-period RSI)
Forecast: Bullish
The market is approaching a key horizontal level 86,080.52.
Considering the today's price action, probabilities will be high to see a movement to 92,932.85.
P.S
Overbought describes a period of time where there has been a significant and consistent upward move in price over a period of time without much pullback.
Like and subscribe and comment my ideas if you enjoy them!

NZDUSD Is Very Bullish! Buy!
Take a look at our analysis for NZDUSD.
Time Frame: 1h
Current Trend: Bullish
Sentiment: Oversold (based on 7-period RSI)
Forecast: Bullish
The market is trading around a solid horizontal structure 0.571.
The above observations make me that the market will inevitably achieve 0.574 level.
P.S
Please, note that an oversold/overbought condition can last for a long time, and therefore being oversold/overbought doesn't mean a price rally will come soon, or at all.
Like and subscribe and comment my ideas if you enjoy them!

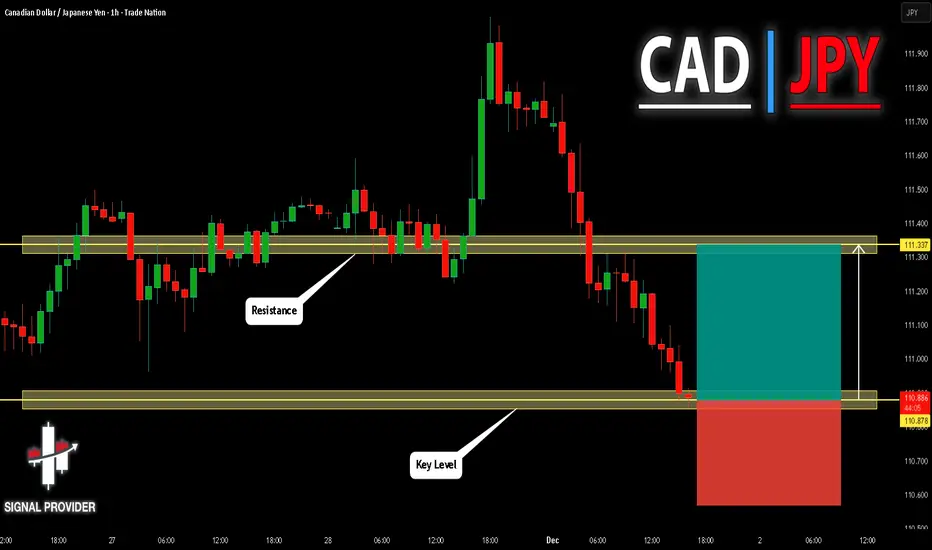
CADJPY Will Go Up From Support! Long!
Please, check our technical outlook for CADJPY.
Time Frame: 1h
Current Trend: Bullish
Sentiment: Oversold (based on 7-period RSI)
Forecast: Bullish
The market is approaching a significant support area 110.878.
The underlined horizontal cluster clearly indicates a highly probable bullish movement with target 111.337 level.
P.S
Please, note that an oversold/overbought condition can last for a long time, and therefore being oversold/overbought doesn't mean a price rally will come soon, or at all.
Like and subscribe and comment my ideas if you enjoy them!
Hassett Fed Rumors Hit USD; AUDUSD Set for Bounce!!Hey Traders,
In today’s trading session we’re monitoring AUDUSD for a potential buying opportunity around the 0.65900 zone. The pair remains in a well-defined uptrend, and the ongoing correction is guiding price back toward a key support-and-trendline confluence, where buyers have repeatedly stepped in.
On the fundamental front, USD sentiment is shifting fast.
It’s now almost certain that Kevin Hassett will become the next FED Chair.
Trump hasn’t made the announcement official, but the internal signals are clear: the decision looks essentially locked in.
And the market knows exactly what that means:
Hassett is the most dovish option on the table
He will push to lower interest rates aggressively next year
This is bearish USD, supportive for commodities, and bullish AUDUSD
With the dollar turning softer into a dovish-policy outlook, AUDUSD’s pullback into 0.65900 could offer a clean continuation setup.
Trade safe, Joe.

EURUSD: Bullish Continuation
The charts are full of distraction, disturbance and are a graveyard of fear and greed which shall not cloud our judgement on the current state of affairs in the EURUSD pair price action which suggests a high likelihood of a coming move up.
Disclosure: I am part of Trade Nation's Influencer program and receive a monthly fee for using their TradingView charts in my analysis.
❤️ Please, support our work with like & comment! ❤️

CHFJPY: Long Trade with Entry/SL/TP
CHFJPY
- Classic bullish formation
- Our team expects pullback
SUGGESTED TRADE:
Swing Trade
Long CHFJPY
Entry - 193.02
Sl - 192.78
Tp - 193.50
Our Risk - 1%
Start protection of your profits from lower levels
Disclosure: I am part of Trade Nation's Influencer program and receive a monthly fee for using their TradingView charts in my analysis.
❤️ Please, support our work with like & comment! ❤️

EDENUSDT Glory WeekEDEN tapped into raw momentum, ripping upward before cooling off into a smooth pullback. The structure still favors the bulls, and support is holding strong.
If EDEN catches fresh volume, a sharp rebound toward previous highs isn’t far. This chart looks like it wants another run.

EURJPY: Bullish Continuation & Long Trade
EURJPY
- Classic bullish pattern
- Our team expects retracement
SUGGESTED TRADE:
Swing Trade
Buy EURJPY
Entry - 180.58
Stop - 180.40
Take - 180.91
Our Risk - 1%
Start protection of your profits from lower levels
Disclosure: I am part of Trade Nation's Influencer program and receive a monthly fee for using their TradingView charts in my analysis.
❤️ Please, support our work with like & comment! ❤️

GOLD Is Bullish! Buy!
Take a look at our analysis for GOLD.
Time Frame: 4h
Current Trend: Bullish
Sentiment: Oversold (based on 7-period RSI)
Forecast: Bullish
The market is approaching a significant support area 4,188.16.
The underlined horizontal cluster clearly indicates a highly probable bullish movement with target 4,233.29 level.
P.S
Overbought describes a period of time where there has been a significant and consistent upward move in price over a period of time without much pullback.
Like and subscribe and comment my ideas if you enjoy them!
