AUDUSD Is Bullish! Long!
Please, check our technical outlook for AUDUSD.
Time Frame: 1h
Current Trend: Bullish
Sentiment: Oversold (based on 7-period RSI)
Forecast: Bullish
The market is approaching a significant support area 0.652.
The underlined horizontal cluster clearly indicates a highly probable bullish movement with target 0.653 level.
P.S
Please, note that an oversold/overbought condition can last for a long time, and therefore being oversold/overbought doesn't mean a price rally will come soon, or at all.
Like and subscribe and comment my ideas if you enjoy them!
Long!!!!

GBPAUD Expected Growth! BUY!
My dear friends,
My technical analysis for GBPAUD is below:
The market is trading on 2.0072 pivot level.
Bias - Bullish
Technical Indicators: Both Super Trend & Pivot HL indicate a highly probable Bullish continuation.
Target - 2.0141
About Used Indicators:
A pivot point is a technical analysis indicator, or calculations, used to determine the overall trend of the market over different time frames.
Disclosure: I am part of Trade Nation's Influencer program and receive a monthly fee for using their TradingView charts in my analysis.
———————————
WISH YOU ALL LUCK

EURUSD Retests Buyer Zone — Bullish Momentum Aiming for 1.1600Hello traders! I’d like to share my view on EURUSD. After an extended bearish trend inside a descending channel, the pair finally found strong buying interest around the 1.15300–1.15400 Buyer Zone, where price reacted multiple times in the past. This area aligns with both the horizontal Support Level and the ascending Support Line, which together form a solid base for potential bullish continuation. Recently, EURUSD broke above the descending resistance line, confirming a possible short-term trend reversal. The price is now retesting the breakout area, showing signs of accumulation above support. As long as price remains above 1.15300, the bullish structure stays valid. The immediate upside target (TP1) is seen around the 1.16000–1.16100 zone, which coincides with the previous consolidation and minor resistance area. A breakout and confirmed close above this zone could open the way toward the 1.16600 Resistance Level. However, a clear bearish rejection pattern near 1.16000–1.16100 might lead to another corrective pullback back into the Buyer Zone before further continuation. Please share this idea with your friends and click Boost 🚀

Gold Continues to Maintain Upward StructureHello, Traders! It's Leo again. Are you following XAUUSD today?
Yesterday, gold moved in line with the expected structure when it held steady above the EMA20/50 around $4,050 and responded well at the main trendline support.
On the other hand, weak US economic data such as the consumer confidence index and the announcement of a surge in layoffs have put pressure on growth and increased the value of gold as a safe haven asset.
This continues to reinforce the medium-term uptrend that is still in place, although a short-term technical correction may appear in today's session.
Currently, the price is fluctuating around $4,100, after breaking the old trendline and moving into a slight accumulation state.
In my personal opinion, next time gold holds above the $4,050 - $4,060 zone, there is a high possibility of a technical recovery back to the $4,150 zone, before the market moves towards the strong resistance zone of $4,320.
In terms of price structure, the current model is still showing a support test recovery wave - rebounding, in line with the main trend maintained since October.
👉 What do you think, comment below. Wish you a successful transaction!

Bitcoin Rebounds — channel breakout signals!Have a good day, Traders! It's Leo. Let's look at the current BTCUSDT chart
Valid Support Zone: 98,000 – 102,000 — Price has formed a clear double-bottom structure here.
Breakout confirmation: Price has broken above the descending channel and both EMA20/50.
Next resistance / target: 115,000 — previous supply area aligning with major liquidity.
→ Short-term structure favors a bullish continuation as long as support holds.
Despite short-term volatility, Bitcoin remains supported by improving risk sentiment as U.S. yields retreat and Fed officials hint at a potential policy pause.
Scenario: A successful retest of the breakout zone could trigger momentum toward the 115K resistance. Holding above 102K keeps the bullish structure intact.
Bulls seem to be regaining control — will this momentum extend toward 115K? What’s your outlook for BTC this week?

Gold breaks above structure, bulls eye 4,320$Hello, Traders! It's Leo. Are you following XAUUSD?
Chart Analysis:
Price continues to respect the ascending structure, showing steady bullish pressure.
Breakout Confirmation: The breakout above 4,060$ marks a shift from consolidation to trend continuation.
Targets: Next resistance sits at 4,320$, with 4,080$–4,040$ acting as the new demand zone.
Softer U.S. yields and weaker Dollar tone ahead of key CPI data are helping bulls regain traction, keeping price biased toward 4,320$.
💬 Share your view in the comments — are you watching for continuation or a pullback setup?
(Gold gains ground as traders await U.S. inflation data this week)

EURCHF: Growth & Bullish Forecast
It is essential that we apply multitimeframe technical analysis and there is no better example of why that is the case than the current EURCHF chart which, if analyzed properly, clearly points in the upward direction.
Disclosure: I am part of Trade Nation's Influencer program and receive a monthly fee for using their TradingView charts in my analysis.
❤️ Please, support our work with like & comment! ❤️

AUDCHF: Long Signal with Entry/SL/TP
AUDCHF
- Classic bullish formation
- Our team expects growth
SUGGESTED TRADE:
Swing Trade
Buy AUDCHF
Entry Level - 0.5230
Sl - 0.5219
Tp - 0.5252
Our Risk - 1%
Start protection of your profits from lower levels
Disclosure: I am part of Trade Nation's Influencer program and receive a monthly fee for using their TradingView charts in my analysis.
❤️ Please, support our work with like & comment! ❤️

AUDNZD Trading Opportunity! BUY!
My dear subscribers,
My technical analysis for AUDNZD is below:
The price is coiling around a solid key level - 1.1545
Bias - Bullish
Technical Indicators: Pivot Points High anticipates a potential price reversal.
Super trend shows a clear buy, giving a perfect indicators' convergence.
Goal - 1.1562
My Stop Loss - 1.1536
About Used Indicators:
By the very nature of the supertrend indicator, it offers firm support and resistance levels for traders to enter and exit trades. Additionally, it also provides signals for setting stop losses
Disclosure: I am part of Trade Nation's Influencer program and receive a monthly fee for using their TradingView charts in my analysis.
———————————
WISH YOU ALL LUCK

EURUSD Long: Bullish Correction Toward 1.16100 ResistanceHello traders! EURUSD is showing signs of recovery after an extended period of bearish movement inside a descending channel, where sellers controlled the market structure. After several failed attempts to break above the upper boundary, the price has formed a Pivot Point near the Demand Zone around 1.15300, a level where buyers have previously shown strong reaction.
Currently, a rising Demand Line now supports the bullish correction, helping price break out of the descending channel to the upside. The pair is currently moving toward the Supply Zone located at 1.15900–1.16100, which aligns with a key resistance level that previously triggered reversals.For now, the 1.15300 area remains the critical support for buyers.
I expect, holding above this level may allow EURUSD to continue pushing toward the 1.16100 resistance. However, any bearish rejection pattern in the 1.15900–1.16100 zone would signal a potential pullback toward the Demand Line or a retest of 1.15300. On the other hand, a confirmed break and close above 1.16100 would indicate a possible shift toward a medium-term bullish structure. Manage your risk!

XAUUSD: Buyers Defend $4,040 — Targeting $4,140 ResistanceHello everyone, here is my breakdown of the current Gold setup.
Market Analysis
XAUUSD has recently confirmed a bullish structure after bouncing strongly from the $4,000–$4,040 Support Zone, an area that coincides with the ascending Trend Line visible on the chart.
This level has repeatedly acted as a Buyer Zone, where multiple fake breakouts occurred — signaling liquidity sweeps and failure of sellers to maintain downward momentum. Each test of this support has been followed by a sharp bullish reaction, confirming strong demand and accumulation activity in this zone.
Currently, Gold is showing a controlled recovery phase, moving above the $4,040 Support and gradually approaching the $4,120–$4,160 Resistance Zone, which also aligns with the Trend Line extension and previous consolidation area. This zone represents the next critical reaction level for price. A confirmed breakout above it could open the way toward further continuation, while a rejection may lead to a corrective pullback back toward the $4,040 support. The recent price behavior — including several fake breakouts followed by strong recoveries — suggests that large buyers remain active, defending the bullish structure. As long as price holds above $4,040, the overall sentiment stays constructive and favors a gradual continuation toward the upper resistance levels.
My Scenario & Strategy
As long as XAUUSD remains above the $4,000–$4,040 Support Zone, the bullish bias remains valid.The next upside objective is located around $4,140–$4,160, where sellers may reappear based on past reactions. I expect the market to potentially form a small pullback before resuming its move higher. A sustained breakout and close above $4,160 would confirm a continuation toward $4,200 and possibly higher in the medium term.
However, if Gold breaks below $4,000, this bullish setup becomes invalid, and the price may return toward deeper support levels near $3,960–$3,940 before any new buying interest develops.For now, the structure supports buying pullbacks while the price stays above key support.
That's the setup I'm tracking. Thank you for your attention, and always manage your risk.

USDCHF Is Very Bullish! Buy!
Here is our detailed technical review for USDCHF.
Time Frame: 4h
Current Trend: Bullish
Sentiment: Oversold (based on 7-period RSI)
Forecast: Bullish
The market is on a crucial zone of demand 0.803.
The oversold market condition in a combination with key structure gives us a relatively strong bullish signal with goal 0.807 level.
P.S
The term oversold refers to a condition where an asset has traded lower in price and has the potential for a price bounce.
Overbought refers to market scenarios where the instrument is traded considerably higher than its fair value. Overvaluation is caused by market sentiments when there is positive news.
Like and subscribe and comment my ideas if you enjoy them!

NZD/USD BULLS WILL DOMINATE THE MARKET|LONG
Hello, Friends!
The BB lower band is nearby so NZD-USD is in the oversold territory. Thus, despite the downtrend on the 1W timeframe I think that we will see a bullish reaction from the support line below and a move up towards the target at around 0.579.
Disclosure: I am part of Trade Nation's Influencer program and receive a monthly fee for using their TradingView charts in my analysis.
✅LIKE AND COMMENT MY IDEAS✅

GBPUSD Potential UpsidesHey Traders, in today's trading session we are monitoring GBPUSD for a buying opportunity around 1.31400 zone, GBPUSD is trading in an uptrend and currently is in a correction phase in which it is approaching the trend at 1.31400 support and resistance area.
Trade safe, Joe.

USDCHF What Next? BUY!
My dear followers,
I analysed this chart on USDCHF and concluded the following:
The market is trading on 0.8037 pivot level.
Bias - Bullish
Technical Indicators: Both Super Trend & Pivot HL indicate a highly probable Bullish continuation.
Target - 0.8048
Safe Stop Loss - 0.8031
About Used Indicators:
A super-trend indicator is plotted on either above or below the closing price to signal a buy or sell. The indicator changes color, based on whether or not you should be buying. If the super-trend indicator moves below the closing price, the indicator turns green, and it signals an entry point or points to buy.
Disclosure: I am part of Trade Nation's Influencer program and receive a monthly fee for using their TradingView charts in my analysis.
———————————
WISH YOU ALL LUCK

EURGBP My Opinion! BUY!
My dear friends,
EURGBP looks like it will make a good move, and here are the details:
The market is trading on 0.8775 pivot level.
Bias - Bullish
Technical Indicators: Supper Trend generates a clear long signal while Pivot Point HL is currently determining the overall Bullish trend of the market.
Goal - 0.8787
Recommended Stop Loss - 0.8768
About Used Indicators:
Pivot points are a great way to identify areas of support and resistance, but they work best when combined with other kinds of technical analysis
Disclosure: I am part of Trade Nation's Influencer program and receive a monthly fee for using their TradingView charts in my analysis.
———————————
WISH YOU ALL LUCK

GBPAUD Will Go Up From Support! Buy!
Take a look at our analysis for GBPAUD.
Time Frame: 8h
Current Trend: Bullish
Sentiment: Oversold (based on 7-period RSI)
Forecast: Bullish
The market is approaching a key horizontal level 2.016.
Considering the today's price action, probabilities will be high to see a movement to 2.041.
P.S
The term oversold refers to a condition where an asset has traded lower in price and has the potential for a price bounce.
Overbought refers to market scenarios where the instrument is traded considerably higher than its fair value. Overvaluation is caused by market sentiments when there is positive news.
Like and subscribe and comment my ideas if you enjoy them!

10/11/25 Weekly OutlookLast weeks high: $110,732.65
Last weeks low: $98,972.09
Midpoint: $104,852.37
Bitcoins price action of last week tells an interesting story. The first trading hour of the week marked the weekly high, a sharp decline towards HTF support at $99,000 marked the weekly bottom, to finish the week a late surge recovered some of the losses to end the week at the range midpoint.
The double bottom at range low is a good sign for the bulls in a must win contested area around the $100,000 mark, not only is it a big even level but a HTF key S/R level too. Should the bulls lose this weekly low it opens the door to a $92,000 retest.
For the bulls should this rebound persist a flip of $108,000 is key but there is certainly a lack of spark in the markets at the moment.
I don't see the bulls making any significant ground until the US Government shutdown is announced to be coming to an end. This announcement could happen at any time and so this week that's what I am making plans for, how will the market react, volatility on announcement etc...
Good luck this week everybody!

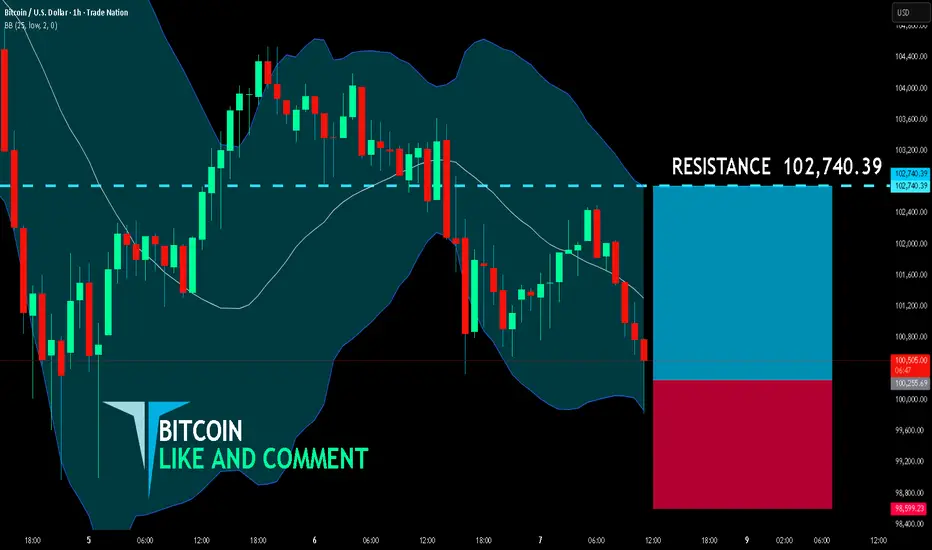
BITCOIN BULLS ARE GAINING STRENGTH|LONG
BITCOIN SIGNAL
Trade Direction: long
Entry Level: 100,255.69
Target Level: 102,740.39
Stop Loss: 98,599.23
RISK PROFILE
Risk level: medium
Suggested risk: 1%
Timeframe: 1h
Disclosure: I am part of Trade Nation's Influencer program and receive a monthly fee for using their TradingView charts in my analysis.
✅LIKE AND COMMENT MY IDEAS✅
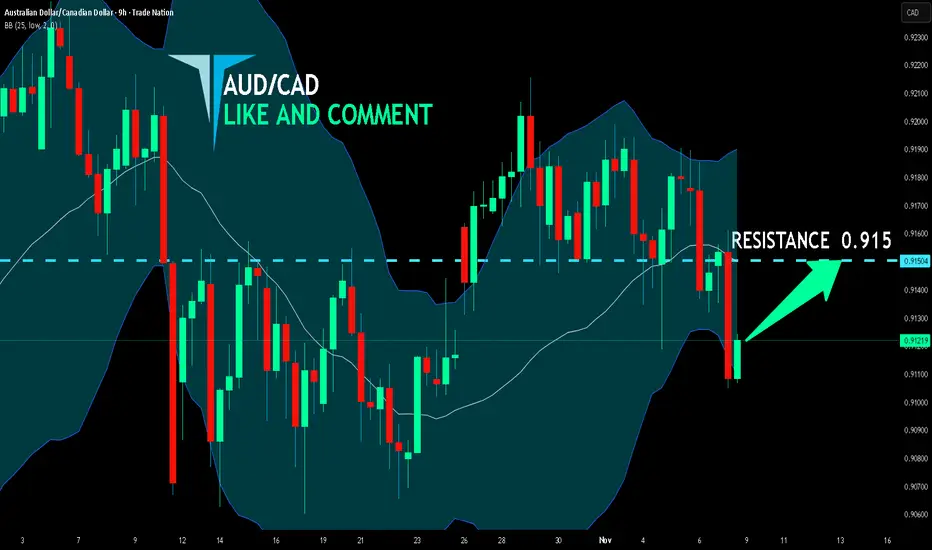
AUD/CAD SENDS CLEAR BULLISH SIGNALS|LONG
Hello, Friends!
We are targeting the 0.915 level area with our long trade on AUD/CAD which is based on the fact that the pair is oversold on the BB band scale and is also approaching a support line below thus going us a good entry option.
Disclosure: I am part of Trade Nation's Influencer program and receive a monthly fee for using their TradingView charts in my analysis.
✅LIKE AND COMMENT MY IDEAS✅
Crucial level for $BTCFor CRYPTOCAP:BTC I'm watching this $108,000-109,000 level for a reaction
Very bullish if the weekly reclaims and closes above, however we are very early in the week to talk about this scenario

XAUUSD Long: Bullish Rebound Targeting $4,050 LevelHello traders! Gold (XAUUSD) is trading within a constructive bullish structure after rebounding from the $3,930–$3,960 Demand Zone, which aligns with the lower boundary of the Ascending Channel. This zone has acted as a strong accumulation area where buyers stepped in multiple times, confirming active defense and sustained demand. Earlier, price moved through a corrective phase shaped by the Fibonacci Arc, which guided the downside retracement before buyers regained control. Several Pivot Points formed along the channel, marking clear areas where momentum shifted back in favor of buyers. Additionally, a recent fake breakout below the channel support further emphasizes that sellers are failing to break structure, while liquidity sweeps continue to fuel bullish re-entry opportunities.
Currently, XAUUSD is moving steadily toward the channel midline, with the next key objective located at $4,050, which represents short-term resistance and a known reaction level. A confirmed breakout above $4,050 would open the door for a broader continuation toward the $4,130 Supply Zone, a region where a previous distributive phase occurred. As long as Gold holds above the $3,930–$3,960 Demand Zone, the bullish outlook remains intact.
I expect price to gradually continue higher within the ascending channel. At this stage, the market structure continues to favor buyers, and dips remain attractive opportunities to participate in the upward move. Manage your risk!

Gold Eyes 3,980 Support as Bulls Prepare for the Next Leg HigherHey Traders, in today's trading session we are monitoring XAUUSD for a buying opportunity around 3,980 zone Gold is trading in an uptrend and currently is in a correction phase in which it is approaching the trend at 3,980 support and resistance area.
Trade safe, Joe.
