EURUSD Long: Buyers Targeting a Move Toward 1.1670 ResistanceHello traders! EURUSD has recently shown a structural shift after forming a strong rejection from the Demand Zone near 1.1560, which also acted as a key pivot area. This reaction marked the end of the previous bearish phase inside the Descending Channel, leading to the formation of a new Ascending Channel — indicating the potential start of a medium-term recovery.
After the price reached the Supply Line, a fake breakout occurred around 1.1670, followed by a brief pullback to retest the lower boundary of the channel. This move trapped early sellers, and the quick rebound suggests that buyers are still active and defending the structure.
At the moment, EURUSD is trading around 1.1640, aiming for another test of the 1.1670 resistance zone, which aligns with both the supply line and the upper boundary of the channel. A successful breakout above this area could confirm bullish continuation, targeting higher levels. However, a strong rejection from this resistance might trigger another short-term correction back toward 1.1600–1.1580, where demand could once again reappear. Overall, the structure remains bullish-to-neutral in the short term, with 1.1670 acting as the critical breakout level to watch. Manage your risk!
Long!!!!

EURUSD Bulls Eye 1.16050 for Fresh BounceHey Traders, in today’s trading session we are monitoring EURUSD for a potential buying opportunity around the 1.16050 zone.
The pair remains in a broader uptrend and is currently in a correction phase, approaching a key support and resistance area at 1.16050.
Structurally, EURUSD has been forming higher highs and higher lows, suggesting that the current retracement could offer another continuation setup within the bullish leg.
Next move: Watching how price reacts near 1.16050 — if bullish momentum builds from this area, we could see a renewed push toward recent highs.

Bitcoin Approaches Key Resistance — Bulls Eye 117K BreakoutHello traders, I want to share my view on Bitcoin (BTCUSD). The current market structure shows a gradual recovery phase following the previous breakdown from a large range near the 118,000 level. After a sharp decline and retest of the 106,400 support zone, the market found strong buying interest, forming a new ascending channel structure. This setup has been characterized by steady higher highs and higher lows, confirming the presence of short-term bullish momentum. At this stage, BTCUSD is approaching a key resistance level around 116,000, which aligns with both the upper boundary of the current channel and the prior horizontal resistance zone — a region that previously acted as a strong supply area. This confluence suggests that the market could face a short-term pause or pullback before attempting another bullish impulse. My primary scenario anticipates that if the price holds above the support line near 113,000–113,500, buyers may maintain control and push toward the 117,000 target (TP1) — the next logical resistance level and the top of the channel. However, a clear rejection from 116,000 without follow-through could open the door to a corrective pullback toward 110,500–111,000 for another demand test. In my opinion, the structure remains bullish in the short term, as long as the lower boundary of the ascending channel holds. Therefore, I continue to favor a long scenario with a TP at 117,000, expecting a potential breakout or test of the upper resistance. Please share this idea with your friends and click Boost 🚀

20% long play UAMYI have noticed that healthy companies with bull runs tend to have major pullbacks of ~50-60% before short term reversal. I believe UAMY is probably topped out after the recent blow off bull run, but here we are at 56% down after the recent ATH, RSI at a local extreme low. I am buying here and TP around $11.4, unless there are indications for a greater upward move. SL at $8.7. If this fails $8.14 is next support.

BITCOIN Is Bullish! Buy!
Take a look at our analysis for BITCOIN.
Time Frame: 2h
Current Trend: Bullish
Sentiment: Oversold (based on 7-period RSI)
Forecast: Bullish
The price is testing a key support 113,094.29.
Current market trend & oversold RSI makes me think that buyers will push the price. I will anticipate a bullish movement at least to 115,958.80 level.
P.S
Please, note that an oversold/overbought condition can last for a long time, and therefore being oversold/overbought doesn't mean a price rally will come soon, or at all.
Like and subscribe and comment my ideas if you enjoy them!

EURCAD Will Explode! BUY!
My dear subscribers,
This is my opinion on the EURCAD next move:
The instrument tests an important psychological level 1.6228
Bias - Bullish
Technical Indicators: Supper Trend gives a precise Bullish signal, while Pivot Point HL predicts price changes and potential reversals in the market.
Target - 1.6286
About Used Indicators:
On the subsequent day, trading above the pivot point is thought to indicate ongoing bullish sentiment, while trading below the pivot point indicates bearish sentiment.
Disclosure: I am part of Trade Nation's Influencer program and receive a monthly fee for using their TradingView charts in my analysis.
———————————
WISH YOU ALL LUCK

GBPCAD Will Grow! Long!
Take a look at our analysis for GBPCAD.
Time Frame: 1D
Current Trend: Bullish
Sentiment: Oversold (based on 7-period RSI)
Forecast: Bullish
The market is approaching a key horizontal level 1.842.
Considering the today's price action, probabilities will be high to see a movement to 1.865.
P.S
Overbought describes a period of time where there has been a significant and consistent upward move in price over a period of time without much pullback.
Like and subscribe and comment my ideas if you enjoy them!

NZDUSD Will Go Up! Buy!
Please, check our technical outlook for NZDUSD.
Time Frame: 2h
Current Trend: Bullish
Sentiment: Oversold (based on 7-period RSI)
Forecast: Bullish
The market is trading around a solid horizontal structure 0.577.
The above observations make me that the market will inevitably achieve 0.578 level.
P.S
Overbought describes a period of time where there has been a significant and consistent upward move in price over a period of time without much pullback.
Like and subscribe and comment my ideas if you enjoy them!

ETH Short Setup🚨 ETH Short Setup
Ethereum just confirmed a Break of Structure (BOS) after failing to hold above both EMAs. This rejection — together with a liquidity sweep near 4230 — signals potential continuation to the downside.
🎯 Trade Plan Overview:
Entry: 4020–4050
Stop: 4100–4120
Targets: 3960 → 3840
Risk/Reward: 1:3
📊 Key zones:
EMA short attention zone ✅
Support: 3920–3960 equilibrium
Watch for bullish divergence before reversal
🔔 Subscribe for daily ETH and BTC market updates, crypto trading strategies, and AI-powered technical analysis!

SPX - The Road to 6900 Begins “History never repeats itself. Man always does.”
A deep look into SPX History exposes the path of a market cycle and tells us the truth on where markets are headed.
Percentages don't lie.
See you guys at 6900!

GBPJPY: Bullish Continuation
The price of GBPJPY will most likely increase soon enough, due to the demand beginning to exceed supply which we can see by looking at the chart of the pair.
Disclosure: I am part of Trade Nation's Influencer program and receive a monthly fee for using their TradingView charts in my analysis.
❤️ Please, support our work with like & comment! ❤️

EURUSD Will Go Up From Support! Buy!
Here is our detailed technical review for EURUSD.
Time Frame: 12h
Current Trend: Bullish
Sentiment: Oversold (based on 7-period RSI)
Forecast: Bullish
The market is on a crucial zone of demand 1.165.
The oversold market condition in a combination with key structure gives us a relatively strong bullish signal with goal 1.175 level.
P.S
The term oversold refers to a condition where an asset has traded lower in price and has the potential for a price bounce.
Overbought refers to market scenarios where the instrument is traded considerably higher than its fair value. Overvaluation is caused by market sentiments when there is positive news.
Like and subscribe and comment my ideas if you enjoy them!

EURUSD Is Very Bullish! Buy!
Take a look at our analysis for EURUSD.
Time Frame: 2h
Current Trend: Bullish
Sentiment: Oversold (based on 7-period RSI)
Forecast: Bullish
The price is testing a key support 1.161.
Current market trend & oversold RSI makes me think that buyers will push the price. I will anticipate a bullish movement at least to 1.164 level.
P.S
We determine oversold/overbought condition with RSI indicator.
When it drops below 30 - the market is considered to be oversold.
When it bounces above 70 - the market is considered to be overbought.
Like and subscribe and comment my ideas if you enjoy them!

SILVER LONG FROM SUPPORT
SILVER SIGNAL
Trade Direction: long
Entry Level: 4,629.4
Target Level: 4,962.5
Stop Loss: 4,404.9
RISK PROFILE
Risk level: medium
Suggested risk: 1%
Timeframe: 3h
Disclosure: I am part of Trade Nation's Influencer program and receive a monthly fee for using their TradingView charts in my analysis.
✅LIKE AND COMMENT MY IDEAS✅

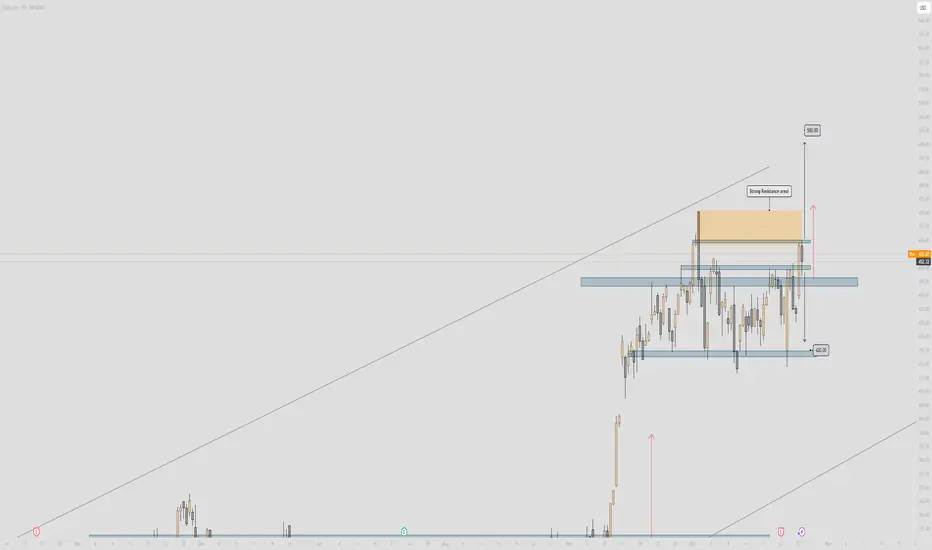
TSLA - Important!🔥 Tesla Analysis (Daily Structure) 🔥
Alright, let’s break this one down 👇
🧱 Structure Overview
Tesla’s price is currently hovering around $452, sitting right below a major resistance zone between $455 – $470 (highlighted in orange). This area has acted as a strong ceiling multiple times — every approach has been met with rejection pressure.
Below, the support floor sits clean around $420 – $425, which has been holding the range low for a while. We’re essentially trapped in a sideways consolidation box — a range between that $420 low and the $470 resistance cap.
🧭 Bias
Current structure = Neutral to Bearish
Price just wicked into resistance, showing signs of rejection. Unless we see strong follow-through above $470 with clean volume, this is likely a reaction zone for shorts.
💡 Key Zones
Resistance (Sell Zone): $455 – $470
Strong supply — expect sellers to defend this area.
Support (Buy Zone): $420 – $425
Range demand base — liquidity resting below.
🎯 Scenarios
Bearish Setup (Higher Probability for Now)
If Tesla fails to break and close above $470, look for a move back down to $420 — possibly a liquidity grab under the range. Confirmation would be bearish engulfing or a strong rejection candle from resistance.
Bullish Setup (Breakout Play)
If price cleanly closes above $470 and retests it as support, we could open the door toward $500 (measured move target). That’d be a breakout from the range and continuation of the larger bullish channel.
⚖️ Risk Management
Bears: Stop above $475 – $480
Bulls: Stop below $445 if entering after breakout retest
Keep R:R ≥ 1:2
🧠 Summary
Tesla’s in a tight range — smart money likely accumulating or distributing near these highs. Watch for rejection signs around $470 for short plays, or confirmation above it for the next leg to $500.
This is the make-or-break zone — the next move will define Tesla’s mid-term direction. ⚡️
USDCHF: Growth & Bullish Continuation
Our strategy, polished by years of trial and error has helped us identify what seems to be a great trading opportunity and we are here to share it with you as the time is ripe for us to buy USDCHF.
Disclosure: I am part of Trade Nation's Influencer program and receive a monthly fee for using their TradingView charts in my analysis.
❤️ Please, support our work with like & comment! ❤️

GOLD: Long Signal with Entry/SL/TP
GOLD
- Classic bullish setup
- Our team expects bullish continuation
SUGGESTED TRADE:
Swing Trade
Long GOLD
Entry Point - 3901.6
Stop Loss - 3884.4
Take Profit - 3938.6
Our Risk - 1%
Start protection of your profits from lower levels
Disclosure: I am part of Trade Nation's Influencer program and receive a monthly fee for using their TradingView charts in my analysis.
❤️ Please, support our work with like & comment! ❤️

EURJPY The Target Is UP! BUY!
My dear friends,
EURJPY looks like it will make a good move, and here are the details:
The market is trading on 177.10 pivot level.
Bias - Bullish
Technical Indicators: Supper Trend generates a clear long signal while Pivot Point HL is currently determining the overall Bullish trend of the market.
Goal - 177.51
Recommended Stop Loss - 176.90
About Used Indicators:
Pivot points are a great way to identify areas of support and resistance, but they work best when combined with other kinds of technical analysis
Disclosure: I am part of Trade Nation's Influencer program and receive a monthly fee for using their TradingView charts in my analysis.
———————————
WISH YOU ALL LUCK

XAUUSD: Bullish Reversal Setup From Triangle SupportHello everyone, here is my breakdown of the current Gold setup.
Market Analysis
Gold (XAUUSD) continues to trade within a larger bullish market structure, maintaining higher lows above its key ascending Trend Line. After a strong impulsive rally that pushed the price above the 4,200 resistance, the market faced rejection near the top of the Range and entered a corrective phase. This correction evolved into a triangle pattern, with price now testing the Triangle Support Line, aligning closely with the horizontal Support area around 4,020 – 4,000 — a historically important demand zone.
Currently, the price is consolidating near the lower boundary of this structure, showing early signs of stabilization. This region also coincides with the previous breakout point, adding further confluence for potential buyer interest.
My Scenario & Strategy
I expect the price to hold above the Triangle Support Line and form a bullish reversal structure, signaling that buyers are once again defending this level. A confirmed breakout above the Triangle Resistance Line would indicate renewed bullish momentum and a potential continuation of the overall uptrend.
My primary target zone lies around 4,215, where previous resistance and the upper range boundary converge. However, if the support near 4,000 fails to hold, it could trigger a deeper correction toward 3,950, where the next demand zone is located. This setup offers a favorable risk-to-reward opportunity for traders anticipating a rebound from a major technical confluence zone.
That's the setup I'm tracking. Thank you for your attention, and always manage your risk.

Gold Preparing to Continue Its Bullish Move After ConsolidationHello traders, I want share with you my opinion about Gold. Gold has maintained a strong bullish structure over the recent period, forming a clear ascending channel that has been respected multiple times. Each correction has been followed by strong bullish impulses, confirming that buyers remain in control of the long-term direction. After reaching the 4,368 Resistance Level — which coincides with the upper boundary of the channel — the market entered a range phase, signaling consolidation after an extended rally. The current price action has formed a secondary support zone near 4,050 – 4,080, also aligned with the ascending support line of the broader channel. Currently, the price is moving inside a range structure (Buyer Zone to Seller Zone), consolidating just above the main ascending support line. In my opinion, this area represents a critical accumulation zone, where buyers are likely preparing for another upward push. I expect that after testing the Buyer Zone, the price will find strong support and initiate a new bullish wave toward the Seller Zone and the Resistance Level at 4,368. A confirmed breakout above the resistance line of the local descending structure would validate this bullish continuation scenario. Please share this idea with your friends and click Boost 🚀

BTC USD (T)🟢 Main scenario (healthy correction and continuation of growth)
The price is pulling back to the EMA50 / EMA100 (around 113.4k–112.8k).
In this zone — especially near 112.8k — you can look for long confirmations such as a pattern, volume spike, or false breakout downward.
After a rebound, the next targets are: 115.5k → 116.3k (Weekly High),
If this level breaks — a possible move toward 117k–118k.
🔴 Less likely, but possible scenario (deep correction)
If the price consolidates below EMA100 (≈112.8k),
the move may deepen toward the Equilibrium zone (111.0–110.5k).
There will again be a chance for a strong long entry, but only after confirmation.

BTCUSDT: Could Continue to Rise Higher Within the ChannelBINANCE:BTCUSDT is a prime example of a market moving within an ascending channel, with price action consistently respecting both the upper and lower boundaries.
Recently, the price broke through a clear resistance zone and retested it. This zone aligns with Bitcoin’s recent volatility range, making it a critical level to watch closely. If this level holds as support, it will confirm the bullish market structure, and there's a high probability the price will continue to rise towards $118,682, the upper limit of the channel.
As long as the price stays above this support zone, the bullish trend will remain intact. However, if the price fails to hold this level, short-term bullish prospects may be challenged, and we could see a decline back towards the channel’s lower limit.
Remember to always apply proper risk management. Wishing you a great trading experience and plenty of profits!

EURAUD Sellers In Panic! BUY!
My dear subscribers,
EURAUD looks like it will make a good move, and here are the details:
The market is trading on 1.7765 pivot level.
Bias - Bullish
Technical Indicators: Both Super Trend & Pivot HL indicate a highly probable Bullish continuation.
Target - 1.7842
About Used Indicators:
The average true range (ATR) plays an important role in 'Supertrend' as the indicator uses ATR to calculate its value. The ATR indicator signals the degree of price volatility.
Disclosure: I am part of Trade Nation's Influencer program and receive a monthly fee for using their TradingView charts in my analysis.
———————————
WISH YOU ALL LUCK
