NZDUSD: Expecting Bullish Continuation! Here is Why:
The charts are full of distraction, disturbance and are a graveyard of fear and greed which shall not cloud our judgement on the current state of affairs in the NZDUSD pair price action which suggests a high likelihood of a coming move up.
Disclosure: I am part of Trade Nation's Influencer program and receive a monthly fee for using their TradingView charts in my analysis.
❤️ Please, support our work with like & comment! ❤️
Long!!!!

EURUSD Massive Long! BUY!
My dear subscribers,
EURUSD looks like it will make a good move, and here are the details:
The market is trading on 1.1726 pivot level.
Bias - Bullish
My Stop Loss - 1.1713
Technical Indicators: Both Super Trend & Pivot HL indicate a highly probable Bullish continuation.
Target - 1.1747
About Used Indicators:
The average true range (ATR) plays an important role in 'Supertrend' as the indicator uses ATR to calculate its value. The ATR indicator signals the degree of price volatility.
Disclosure: I am part of Trade Nation's Influencer program and receive a monthly fee for using their TradingView charts in my analysis.
———————————
WISH YOU ALL LUCK

BTCUSDT Long: Demand Support Fuels Push Toward $92,500Hello, traders! BTCUSDT previously traded within a well-defined Descending Channel, confirming strong bearish pressure and controlled sell-side momentum. Price consistently respected the channel boundaries, producing lower highs and lower lows until a decisive breakdown occurred near the lower channel edge. After this breakdown, Bitcoin reached a clear Pivot Point, where sellers began to lose control and buyers stepped in aggressively. This reaction marked the end of the bearish impulse and initiated a structural shift. From this pivot low, price started forming higher lows, signaling the emergence of demand and the beginning of a recovery phase.
Currently, BTC broke above local resistance and entered a Range phase, where price consolidated between the 88,000 Demand Zone and the 92,500 Supply Zone. Multiple breakout attempts occurred inside this range, confirming active participation from both buyers and sellers. However, each dip toward the demand area was quickly absorbed, showing strong buyer interest and defense of the lower boundary. A rising Demand Line formed beneath price, reinforcing bullish pressure and supporting higher lows within the range. This structure indicates accumulation rather than distribution, suggesting preparation for a directional move.
My primary scenario is bullish as long as BTCUSDT holds above the 88,000 Demand Zone and continues respecting the ascending demand line. The recent pullback into demand appears corrective rather than impulsive, favoring continuation to the upside. I expect price to push back toward the 92,500 Resistance, which represents the upper boundary of the range and a key decision level. A clean breakout and acceptance above 92,500 would confirm bullish continuation and open the path for further upside expansion. Manage your risk!

AUDUSD Will Go Up! Buy!
Take a look at our analysis for AUDUSD.
Time Frame: 4h
Current Trend: Bullish
Sentiment: Oversold (based on 7-period RSI)
Forecast: Bullish
The market is testing a major horizontal structure 0.662.
Taking into consideration the structure & trend analysis, I believe that the market will reach 0.666 level soon.
P.S
Overbought describes a period of time where there has been a significant and consistent upward move in price over a period of time without much pullback.
Like and subscribe and comment my ideas if you enjoy them!

EURUSD Will Move Higher! Long!
Please, check our technical outlook for EURUSD.
Time Frame: 1h
Current Trend: Bullish
Sentiment: Oversold (based on 7-period RSI)
Forecast: Bullish
The market is approaching a key horizontal level 1.171.
Considering the today's price action, probabilities will be high to see a movement to 1.174.
P.S
Please, note that an oversold/overbought condition can last for a long time, and therefore being oversold/overbought doesn't mean a price rally will come soon, or at all.
Like and subscribe and comment my ideas if you enjoy them!

#045: USD/JPY Long Investment Opportunity
The USD/JPY is in a structured uptrend on the higher timeframe, with the price recently completing a liquidity clearing at the lows before showing signs of a reaction.
After a period of orderly bearish pressure, the market absorbed supply in dynamic support areas, without producing any significant structural breakout. This behavior is typical of stop-hunting maneuvers in a bullish environment, where the decline does not represent distribution but rather a replenishment of institutional long positions.
The subsequent rebound highlights:
Maintained structure of higher highs and higher lows over the medium term
Absence of abnormal downward accelerations
Price return above equilibrium and value areas
From a price action perspective, the recent decline shows characteristics of a corrective pullback, not a reversal. Volumes are consistently accompanying the movement, suggesting an accumulation phase rather than a market exit.
The environment remains favorable for a continuation of the main movement, with the price tending to re-engage with the dominant direction after eliminating the weakest positions. The current setup therefore favors trend-aligned trades, executed after, not during, manipulation.
In summary, the market is exhibiting a classic scenario:
primary bullish trend
controlled technical retracement
reabsorption of liquidity below the lows
resumption of main directional pressure
As long as the underlying structure remains intact, the trading bias remains oriented toward the continuation of the movement, with expectations of extension toward higher liquidity areas.

Ethereum — Bearish structure confirmed amid weak macro sentimentHello everyone,
At the moment, Ethereum is trading within a broader risk-off environment, where defensive sentiment continues to dominate risk assets. Capital flows have yet to show a strong enough return to support a sustainable bullish trend, while investors remain cautious amid macroeconomic uncertainty and overall liquidity conditions. This hesitation has caused recent ETH rebounds to lack follow-through and remain vulnerable to selling pressure.
From a technical perspective , the H4 chart clearly reflects a weakening market structure. After a sharp impulsive move higher, Ethereum failed to maintain expansion and was quickly rejected at higher levels, forming a failed breakout . The return of price below the breakout area signals that buyers were unable to maintain control, allowing sellers to reassert dominance.
The zone around 3,270–3,320 USD now acts as a key resistance area . This region aligns with prior supply and important technical factors, where price has repeatedly faced rejection. As long as the bearish structure remains intact, rallies into this area should be viewed as trend-aligned SELL opportunities , rather than early signs of a bullish reversal.
On the downside, the 3,070–3,000 USD region represents the nearest support target. While this zone has previously generated price reactions, within an active downtrend it should be treated primarily as a potential profit-taking area , not a safe BUY zone. Attempting to catch a bottom while the lower-high, lower-low structure remains intact introduces unnecessary risk.
Looking at market behavior , recent recoveries have been characterized by weak momentum, narrow ranges, and a lack of decisive buying participation. This suggests a phase of distribution and rebalancing , rather than accumulation for trend continuation. When the market fails to accept higher prices, the probability of downside continuation outweighs that of an early reversal.
In conclusion , Ethereum remains in a controlled corrective downtrend. With neither the technical structure nor the current news backdrop supporting a bullish scenario, the most prudent approach is to prioritize selling rallies , apply strict risk management, and remain patient until the market delivers clearer signals. In trading, aligning with the dominant trend consistently offers a higher probability edge than attempting to anticipate a bottom.
Wishing you clear judgment, disciplined risk management, and sustainable trading performance.

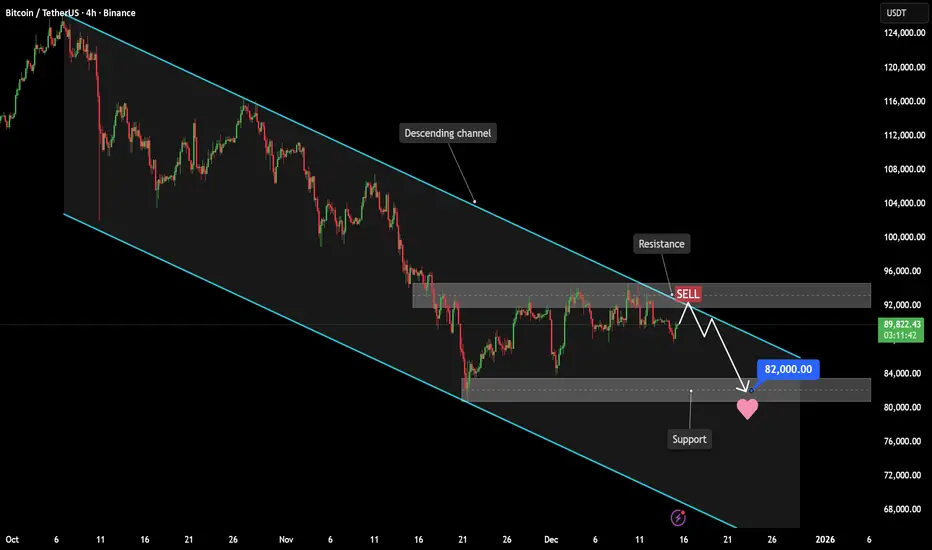
Bitcoin - Downtrend reinforced by technicals and macro sentimentHello everyone,
At the moment, Bitcoin is trading cautiously as capital has yet to decisively return to risk assets. Overall market sentiment remains defensive, with investors continuing to assess macroeconomic conditions and monetary policy. As a result, buying pressure has not been strong enough to reverse the prevailing trend.
From a technical perspective , the H4 chart shows that Bitcoin continues to respect a well-defined descending channel . Market structure remains bearish, with a clear sequence of lower highs and lower lows, confirming that selling pressure is still dominant. Recent rebounds have been purely technical in nature and have repeatedly been rejected near the upper boundary of the channel, signaling that buyers lack control.
Notably, the 92,000–94,000 USD area is acting as a key resistance zone. This region aligns with the upper boundary of the descending channel and a prior distribution area, where price has been rejected multiple times. In the current context, each failed attempt to close decisively above this zone reinforces the view that it is a trend-aligned SELL area , rather than a bullish reversal signal.
On the news front , the crypto market continues to be influenced by a broader risk-off environment, with capital favoring safety and liquidity. The absence of strong positive catalysts makes it difficult for Bitcoin to sustain a meaningful breakout. This cautious investor behavior effectively supports the existing bearish structure, as weak and hesitant demand often allows downtrends to persist.
On the downside, the 80,000–82,000 USD region stands out as an important support area. While price has reacted from this zone in the past, within a broader downtrend it should be viewed primarily as a potential profit-taking target , not a safe BUY zone. Attempting to catch the bottom before the bearish structure is broken carries elevated risk and does not align with disciplined trading.
Overall, both technical structure and the current news backdrop point toward a bearish continuation scenario . Until there is a clear shift in market structure or a meaningful improvement in capital flows, the most rational approach remains to sell rallies in line with the trend , rather than trying to predict a bottom.
In conclusion , Bitcoin remains in a controlled downtrend. Only a decisive break above the descending channel, supported by a more favorable news environment, would justify considering a trend reversal. Until then, patience, discipline, and respect for the dominant trend are essential for capital protection and consistent performance.
Wishing you clear judgment, strong risk management, and disciplined trading in line with the primary trend.
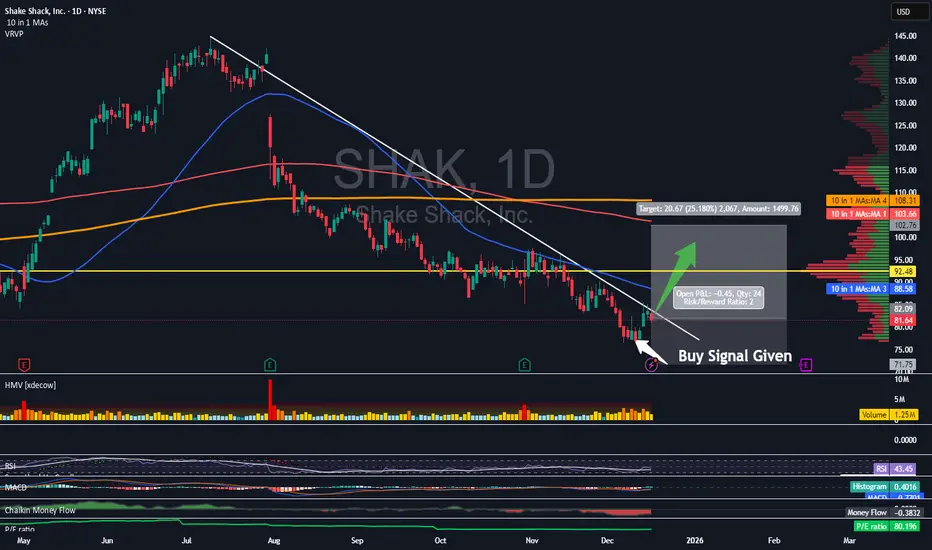
Buy Signal Given on Shake ShackTrading Fam,
I've received two more clear buy signals from my indicator recently. Here on SHAK we were given our signal about a week ago. I didn't wait for to break that descending trendline on this one, so it may be a tad bit more risky than had I waited for that breakout. However, I have full confidence in my indicator as it has a knack of predicting breakouts before they occur. I don't doubt this will be the same.
Here is what I am looking at:
1) Buy signal given by my indicator and confirmed with good volume.
2) We are about to break to the upside of that descending trendline. Once we do, we should be able to climb up to that red 200 SMA (my target) for a touch.
3) There will be some resistance before we get to my healthy 25% profit target: the descending TL, the 50 SMA, and the VRVP PoC.
This trade comes in at a 1:2 rrr with a target of $102+ and a SL of 71.75.
✌️Stew
Buy Signal on HoneywellTrading Fam,
Got two more buy signals recently from my indicator. Waited till today for confirmation on entry.
So here are the technicals:
1) My indicator gave us a buy on the 25th of Nov. The signal was confirmed by volume.
2) We've broken to the top side of the VRVP PoC
3) We've broken to the top side of that descending trendline
Resistance will be both that 350/200 SMA above. After that, I'm shooting for the 24Jul gap for a moderate 11% profit. The risk is a low 2.2%. I don't want to see us drop back below that PoC/50 SMA or I'm out.
✌️Stew

AUDCAD Is Bullish! Buy!
Here is our detailed technical review for AUDCAD.
Time Frame: 4h
Current Trend: Bullish
Sentiment: Oversold (based on 7-period RSI)
Forecast: Bullish
The market is approaching a significant support area 0.912.
The underlined horizontal cluster clearly indicates a highly probable bullish movement with target 0.919 level.
P.S
The term oversold refers to a condition where an asset has traded lower in price and has the potential for a price bounce.
Overbought refers to market scenarios where the instrument is traded considerably higher than its fair value. Overvaluation is caused by market sentiments when there is positive news.
Like and subscribe and comment my ideas if you enjoy them!

USDCAD: Great Trading Opportunity
USDCAD
- Classic bullish setup
- Our team expects bullish continuation
SUGGESTED TRADE:
Swing Trade
Long USDCAD
Entry Point - 1.3735
Stop Loss - 1.3728
Take Profit - 1.3753
Our Risk - 1%
Start protection of your profits from lower levels
Disclosure: I am part of Trade Nation's Influencer program and receive a monthly fee for using their TradingView charts in my analysis.
❤️ Please, support our work with like & comment! ❤️

AUDJPY Technical Analysis! BUY!
My dear friends,
Please, find my technical outlook for AUDJPY below:
The price is coiling around a solid key level - 102.86
Bias - Bullish
Technical Indicators: Pivot Points High anticipates a potential price reversal.
Super trend shows a clear buy, giving a perfect indicators' convergence.
Goal - 103.32
About Used Indicators:
The pivot point itself is simply the average of the high, low and closing prices from the previous trading day.
Disclosure: I am part of Trade Nation's Influencer program and receive a monthly fee for using their TradingView charts in my analysis.
———————————
WISH YOU ALL LUCK

EURGBP Expected Growth! BUY
My dear followers,
This is my opinion on the EUR/USD next move:
The asset is approaching an important pivot point 0.8769
Bias - Bullish
Safe Stop Loss - 0.8763
Technical Indicators: Supper Trend generates a clear long signal while Pivot Point HL is currently determining the overall Bullish trend of the market.
Goal - 0.8779
About Used Indicators:
For more efficient signals, super-trend is used in combination with other indicators like Pivot Points.
Disclosure: I am part of Trade Nation's Influencer program and receive a monthly fee for using their TradingView charts in my analysis.
———————————
WISH YOU ALL LUCK

Gold Reload Zone at 4,245 as USD Weakens!!Hey Traders,
In today’s trading session, we are monitoring XAUUSD for a potential buying opportunity around the 4,245 zone. Gold remains in a well-defined uptrend and is currently undergoing a healthy corrective phase, pulling back toward the 4,245 support area, which aligns with the broader trend structure.
Technical context:
The bullish structure remains intact, with price respecting higher highs and higher lows. This retracement toward trend support offers a potential continuation setup within the prevailing uptrend.
Macro & Dollar backdrop:
The US Dollar remains under pressure following the recent 25bps Fed rate cut, alongside signs of cooling US labor market data. With balance sheet expansion resuming and markets increasingly sensitive to incoming employment figures, the risk remains skewed toward further USD weakness. Any additional deterioration in labor data could accelerate expectations for another rate cut, reinforcing the bearish Dollar narrative.
Gold correlation:
A softer USD environment continues to support Gold via its negative correlation with the Dollar, keeping the upside bias intact as long as trend support holds.
Watching price behavior closely around 4,245 for confirmation of renewed buying interest.
Trade safe,
Joe

AUDUSD Breakout Retest as Dollar Weakens!Hey Traders,
In today’s trading session, we are monitoring AUDUSD for a potential buying opportunity around the 0.66000 zone. The pair previously traded within a downtrend but has successfully broken out, signaling a shift in market structure.
Price is now in a healthy corrective phase, retracing toward the 0.66000 support zone, which aligns with prior resistance turned support — a classic breakout–retest setup.
Fundamental backdrop:
The US Dollar remains under pressure following softer macro conditions and fading expectations of sustained Fed hawkishness. Recent data continues to point toward a cooling US labor market, reinforcing a weaker USD environment and improving the risk-reward profile for AUDUSD on pullbacks.
Focus: Watching price behavior around 0.66000 for confirmation of bullish continuation.
Trade safe,
Joe

AUDUSD at Decision Point — Trend or Trap?Hey Traders,
In today’s trading session, we are monitoring AUDUSD for a potential buying opportunity around the 0.66200 zone.
Structure:
AUDUSD remains in a well-defined uptrend, and price is currently undergoing a healthy pullback toward the rising trend structure. The 0.66200 area stands out as a key zone of confluence, acting as both dynamic trend support and a prior reaction level.
Context:
As long as price holds above this level, the broader bullish structure remains intact, keeping the path open for a continuation toward recent highs.
Plan:
Watching for bullish reaction and confirmation around 0.66200 before considering continuation setups.
Trade safe,
Joe

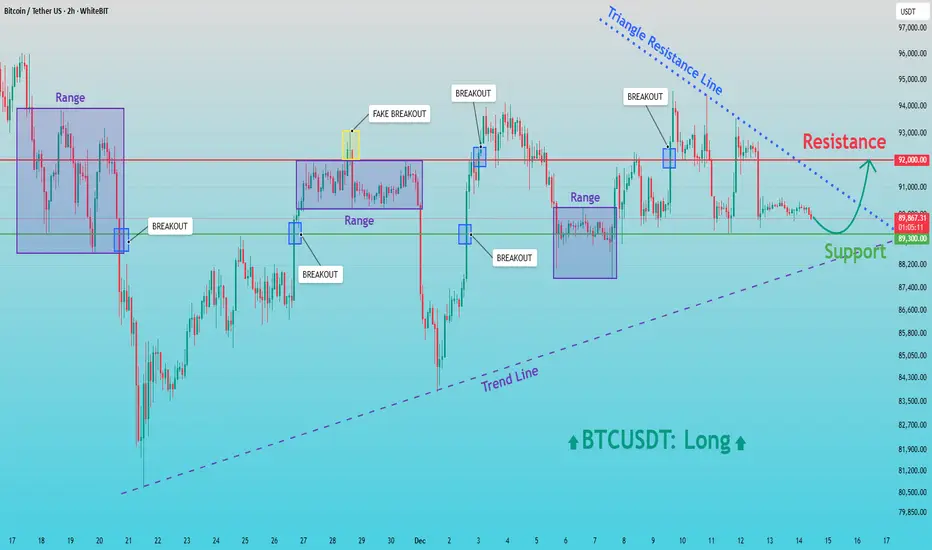
BTCUSD: Buyers in Control - Resistance Retest AheadHello everyone, here is my breakdown of the current BTCUSDT setup.
Market Analysis
BTCUSDT is currently trading within a broadly bullish structure, supported by a rising trend line that has been respected after the major sell-off and subsequent recovery. Following the strong decline, price formed a base near the lower levels and initiated a reversal, creating higher lows and shifting market control back to buyers. After the initial rebound, Bitcoin entered multiple Range phases, where price consolidated and built liquidity. Each range was followed by a breakout, confirming sustained buying interest. Some of these moves included fake breakouts, which briefly trapped participants before price continued to respect the broader bullish structure.
Currently, BTCUSDT is holding above the key Support Zone around 89,300, which has repeatedly acted as a demand area. Price is also compressing under a descending Triangle Resistance Line, while the rising trend line continues to support the market from below. This creates a tightening structure, suggesting that a decisive move is approaching. The 92,000 Resistance level remains the main barrier overhead, where sellers have previously stepped in and rejected higher prices.
My Scenario & Strategy
My scenario remains bullish as long as BTCUSDT holds above the 89,300 Support Zone and continues to respect the ascending trend line. I expect buyers to defend this area and gradually build pressure toward the upper resistance. A clean breakout above the 92,000 Resistance, especially with strong momentum, would confirm bullish continuation and open the path for a move toward higher levels, aligned with the broader trend.
However, if price fails to break the triangle resistance and loses the 89,300 Support, a deeper pullback toward the trend line could occur before buyers attempt another recovery. Until such a breakdown happens, the structure favors buyers. For now, the market remains constructive, with support holding and resistance at 92,000 as the key level to watch.
That’s the setup I’m tracking. Thank you for your attention, and always manage your risk.
USDJPY: Will Keep Growing! Here is Why:
The price of USDJPY will most likely increase soon enough, due to the demand beginning to exceed supply which we can see by looking at the chart of the pair.
Disclosure: I am part of Trade Nation's Influencer program and receive a monthly fee for using their TradingView charts in my analysis.
❤️ Please, support our work with like & comment! ❤️

GOLD On The Rise! BUY!
My dear friends,
Please, find my technical outlook for GOLD below:
The instrument tests an important psychological level 4283.9
Bias - Bullish
Technical Indicators: Supper Trend gives a precise Bullish signal, while Pivot Point HL predicts price changes and potential reversals in the market.
Target - 4298.8
Recommended Stop Loss - 4274.0
About Used Indicators:
Super-trend indicator is more useful in trending markets where there are clear uptrends and downtrends in price.
Disclosure: I am part of Trade Nation's Influencer program and receive a monthly fee for using their TradingView charts in my analysis.
———————————
WISH YOU ALL LUCK

XAUUSD Defends Support – Upside Move Toward 4,380 ExpectedHello traders! Here’s my technical outlook on XAUUSD based on the current market structure. Gold continues to trade within a well-established bullish trend, supported by a clear ascending Trend Line that has been respected after multiple pullbacks. After an earlier rejection from the upper Resistance Level, price experienced a corrective decline but successfully turned around near the trend line, confirming strong buyer interest at lower levels. Following this reaction, XAUUSD broke above the descending Resistance Line, signaling a shift in momentum back in favor of buyers. The market then entered a Range phase, where price consolidated between the Support Level around 4,260 and the Buyer Zone near 4,300, indicating accumulation and balance before the next impulse move. A confirmed breakout from the range occurred to the upside, with buyers aggressively pushing price above the Buyer Zone. Currently, gold is trading firmly above 4,300, showing sustained bullish strength and acceptance above previous resistance. The next key area of interest is the upper Seller Zone / Resistance Level around 4,380, which has acted as a strong reaction zone in the past. As long as price holds above the 4,260 Support Level and continues to respect the ascending trend line, the bullish scenario remains valid. My primary scenario is a continuation toward the 4,380 resistance, where a reaction or short-term rejection may occur. A clean breakout above this Seller Zone could open the door for further upside expansion, while rejection may lead to a healthy pullback toward the Buyer Zone or trend line support. For now, the structure clearly favors buyers, with 4,380 as the main upside target. Please share this idea with your friends and don’t forget to manage your risk 🚀

USOIL Will Go Up From Support! Long!
Please, check our technical outlook for USOIL.
Time Frame: 1h
Current Trend: Bullish
Sentiment: Oversold (based on 7-period RSI)
Forecast: Bullish
The market is approaching a key horizontal level 56.995.
Considering the today's price action, probabilities will be high to see a movement to 57.830.
P.S
We determine oversold/overbought condition with RSI indicator.
When it drops below 30 - the market is considered to be oversold.
When it bounces above 70 - the market is considered to be overbought.
Like and subscribe and comment my ideas if you enjoy them!

CADJPY: Long Signal with Entry/SL/TP
CADJPY
- Classic bullish formation
- Our team expects growth
SUGGESTED TRADE:
Swing Trade
Buy CADJPY
Entry Level - 112.73
Sl - 112.61
Tp - 112.96
Our Risk - 1%
Start protection of your profits from lower levels
Disclosure: I am part of Trade Nation's Influencer program and receive a monthly fee for using their TradingView charts in my analysis.
❤️ Please, support our work with like & comment! ❤️
