Long!!!!
EURGBP: Swing Trading & Technical Analysis
Balance of buyers and sellers on the EURGBP pair, that is best felt when all the timeframes are analyzed properly is shifting in favor of the buyers, therefore is it only natural that we go long on the pair.
Disclosure: I am part of Trade Nation's Influencer program and receive a monthly fee for using their TradingView charts in my analysis.
❤️ Please, support our work with like & comment! ❤️

EURUSD: Bullish Continuation & Long Signal
EURUSD
- Classic bullish setup
- Our team expects bullish continuation
SUGGESTED TRADE:
Swing Trade
Long EURUSD
Entry Point - 1.1655
Stop Loss - 1.1642
Take Profit - 1.1682
Our Risk - 1%
Start protection of your profits from lower levels
Disclosure: I am part of Trade Nation's Influencer program and receive a monthly fee for using their TradingView charts in my analysis.
❤️ Please, support our work with like & comment! ❤️

USDCHF: Will Start Growing! Here is Why:
The charts are full of distraction, disturbance and are a graveyard of fear and greed which shall not cloud our judgement on the current state of affairs in the USDCHF pair price action which suggests a high likelihood of a coming move up.
Disclosure: I am part of Trade Nation's Influencer program and receive a monthly fee for using their TradingView charts in my analysis.
❤️ Please, support our work with like & comment! ❤️

USDCAD Technical Analysis! BUY!
My dear subscribers,
USDCAD looks like it will make a good move, and here are the details:
The market is trading on 1.4021 pivot level.
Bias - Bullish
Technical Indicators: Both Super Trend & Pivot HL indicate a highly probable Bullish continuation.
Target - 1.4034
About Used Indicators:
The average true range (ATR) plays an important role in 'Supertrend' as the indicator uses ATR to calculate its value. The ATR indicator signals the degree of price volatility.
Disclosure: I am part of Trade Nation's Influencer program and receive a monthly fee for using their TradingView charts in my analysis.
———————————
WISH YOU ALL LUCK

SILVER Expected Growth! BUY!
My dear friends,
SILVER looks like it will make a good move, and here are the details:
The market is trading on 51.814 pivot level.
Bias - Bullish
Technical Indicators: Supper Trend generates a clear long signal while Pivot Point HL is currently determining the overall Bullish trend of the market.
Goal - 52.913
Recommended Stop Loss - 51.290
About Used Indicators:
Pivot points are a great way to identify areas of support and resistance, but they work best when combined with other kinds of technical analysis
Disclosure: I am part of Trade Nation's Influencer program and receive a monthly fee for using their TradingView charts in my analysis.
———————————
WISH YOU ALL LUCK

EURUSD: Watching for a Pullback Toward 1.1700 Hello, traders! The EURUSD pair has recently shown a clear shift in structure. After a prolonged bearish phase within a descending channel, the market found strong demand near the 1.15450 zone, where buyers managed to defend the area multiple times. This demand reaction led to a bullish breakout from the descending channel, marking the beginning of a new ascending phase.
Currently, the pair is moving within an ascending channel, forming higher highs and higher lows, which confirm the ongoing short-term bullish structure. However, the market is now approaching a key supply area around 1.1700, where sellers have previously been active.
My scenario for the upcoming sessions is a short-term corrective pullback from the current levels. I expect the price to retest the lower boundary of the ascending channel and potentially form a bullish reaction from that support. If buyers successfully defend this zone, the price could continue upward, aiming to break through the 1.1700 resistance and extend the bullish momentum. On the other hand, a confirmed breakdown below the channel would invalidate this bullish scenario and could open the way for a deeper correction. Manage your risk!

XAUUSD Weekly expectations Long/Shirt ?! 🧩 Market Overview
Gold is currently trading around $4,253 , after a strong drop of about -1.6% .
Price is moving inside a rising (uptrend) channel, but the recent red candle shows selling pressure.
⚙️ Key Zones
Resistance: $4,378 → Recent high where price was rejected
Support: $4,036 → Previous low / major demand zone
Buffer Zone: $4,200 → Important area to watch for bounce or breakdown
SSL (Sell-Side Liquidity): Below $4,200 → Possible stop-hunt area
📊 Possible Scenarios
🟢 Bullish :
If price bounces from the $4,200 buffer zone, it may continue higher towards $4,300–$4,378.
🔴 Bearish :
If price breaks and closes below $4,200 , it may fall toward $4,100–$4,036 .
My View
Gold is now near a decision zone.
I’ll wait to see if buyers defend $4,200 or if sellers break it down.
No rush — patience brings better entries.
💬 Disclaimer
This is not financial advice. It’s an educational analysis based on technical structure and liquidity levels.

EURJPY: Growth & Bullish Forecast
The recent price action on the EURJPY pair was keeping me on the fence, however, my bias is slowly but surely changing into the bullish one and I think we will see the price go up.
Disclosure: I am part of Trade Nation's Influencer program and receive a monthly fee for using their TradingView charts in my analysis.
❤️ Please, support our work with like & comment! ❤️

USDCHF On The Rise! BUY!
My dear followers,
This is my opinion on the USDCHF next move:
The asset is approaching an important pivot point 0.7934
Bias - Bullish
Technical Indicators: Supper Trend generates a clear long signal while Pivot Point HL is currently determining the overall Bullish trend of the market.
Goal - 0.7972
About Used Indicators:
For more efficient signals, super-trend is used in combination with other indicators like Pivot Points.
Disclosure: I am part of Trade Nation's Influencer program and receive a monthly fee for using their TradingView charts in my analysis.
———————————
WISH YOU ALL LUCK

SILVER: Trading Signal From Our Team
SILVER
- Classic bullish formation
- Our team expects growth
SUGGESTED TRADE:
Swing Trade
Buy SILVER
Entry Level - 51.814
Sl - 51.223
Tp - 52.966
Our Risk - 1%
Start protection of your profits from lower levels
Disclosure: I am part of Trade Nation's Influencer program and receive a monthly fee for using their TradingView charts in my analysis.
❤️ Please, support our work with like & comment! ❤️

USDCAD: Bullish Continuation is Expected! Here is Why:
It is essential that we apply multitimeframe technical analysis and there is no better example of why that is the case than the current USDCAD chart which, if analyzed properly, clearly points in the upward direction.
Disclosure: I am part of Trade Nation's Influencer program and receive a monthly fee for using their TradingView charts in my analysis.
❤️ Please, support our work with like & comment! ❤️

EURUSD Trading Opportunity! BUY!
My dear friends,
Please, find my technical outlook for EURUSD below:
The price is coiling around a solid key level - 1.1655
Bias - Bullish
Technical Indicators: Pivot Points Low anticipates a potential price reversal.
Super trend shows a clear buy, giving a perfect indicators' convergence.
Goal - 1.1684
Safe Stop Loss - 1.1640
About Used Indicators:
The pivot point itself is simply the average of the high, low and closing prices from the previous trading day.
Disclosure: I am part of Trade Nation's Influencer program and receive a monthly fee for using their TradingView charts in my analysis.
———————————
WISH YOU ALL LUCK

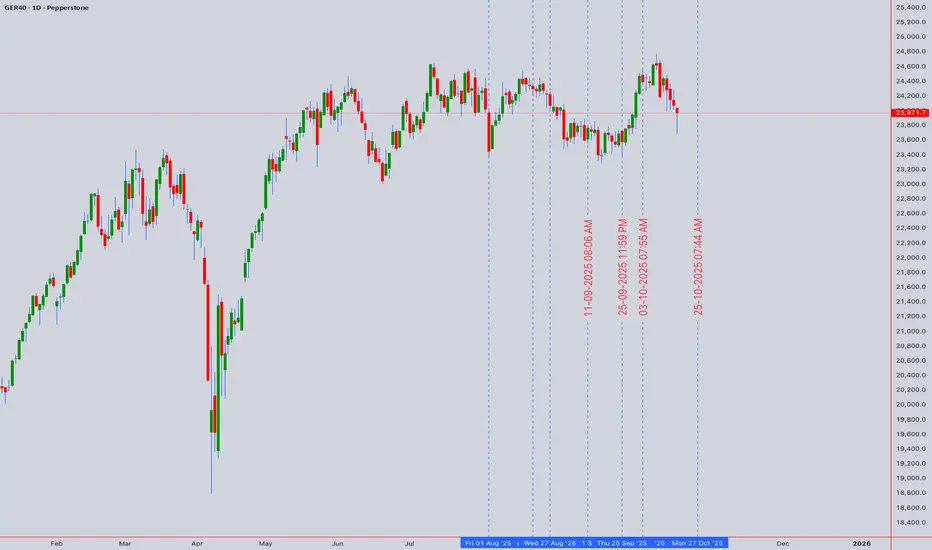
DAX Technical Forecast: Bullish Momentum Faces Key ResistanceGER40 (DAX) Technical Forecast: Bullish Momentum Faces Key Resistance
Analysis as of 18th Oct 2025 (Close: 23,971.7)
Market Context: The DAX exhibits robust bullish momentum, but is now testing a critical juncture. A confluence of technical factors on higher timeframes suggests the next move will be decisive for both intraday and swing traders.
Multi-Timeframe Analysis (Top-Down View)
Swing Bias (D1/4H): Bullish Above 23.7k
The daily chart reveals a strong uptrend, with price holding firmly above key moving averages (50 & 200 EMA). However, we are approaching a significant Wyckoffian Supply Zone and a potential Bullish Crab Harmonic pattern completion near the 24,200 - 24,300 resistance cluster. The RSI on the D1 is in bullish territory but not yet overbought, leaving room for further upside.
Intraday Bias (1H/30M): Cautiously Bullish
The 4H and 1H charts show price consolidating in a bullish flag formation. The Ichimoku Cloud on the 1H acts as dynamic support, while the Anchored VWAP from the recent low confirms a strong bullish trend. A break above the 24,050 level could trigger the next leg up.
Key Chart Patterns & Theories in Play
Elliott Wave: We are likely in a Wave 3 extension on the daily chart. A pullback to the 23,700 support would be a healthy Wave 4 before a final Wave 5 push.
Gann Analysis: The Square of 9 highlights 24,200 and 24,450 as potential time/price resistance targets for this swing.
Head and Shoulders? No traditional pattern is present. The primary risk is a Bull Trap if price rejects from the 24.3k resistance without a significant volume breakout.
Actionable Trade Setups
🟢 Swing Trade (Buy the Dip)
Entry: 23,700 - 23,800 (Zone of confluence with 50 EMA & Fibonacci 0.382 retracement)
Stop Loss: 23,500
Take Profit 1: 24,200
Take Profit 2: 24,450
🔴 Intraday Long (Momentum Break)
Trigger: A confirmed break and close above 24,050 on the 1H chart.
Entry: On retest of 24,000 as support.
Stop Loss: 23,900
Take Profit: 24,250
⚫ Intraday Short (Counter-Trend)
Trigger: A clear bearish rejection (e.g., Bearish Engulfing candle) at the 24,200 resistance with RSI divergence.
Entry: Upon rejection signal on the 30M chart.
Stop Loss: 24,350
Take Profit: 23,900
Key Levels
Resistance 3: 24,450 (Gann Target)
Resistance 2: 24,300 (Harmonic Completion)
Resistance 1: 24,050 - 24,100 (Immediate Hurdle)
Support 1: 23,850 (Recent Swing Low)
Support 2: 23,700 (Critical Bullish Defense)
Support 3: 23,500 (Trend Invalidation)
Conclusion
The DAX remains in a firm uptrend. The optimal strategy is to seek long entries on pullbacks towards key support. Be vigilant for a potential reversal at the 24.2k-24.3k resistance zone. Trade what you see, not what you hope.
Risk Warning: Trading carries significant risk. This analysis is for educational purposes and does not constitute financial advice. Always manage your risk and conduct your own due diligence.
XAUUSD Technical Analysis: Golden Crossroads at 4,246.86Executive Summary (1D & 4H Timeframes):
Gold is at a critical juncture. The daily chart reveals a battle between a dominant Head and Shoulders top pattern and a potential Elliott Wave 4 corrective pullback. The neckline at 4,220 is the line in the sand. A decisive break below confirms the H&S pattern, targeting 4,150. However, the 4H chart shows consolidation above this level, with the 200-EMA (4,235) and the 50% Fibonacci retracement providing immediate support. The RSI is bearish but not oversold, suggesting room for a move in either direction. The overarching trend from the last major low remains intact until 4,220 gives way.
Swing Trading Strategy (4H/Daily):
BEARISH SCENARIO (Below 4,220 ): Sell on a confirmed break and close below 4,220. Initial Target: 4,180 (H&S Measured Move). Final Target: 4,150. Stop Loss: 4,265 (above recent swing high).
BULLISH SCENARIO (Above 4,265 ): A hold above 4,235 (200-EMA) and a break above 4,265 invalidates the immediate bearish structure, targeting a retest of 4,300. Buy on a bullish reversal candle above 4,235. Stop Loss: 4,210 .
Intraday Trading Plan (1H/30M/15M):
SHORT SETUP: Look for price rejection at the 4,255 - 4,260 resistance zone (aligned with 4H VWAP and 50-EMA) with bearish candlestick confirmation (e.g., Bearish Engulfing). Sell Entry: 4,255. Target 1: 4,240. Target 2: 4,225. Stop Loss: 4,268.
LONG SETUP: Only valid if price holds above 4,235 and shows strength. A bounce from 4,235-4,240 with a bullish candle (Hammer, Bullish Engulfing) offers a long opportunity. Buy Entry: 4,238. Target 1: 4,255. Target 2: 4,265. Stop Loss: 4,225.
Key Market Drivers & Alerts:
Geopolitical & Macro Watch: Monitor USD strength (DXY) and real yields. Any escalation in global tensions could trigger a safe-haven rush, invalidating technical bearishness.
Indicator Cluster: The convergence of the 200-EMA, Fibonacci support, and the H&S neckline creates a high-probability zone for the next significant move.
Final Word:
The path of least resistance is bearish below 4,220. Intraday traders can fade rallies towards 4,255-4,260, while swing traders await the decisive break. Always manage risk; a close above 4,265 flips the script to bullish.
Trade safe and follow the price action. Like and follow for continued high-quality analysis!

DXY Will Go Higher! Buy!
Take a look at our analysis for DXY.
Time Frame: 1D
Current Trend: Bullish
Sentiment: Oversold (based on 7-period RSI)
Forecast: Bullish
The market is approaching a key horizontal level 98.541.
Considering the today's price action, probabilities will be high to see a movement to 99.742.
P.S
Overbought describes a period of time where there has been a significant and consistent upward move in price over a period of time without much pullback.
Like and subscribe and comment my ideas if you enjoy them!

GBPCHF Will Move Higher! Buy!
Here is our detailed technical review for GBPCHF.
Time Frame: 4h
Current Trend: Bullish
Sentiment: Oversold (based on 7-period RSI)
Forecast: Bullish
The market is on a crucial zone of demand 1.065.
The oversold market condition in a combination with key structure gives us a relatively strong bullish signal with goal 1.070 level.
P.S
The term oversold refers to a condition where an asset has traded lower in price and has the potential for a price bounce.
Overbought refers to market scenarios where the instrument is traded considerably higher than its fair value. Overvaluation is caused by market sentiments when there is positive news.
Like and subscribe and comment my ideas if you enjoy them!

GBP/CHF SENDS CLEAR BULLISH SIGNALS|LONG
Hello, Friends!
Bullish trend on GBP/CHF, defined by the green colour of the last week candle combined with the fact the pair is oversold based on the BB lower band proximity, makes me expect a bullish rebound from the support line below and a retest of the local target above at 1.076.
Disclosure: I am part of Trade Nation's Influencer program and receive a monthly fee for using their TradingView charts in my analysis.
✅LIKE AND COMMENT MY IDEAS✅

EUR/CHF BULLS ARE GAINING STRENGTH|LONG
Hello, Friends!
EUR-CHF downtrend evident from the last 1W red candle makes longs trades more risky, but the current set-up targeting 0.928 area still presents a good opportunity for us to buy the pair because the support line is nearby and the BB lower band is close which indicates the oversold state of the EUR/CHF pair.
Disclosure: I am part of Trade Nation's Influencer program and receive a monthly fee for using their TradingView charts in my analysis.
✅LIKE AND COMMENT MY IDEAS✅

USDJPY: Market of Buyers
The analysis of the USDJPY chart clearly shows us that the pair is finally about to go up due to the rising pressure from the buyers.
❤️ Please, support our work with like & comment! ❤️

EURCAD: Long Trading Opportunity
EURCAD
- Classic bullish formation
- Our team expects pullback
SUGGESTED TRADE:
Swing Trade
Long EURCAD
Entry - 1.6368
Sl - 1.6350
Tp - 1.6405
Our Risk - 1%
Start protection of your profits from lower levels
Disclosure: I am part of Trade Nation's Influencer program and receive a monthly fee for using their TradingView charts in my analysis.
❤️ Please, support our work with like & comment! ❤️

USDCAD What Next? BUY!
My dear friends,
My technical analysis for USDCAD is below:
The market is trading on 1.4030 pivot level.
Bias - Bullish
Technical Indicators: Both Super Trend & Pivot HL indicate a highly probable Bullish continuation.
Target - 1.4040
Recommended Stop Loss - 1.4025
About Used Indicators:
A pivot point is a technical analysis indicator, or calculations, used to determine the overall trend of the market over different time frames.
Disclosure: I am part of Trade Nation's Influencer program and receive a monthly fee for using their TradingView charts in my analysis.
———————————
WISH YOU ALL LUCK

NZDUSD Breakout and Potential RetraceHey Traders, in today's trading session we are monitoring NZDUSD for a buying opportunity around 0.57000 zone, NZDUSD was trading in a downtrend and currently is in a correction phase in which it is approaching the retrace area at 0.57000 support and resistance area.
Trade safe, Joe.
