$T with a bullish outlook following its earnings #StocksThe PEAD projected a bullish outlook for $T after a negative over reaction following its earnings release placing the stock in drift D with an expected accuracy of 84.62%.
Long!!

$GOOGL with a bullish outlook following its earnings #StocksThe PEAD projected a bullish outlook for NASDAQ:GOOGL after a positive over reaction following its earnings release placing the stock in drift A with an expected accuracy of 78.95%.

$AMZN with a bullish outlook following its earnings #StocksThe PEAD projected a bullish outlook for NASDAQ:AMZN after a positive over reaction following its earnings release, with an expected accuracy of 75%.

USDJPY: Expecting Bullish Continuation! Here is Why:
The charts are full of distraction, disturbance and are a graveyard of fear and greed which shall not cloud our judgement on the current state of affairs in the USDJPY pair price action which suggests a high likelihood of a coming move up.
Disclosure: I am part of Trade Nation's Influencer program and receive a monthly fee for using their TradingView charts in my analysis.
❤️ Please, support our work with like & comment! ❤️

AUDCAD: Long Trade with Entry/SL/TP
AUDCAD
- Classic bullish formation
- Our team expects pullback
SUGGESTED TRADE:
Swing Trade
Long AUDCAD
Entry - 0.9144
Sl - 0.9133
Tp - 0.9167
Our Risk - 1%
Start protection of your profits from lower levels
Disclosure: I am part of Trade Nation's Influencer program and receive a monthly fee for using their TradingView charts in my analysis.
❤️ Please, support our work with like & comment! ❤️

NZDJPY Expected Growth! BUY!
My dear followers,
I analysed this chart on NZDJPY and concluded the following:
The market is trading on 86.179 pivot level.
Bias - Bullish
Technical Indicators: Both Super Trend & Pivot HL indicate a highly probable Bullish continuation.
Target - 86.570
Safe Stop Loss - 85.959
About Used Indicators:
A super-trend indicator is plotted on either above or below the closing price to signal a buy or sell. The indicator changes color, based on whether or not you should be buying. If the super-trend indicator moves below the closing price, the indicator turns green, and it signals an entry point or points to buy.
Disclosure: I am part of Trade Nation's Influencer program and receive a monthly fee for using their TradingView charts in my analysis.
———————————
WISH YOU ALL LUCK

GBP/CAD LONG FROM SUPPORT
GBP/CAD SIGNAL
Trade Direction: long
Entry Level: 1.846
Target Level: 1.890
Stop Loss: 1.817
RISK PROFILE
Risk level: medium
Suggested risk: 1%
Timeframe: 1D
Disclosure: I am part of Trade Nation's Influencer program and receive a monthly fee for using their TradingView charts in my analysis.
✅LIKE AND COMMENT MY IDEAS✅

GBPCHF Is Bullish! Long!
Please, check our technical outlook for GBPCHF.
Time Frame: 1h
Current Trend: Bullish
Sentiment: Oversold (based on 7-period RSI)
Forecast: Bullish
The market is approaching a significant support area 1.058.
The underlined horizontal cluster clearly indicates a highly probable bullish movement with target 1.061 level.
P.S
We determine oversold/overbought condition with RSI indicator.
When it drops below 30 - the market is considered to be oversold.
When it bounces above 70 - the market is considered to be overbought.
Like and subscribe and comment my ideas if you enjoy them!

GOLD Is Very Bullish! Buy!
Here is our detailed technical review for GOLD.
Time Frame: 1h
Current Trend: Bullish
Sentiment: Oversold (based on 7-period RSI)
Forecast: Bullish
The market is on a crucial zone of demand 3,965.68.
The oversold market condition in a combination with key structure gives us a relatively strong bullish signal with goal 3,993.60 level.
P.S
Overbought describes a period of time where there has been a significant and consistent upward move in price over a period of time without much pullback.
Like and subscribe and comment my ideas if you enjoy them!

BTC Price Prediction – Key Support at 98900 Before Next Big MoveBitcoin is currently trading around $105,700, showing a short-term correction after a strong sell-off.
Trendline: A clear descending resistance line continues to hold, capping all recovery attempts.
Break of Structure: The BOS from 109,800 → 103,000 confirms bearish control.
Order Blocks:
🔴 Supply zones: $107,800 → $109,800 and $111,400 → $115,900 — strong resistance where sellers are likely to react.
🔵 Demand zones: $103,000 → $100,000 and a deeper block near $98,900, aligning with a trendline support — potential rebound area.
Volume: Buyer interest weakened after the recent bounce — showing limited demand at current levels.
Bias: Still bearish until BTC breaks above EMA trendline / $107,800 zone.
Next supports are $103,000 and $98,900; resistance levels remain at $107,800 and $111,400.

CHFJPY: Bullish Continuation
The price of CHFJPY will most likely increase soon enough, due to the demand beginning to exceed supply which we can see by looking at the chart of the pair.
Disclosure: I am part of Trade Nation's Influencer program and receive a monthly fee for using their TradingView charts in my analysis.
❤️ Please, support our work with like & comment! ❤️

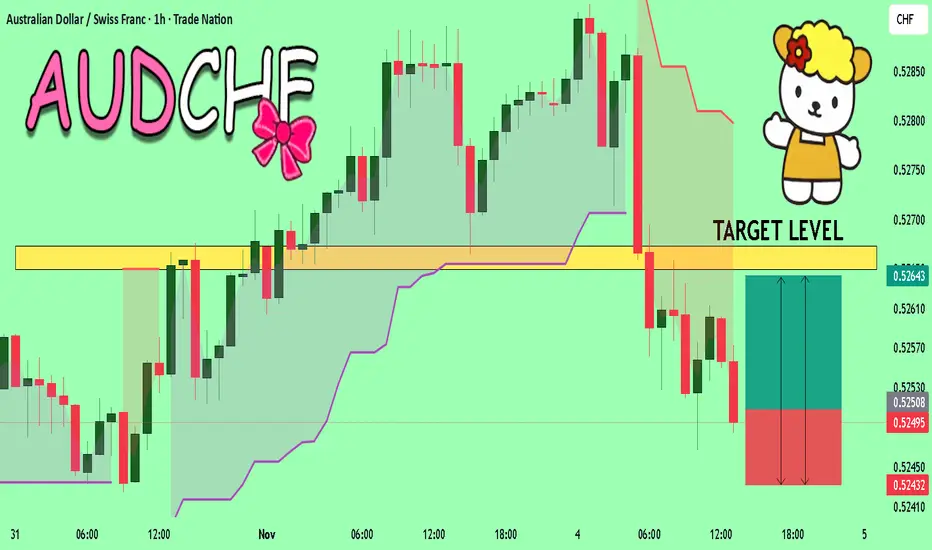
AUDCHF What Next? BUY!
My dear friends,
My technical analysis for AUDCHF is below:
The market is trading on 0.5250 pivot level.
Bias - Bullish
Technical Indicators: Both Super Trend & Pivot HL indicate a highly probable Bullish continuation.
Target - 0.5264
Recommended Stop Loss - 0.5243
About Used Indicators:
A pivot point is a technical analysis indicator, or calculations, used to determine the overall trend of the market over different time frames.
Disclosure: I am part of Trade Nation's Influencer program and receive a monthly fee for using their TradingView charts in my analysis.
———————————
WISH YOU ALL LUCK
EURJPY Trading Opportunity! BUY!
My dear friends,
Please, find my technical outlook for EURJPY below:
The instrument tests an important psychological level 176.29
Bias - Bullish
Technical Indicators: Supper Trend gives a precise Bullish signal, while Pivot Point HL predicts price changes and potential reversals in the market.
Target - 177.26
About Used Indicators:
Super-trend indicator is more useful in trending markets where there are clear uptrends and downtrends in price.
Disclosure: I am part of Trade Nation's Influencer program and receive a monthly fee for using their TradingView charts in my analysis.
———————————
WISH YOU ALL LUCK

NZDCAD: Will Start Growing! Here is Why:
Our strategy, polished by years of trial and error has helped us identify what seems to be a great trading opportunity and we are here to share it with you as the time is ripe for us to buy NZDCAD.
Disclosure: I am part of Trade Nation's Influencer program and receive a monthly fee for using their TradingView charts in my analysis.
❤️ Please, support our work with like & comment! ❤️

AUDUSD Trading Opportunity! BUY!
My dear followers,
This is my opinion on the AUDUSD next move:
The asset is approaching an important pivot point 0.6496
Bias - Bullish
Technical Indicators: Supper Trend generates a clear long signal while Pivot Point HL is currently determining the overall Bullish trend of the market.
Goal - 0.6533
About Used Indicators:
For more efficient signals, super-trend is used in combination with other indicators like Pivot Points.
Disclosure: I am part of Trade Nation's Influencer program and receive a monthly fee for using their TradingView charts in my analysis.
———————————
WISH YOU ALL LUCK

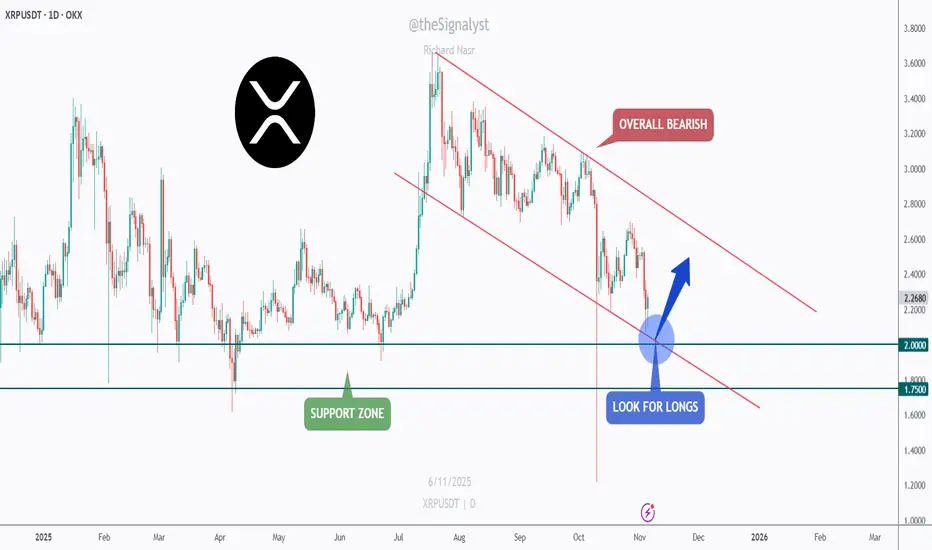
XRP - Watching the Confluence Zone for a Bullish Rebound!📉XRP has been in a clear bearish channel for months , forming consistent lower highs and lower lows.
However, the current structure is approaching a critical confluence zone, where the lower bound of the red channel meets the major green support area between $1.75 and $2.00.
⚔️As long as this intersection holds, I’ll be looking for potential long opportunities, anticipating a short-term bullish correction toward the upper boundary of the channel.
This setup offers a clean risk-to-reward opportunity if the bulls manage to defend the zone and regain momentum.
If the support gives way, further downside could follow, but for now, this area remains a key decision point for XRP’s next move.
⚠️ Disclaimer: This is not financial advice. Always do your own research and manage risk properly.
📊All Strategies Are Good; If Managed Properly!
~Richard Nasr
EURUSD: Rebound Phase Developing From 1.1510 Support ZoneHello everyone, here is my breakdown of the current Euro setup.
Market Analysis
EURUSD has been forming a complex market structure, transitioning through several distinct phases. Initially, the pair traded within a Range Zone, showing indecision between buyers and sellers. A strong bullish breakout from the range led to the creation of an Upward Channel, where buyers maintained momentum until the price reached the 1.1660 Resistance Zone. This level acted as a significant supply area, resulting in multiple rejection points and eventually a bearish breakout from the channel.
Recently, EURUSD began consolidating in a Descending Triangle Pattern, with the Triangle Resistance Line serving as a dynamic barrier against bullish attempts and the Triangle Support Line acting as a demand zone. Currently, the pair is testing this support zone around 1.1500–1.1480, which has already provided several short-term rebounds. A clear break below this area could confirm a continuation of the bearish structure, potentially pushing price lower toward 1.1450 and even 1.1400. On the other hand, a rebound from the support line with strong bullish momentum could signal the beginning of a reversal move, targeting the resistance levels at 1.1530–1.1540.
My Scenario & Strategy
From my perspective, EURUSD sits at a pivotal technical point. If the Triangle Support Line continues to hold, I expect a bullish breakout attempt above the triangle’s resistance, confirming a possible trend reversal toward higher levels. Short-term traders could look for long entries near the 1.1500 support zone with tight stop-losses below 1.1480, aiming for a retest of 1.1530–1.1540. However, if the pair breaks and closes below 1.1480, it would invalidate the bullish scenario and likely trigger renewed selling pressure toward 1.1450–1.1400. For now, I remain cautiously bullish, expecting a potential rebound from the support base before a decisive move unfolds.
That's the setup I'm tracking. Thank you for your attention, and always manage your risk.

XAUUSD: Bulls Defend Channel Support, Eyeing $4,130 ReboundHello everyone, here is my breakdown of the current Gold setup.
Market Analysis
Gold (XAUUSD) continues to trade within a well-defined upward channel, showing a clear structure of higher highs and higher lows. After a series of breakouts and retests, the price recently tested the channel support and the key demand zone around $3,900–3,920, confirming buyers’ activity in that area.
Currently, previous fake breakout above the $4,130 resistance area led to a pullback, but the market is now stabilizing and showing early signs of bullish momentum. This zone aligns with both the lower boundary of the ascending channel and a horizontal support area — a technically strong confluence that often attracts long positions.
My Scenario & Strategy
The current setup suggests that as long as the $3,900 support holds, gold remains in a bullish structure. A confirmed bounce from the lower channel boundary would likely trigger a new impulsive move toward the $4,130 resistance zone, which is also the previous breakout area. If buyers manage to break and hold above that resistance, the next potential upside target is around $4,200–$4,250, aligning with the upper boundary of the channel.
My strategy here is to look for bullish confirmation signals (candlestick patterns or volume breakout) near the support zone and aim for long entries with targets toward $4,130 and higher. A daily close below $3,880 would invalidate this scenario and open the door for a deeper correction.
That's the setup I'm tracking. Thank you for your attention, and always manage your risk.

BTCUSD Rebounds from Support — Bulls Eye $106K Recovery MoveHello traders, I want to share with you my opinion about Bitcoin (BTCUSD). Bitcoin has been experiencing a prolonged corrective phase following a previous bullish rally. The market recently retested the Buyer Zone near $103,800–$104,200, where strong demand has once again emerged. This area has historically acted as a reliable support level, preventing deeper declines and triggering multiple rebounds. Currently, the structure is forming a descending wedge pattern, characterized by converging resistance and support lines. This technical formation often signals potential bullish reversals, especially when it appears near a key demand zone. The latest test of the lower wedge boundary coincided with the Support Level, resulting in a sharp reaction from buyers. From my perspective, as long as the price holds above the Buyer Zone, the probability of a bullish breakout increases. A confirmed breakout above the resistance line would likely validate a move toward the $106,000 TP1 level, which aligns with previous local highs and the upper boundary of the pattern. However, if BTC fails to break the resistance and falls back below $103,800, sellers could temporarily regain control, pushing the price lower before another accumulation phase develops. Overall, the current setup favors the bulls, with clear structural support and a tightening pattern suggesting that Bitcoin may soon attempt a rebound toward $106,000 and potentially higher levels. Please share this idea with your friends and click Boost 🚀

GBP/AUD BUYERS WILL DOMINATE THE MARKET|LONG
GBP/AUD SIGNAL
Trade Direction: long
Entry Level: 2.006
Target Level: 2.031
Stop Loss: 1.989
RISK PROFILE
Risk level: medium
Suggested risk: 1%
Timeframe: 1D
Disclosure: I am part of Trade Nation's Influencer program and receive a monthly fee for using their TradingView charts in my analysis.
✅LIKE AND COMMENT MY IDEAS✅

GBP/CHF BULLISH BIAS RIGHT NOW| LONG
Hello, Friends!
GBP/CHF pair is in the downtrend because previous week’s candle is red, while the price is clearly falling on the 1D timeframe. And after the retest of the support line below I believe we will see a move up towards the target above at 1.075 because the pair oversold due to its proximity to the lower BB band and a bullish correction is likely.
Disclosure: I am part of Trade Nation's Influencer program and receive a monthly fee for using their TradingView charts in my analysis.
✅LIKE AND COMMENT MY IDEAS✅

Bitcoin TA and ALT coin TAHi guys,
I hope you enjoyed the video! Its going to be a very existing next 3 months!

Exide india in breaout? As per my analsyzi exide india i string support , finishes its retracement. 223 is my analsis tArget
