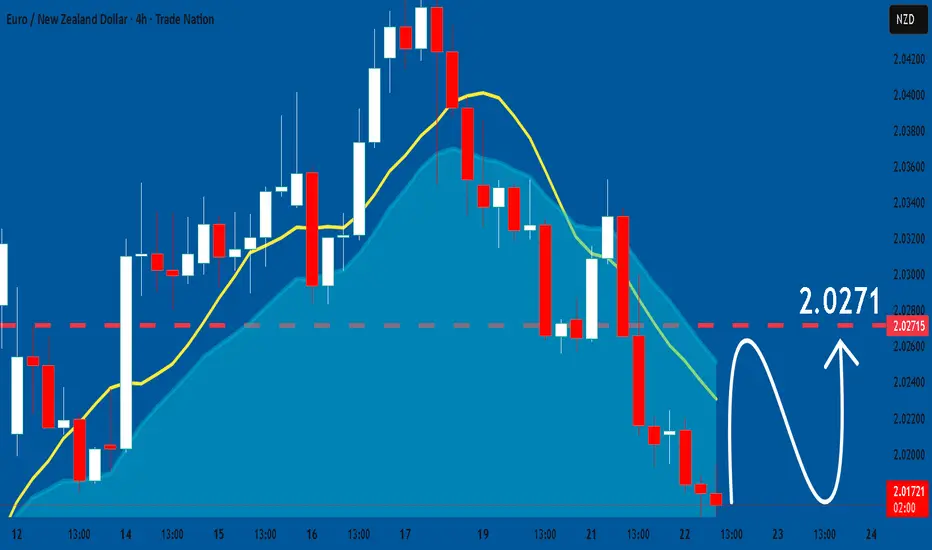
GBPAUD: Long Trade Explained
GBPAUD
- Classic bullish pattern
- Our team expects retracement
SUGGESTED TRADE:
Swing Trade
Buy GBPAUD
Entry - 2.0511
Stop - 2.0488
Take - 2.0556
Our Risk - 1%
Start protection of your profits from lower levels
Disclosure: I am part of Trade Nation's Influencer program and receive a monthly fee for using their TradingView charts in my analysis.
❤️ Please, support our work with like & comment! ❤️
Long!!

NZDUSD Will Go Higher! Buy!
Please, check our technical outlook for NZDUSD.
Time Frame: 1D
Current Trend: Bullish
Sentiment: Oversold (based on 7-period RSI)
Forecast: Bullish
The market is approaching a significant support area 0.574.
The underlined horizontal cluster clearly indicates a highly probable bullish movement with target 0.584 level.
P.S
We determine oversold/overbought condition with RSI indicator.
When it drops below 30 - the market is considered to be oversold.
When it bounces above 70 - the market is considered to be overbought.
Like and subscribe and comment my ideas if you enjoy them!

GBPJPY Will Move Higher! Long!
Take a look at our analysis for GBPJPY.
Time Frame: 12h
Current Trend: Bullish
Sentiment: Oversold (based on 7-period RSI)
Forecast: Bullish
The price is testing a key support 203.667.
Current market trend & oversold RSI makes me think that buyers will push the price. I will anticipate a bullish movement at least to 205.373 level.
P.S
Please, note that an oversold/overbought condition can last for a long time, and therefore being oversold/overbought doesn't mean a price rally will come soon, or at all.
Like and subscribe and comment my ideas if you enjoy them!

GBPNZD: Bullish Forecast & Outlook
The analysis of the GBPNZD chart clearly shows us that the pair is finally about to go up due to the rising pressure from the buyers.
❤️ Please, support our work with like & comment! ❤️

EURCAD My Opinion! BUY!
My dear friends,
Please, find my technical outlook for EURCAD below:
The instrument tests an important psychological level 1.6247
Bias - Bullish
Technical Indicators: Supper Trend gives a precise Bullish signal, while Pivot Point HL predicts price changes and potential reversals in the market.
Target - 1.6323
About Used Indicators:
Super-trend indicator is more useful in trending markets where there are clear uptrends and downtrends in price.
Disclosure: I am part of Trade Nation's Influencer program and receive a monthly fee for using their TradingView charts in my analysis.
———————————
WISH YOU ALL LUCK

NZDCAD Will Explode! BUY!
My dear friends,
Please, find my technical outlook for NZDCAD below:
The price is coiling around a solid key level - 0.8037
Bias - Bullish
Technical Indicators: Pivot Points High anticipates a potential price reversal.
Super trend shows a clear buy, giving a perfect indicators' convergence.
Goal - 0.8048
Safe Stop Loss - 0.8031
About Used Indicators:
The pivot point itself is simply the average of the high, low and closing prices from the previous trading day.
Disclosure: I am part of Trade Nation's Influencer program and receive a monthly fee for using their TradingView charts in my analysis.
———————————
WISH YOU ALL LUCK

COPPER - Following Gold?Hello TradingView Family / Fellow Traders. This is Richard, also known as theSignalyst.
📈 COPPER has been overall bullish, trading inside the rising wedge pattern in blue.
At present, COPPER is undergoing a correction phase and it is hovering around the lower bound of the wedge.
Moreover, it is retesting a massive support zone marked in green.
🏹 Thus, the highlighted blue circle is a strong area to look for buy setups as it is the intersection of the green support and lower blue trendline acting as a non-horizontal support.
📚 As per my trading style:
As #COPPER approaches the blue circle zone, I will be looking for bullish reversal setups (like a double bottom pattern, trendline break , and so on...)
📚 Always follow your trading plan regarding entry, risk management, and trade management.
Good luck!
All Strategies Are Good; If Managed Properly!
~Rich

EURNZD: Expecting Bullish Continuation! Here is Why:
Looking at the chart of EURNZD right now we are seeing some interesting price action on the lower timeframes. Thus a local move up seems to be quite likely.
Disclosure: I am part of Trade Nation's Influencer program and receive a monthly fee for using their TradingView charts in my analysis.
❤️ Please, support our work with like & comment! ❤️
GOLD: Long Trade with Entry/SL/TP
GOLD
- Classic bullish setup
- Our team expects bullish continuation
SUGGESTED TRADE:
Swing Trade
Long GOLD
Entry Point - 4048.5
Stop Loss - 4029.6
Take Profit - 4083.6
Our Risk - 1%
Start protection of your profits from lower levels
Disclosure: I am part of Trade Nation's Influencer program and receive a monthly fee for using their TradingView charts in my analysis.
❤️ Please, support our work with like & comment! ❤️

EURUSD The Target Is UP! BUY!
My dear subscribers,
My technical analysis for EURUSD is below:
The price is coiling around a solid key level - 1.1581
Bias - Bullish
Technical Indicators: Pivot Points Low anticipates a potential price reversal.
Super trend shows a clear buy, giving a perfect indicators' convergence.
Goal - 1.1630
About Used Indicators:
By the very nature of the supertrend indicator, it offers firm support and resistance levels for traders to enter and exit trades. Additionally, it also provides signals for setting stop losses
Disclosure: I am part of Trade Nation's Influencer program and receive a monthly fee for using their TradingView charts in my analysis.
———————————
WISH YOU ALL LUCK

USDJPY Is Going Up! Buy!
Take a look at our analysis for USDJPY.
Time Frame: 1D
Current Trend: Bullish
Sentiment: Oversold (based on 7-period RSI)
Forecast: Bullish
The market is approaching a key horizontal level 151.763.
Considering the today's price action, probabilities will be high to see a movement to 154.639.
P.S
Overbought describes a period of time where there has been a significant and consistent upward move in price over a period of time without much pullback.
Like and subscribe and comment my ideas if you enjoy them!

NZDJPY Will Go Up! Long!
Please, check our technical outlook for NZDJPY.
Time Frame: 4h
Current Trend: Bullish
Sentiment: Oversold (based on 7-period RSI)
Forecast: Bullish
The market is approaching a significant support area 86.230.
The underlined horizontal cluster clearly indicates a highly probable bullish movement with target 87.213 level.
P.S
Please, note that an oversold/overbought condition can last for a long time, and therefore being oversold/overbought doesn't mean a price rally will come soon, or at all.
Like and subscribe and comment my ideas if you enjoy them!

USDCHF Is Going Up! Long!
Here is our detailed technical review for USDCHF.
Time Frame: 1h
Current Trend: Bullish
Sentiment: Oversold (based on 7-period RSI)
Forecast: Bullish
The market is on a crucial zone of demand 0.793.
The oversold market condition in a combination with key structure gives us a relatively strong bullish signal with goal 0.796 level.
P.S
Overbought describes a period of time where there has been a significant and consistent upward move in price over a period of time without much pullback.
Like and subscribe and comment my ideas if you enjoy them!

XAUUSD: Correction Within Uptrend – Demand Zone in FocusHello, traders! The gold market (XAUUSD) continues to demonstrate strong bullish momentum within a clearly defined uptrend structure that has been developing for several weeks. The movement is characterized by a sequence of higher highs and higher lows, supported by a well-respected ascending trend line. Throughout this upward phase, we’ve observed multiple breakouts from short-term consolidation zones and corrections — each confirming the dominance of buyers. These breakouts, marked on the chart, acted as continuation signals that pushed price toward new local highs.
Currently, after reaching the 4,360.00 area, gold entered a corrective phase, forming a short-term retracement. This pullback brought the price back to the previously broken trend line and into the Demand Zone 2 (4,200–4,250) — an area that has repeatedly served as strong support for the market.
My scenario for the development, if sellers manage to push the price below the 4,200.00 level, the structure will temporarily weaken, and we may see a deeper correction toward the next Demand Zone 2 (4,100–3,950). This zone would then act as a potential re-accumulation area before buyers could regain control. At the same time, Demand Zone 1, located higher, continues to confirm the overall bullish context — showing that gold maintains its medium-term uptrend despite the current short-term correction. Manage your risk!

GBPUSD - SELL - Descending channel Market Context:
• Descending Channel in play
• Price testing upper boundary (dynamic resistance)
• Previous Supply Zone adds strong rejection potential
Trade Plan:
• Entry: 1.3400 – 1.3420
• Stop Loss: 1.3470 (above last swing high)
• Target 1: 1.3350 (channel midpoint)
• Target 2: 1.3220 (major demand zone)
• RR: ~1:3.6 to T2
Key Notes:
• Wait for bearish candlestick confirmation
• Take partial profit at T1, move SL to breakeven
• High-probability counter-trend trade within channel

BTCUSD Completes Correction – Heading Towards $125,000BINANCE:BTCUSD is currently trading in a well-defined ascending channel, indicating that the bullish trend continues. The price is following the channel's structure, creating higher highs and higher lows, which is a clear sign that the uptrend remains intact. The recent price correction shows a healthy pullback, which could serve as the foundation for the next upward move.
The price is now approaching an important support zone, marked by the lower boundary of the channel and a previous demand zone. If this support holds, it could present an opportunity for buyers to re-enter with strength. The expected target is $125,000 , aligning with the middle of the channel and the previous resistance level.
As long as the price remains above the support zone and the ascending trendline, the bullish scenario remains valid. However, if the price breaks below this level, it could invalidate the current setup and increase the likelihood of a deeper correction.
Always ensure you confirm your setups and trade with proper risk management.
Good luck!

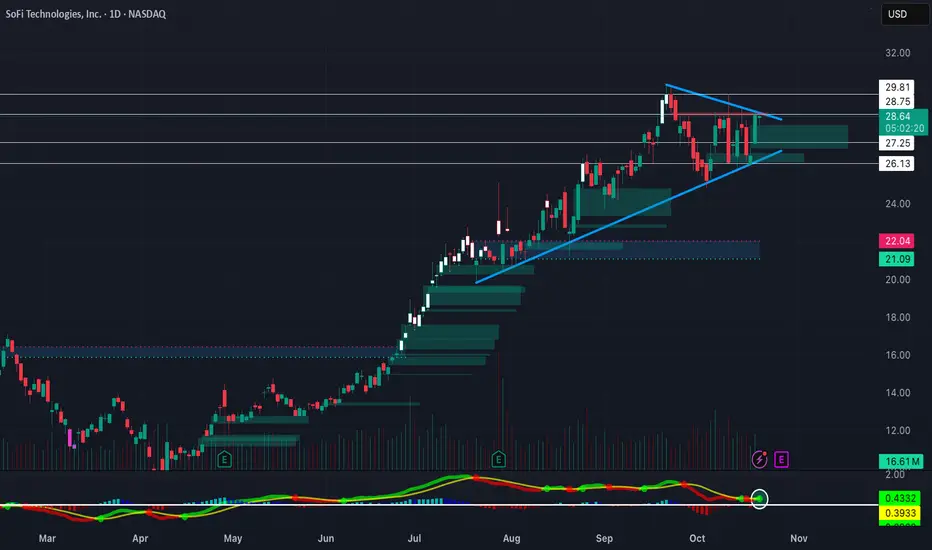
Triangle Break Heading into EarningsNASDAQ:SOFI Forming a big symmetrical triangle on the daily timeframe heading into earnings. EMA's are starting to curl upwards after NASDAQ:SOFI found some support on its 50-day SMA. Bullish long-term on NASDAQ:SOFI , so definitely will be watching this one closely
AUDNZD: Bullish Continuation & Long Trade
AUDNZD
- Classic bullish formation
- Our team expects growth
SUGGESTED TRADE:
Swing Trade
Buy AUDNZD
Entry Level - 1.1323
Sl - 1.1316
Tp - 1.1338
Our Risk - 1%
Start protection of your profits from lower levels
Disclosure: I am part of Trade Nation's Influencer program and receive a monthly fee for using their TradingView charts in my analysis.
❤️ Please, support our work with like & comment! ❤️


Gold Pullback Could Be the Next Buying OpportunityHello, traders, I want share with you my opinion about Gold. The market for Gold has been trading within a clear bullish structure, forming an ascending channel since breaking out from the earlier range near the 4,050–4,100 zone. The breakout from that consolidation led to strong upward momentum, with price making consistent higher highs and higher lows. Recently, the market faced strong selling pressure from the Seller Zone near 4,366, which aligns with the Resistance Level. After a retest of this supply area, price rejected and started a correction within the channel. The price is approaching the Buyer Zone around 4,205, which also coincides with the lower boundary of the ascending channel and the previous support level. This confluence makes the area significant for potential bullish reactions. I expect Gold to retest the Buyer Zone (4,205) and, if buyers show strength, a bounce toward 4,320–4,366 could follow. This would represent the continuation of the uptrend within the ascending channel. However, if price breaks below 4,205, it would signal a possible shift in structure and open the door for a deeper correction toward the 4,100 area. Please share this idea with your friends and click Boost 🚀

Euro can Continue its Rally After a Minor CorrectionHello traders, I want share with you my opinion about Euro. The market for the Euro has been through a highly complex series of structural shifts, transitioning from a prior upward channel into a well-defined downward channel. After multiple failed rallies and a final drop into the 1.1600 buyer zone, the price action for EURUSD has shown a significant reversal, breaking out of the downward channel and establishing a new short-term bullish momentum. Currently, after this strong breakout, the asset is undergoing a minor corrective phase. In my mind, this price action represents a healthy pullback before the next leg higher. I expect that the price will make a small dip to find support, likely retesting the broken channel structure from above. I think a confirmed bounce from this area will validate the bullish breakout and trigger a continuation of the rally. Therefore, I have placed my TP at the major 1.1780 Resistance Level, which aligns with the seller zone and represents a logical objective for this recovery. Please share this idea with your friends and click Boost 🚀
Disclaimer: As part of ThinkMarkets’ Influencer Program, I am sponsored to share and publish their charts in my analysis.

#035: USD/JPY Long Investment Opportunity
In recent days, the USD/JPY pair has experienced a period of considerable uncertainty, alternating between impulsive movements and periods of consolidation. Hello, I'm Andrea Russo, an independent Forex trader and prop trader with $200,000 in capital under management. Thank you in advance for your time.
At first glance, it may seem like a confusing market, but behind this apparent calm lies a delicate balance between monetary policy, relative strength, and the positioning of the largest operators.
My attention has focused on a specific price area where the market has shown signs of absorbing bearish pressure. The latest candlesticks have highlighted a slowdown in selling and, more importantly, increased buying in moments of weakness—a typical behavior of strong hands in the accumulation phase.
The macroeconomic context remains clear: the United States maintains an advantage in terms of interest rates and yields, while Japan continues to demonstrate accommodative policies. This divergence, although already known to the market, continues to support the dollar at key moments. However, it's not so much the overall direction that matters, but the timing with which the price shows its willingness to resume its rally after a natural pause.
I chose to position myself early, not to chase the movement, but to wait for the market to catch me at the point where demand exceeds supply. It's a strategy that requires patience and composure: it's not about predicting, but knowing how to wait for institutional pressure to confirm your intention.

EURUSD: Bulls Will Push Higher
Remember that we can not, and should not impose our will on the market but rather listen to its whims and make profit by following it. And thus shall be done today on the EURUSD pair which is likely to be pushed up by the bulls so we will buy!
Disclosure: I am part of Trade Nation's Influencer program and receive a monthly fee for using their TradingView charts in my analysis.
❤️ Please, support our work with like & comment! ❤️
