SOL Parabolic Run Despite the recent chop, when you zoom out to the 1D timeframe there is a clear pattern being followed since the April crash.
From the sub $100 low Solana has posted progressively higher lows in a parabolic fashion. The highs on the other hand are in more of a linear fashion as shown by the diagonal S/R level, at first it provided support and now since March it has been resistance.
So for me there are two possible actionable trades:
- Continuation of the parabolic move, this would include flipping the Diagonal S/R level, currently at time of writing this resistance level is being tested, a close above gives a better possibility of the rally continuing.
- The rally becomes exhausted and fails to flip the Diagonal S/R and loses the parabolic support level. Should this support break $185 is the first target (light green zone), $160 as the second target (dark green zone).
Important to remember we have CPI & FOMC rapidly approaching that could provide the volatility to trigger either of these moves, lets see what happens next.
Long-short

Tesla Breakout? For the majority of the calendar year TESLA has been in a range between $220 - $365 with a clear midpoint of $295.
From March to the beginning of May TESLA bounced between range low and the midpoint until finally breaking through into the upper half of the range where it has stayed ever since. However, there is a clear diagonal resistance level that is preventing higher highs.
So will TESLA breakout, or will it lose the midpoint? Structurally it is clear that the bulls have a set level they are happy to buy at (Midpoint) but the bears are getting more aggressive with their selling, hence the lower highs. This compression inevitably leads to an impulse move but the direction is not so clear.
Bullish scenario: A clean breakout with volume that makes a new higher high, signaling a shift in structure. A pullback and retest of the breakout would be an ideal opportunity to go long and aim for that range high before expecting resistance.
Bearish scenario: The lower highs keep printing until the midpoint is lost and price accepts below it, that would then signify to me the new trading range is between Range Low and Midpoint.
The fakeout scenario is a risk but with price so close to the midpoint already it follows the same invalidation criteria as the bullish scenario, the midpoint is vital to both sides.

XAUUSD BreakoutAfter a strong rally up since the beginning of the year, Spot Gold struggled to breakthrough $3,425 for the last 129 days. However, since the beginning of the week Gold broke through that level surging +4.3%.
Seeing Gold continue to rally alongside the stock market, both of which at all time highs despite typically having an inverse relationship.
With M2 money supply ever growing, rate cuts continuing and acceptance of higher levels of inflation there is plenty of fuel to keep this move going no matter how unnatural it feels. Gold typically thrives in risk-off environments but this year has seen huge progress.
Now Gold has entered price discovery it's about riding the wave of momentum caused by the breakout. Should Gold turn around and get back below $3,425 there is potential for worry, a SFP confirmation is bearish. A retest of $3,425 as support with bullish continuation is a more comfortable hold.

XRP 4H Breakout?XRP has been forming a triangle pattern with a flat low and lower highs compressing into a point.
Generally this suggests that the bulls are willing to buy at a strong level but with declining strength, the bears on the other hand are repeatedly pushing price back down from lower points each time which leaves two possible scenarios that are actionable:
Bullish - A breakout above the downtrend line with significant volume, I think BTC will have a large part to play in this. Following the breakout a flip in structure with new highs and new lows would give the signal XRP is ready to go higher.
Bearish - This chart pattern generally does lead to continuation of selling off, the trigger would be a loss of the green box/equal lows. Should price break below a lot of the previous rally would look to be infilled, target price would be $2.35
Two good triggers and plans for each, anything in between is not actionable to me as I have no strategy that I am confident could produce a profitable outcome in the mean time, I'll be patient instead.

Ethereum 4H Range As we approach nearly a month in the range from $4000-4800 it looks like ETH is making a move once again.
Previously once hitting $4800 price gradually sold off back towards range low creating a bearish trendline, once the price broken above that level a rapid move up to range high within two candles.
Now looking at the chart we have a similar setup, strong breakout from the bearish trendline up into midpoint. Bitcoin currently retesting a key level of $112,000, should BTC flip this level I could see alts getting the greenlight to move up and Ethereum up to the highs.
Should BTC reject from $112,000 it makes sense that ETH range midpoint would be strong resistance, rejection could lead to a range low retest. Anything else that isn't either range high, range low or midpoint is noise and for me no action required, no need to over complicate it.

01/09/25 Weekly OutlookLast weeks high: $113,692.97
Last weeks low: $107,357.75
Midpoint: $110,525.36
Despite continuing the short term bearish trend, BTC saw a net inflow of $441m via ETFs last week and $1.08B for Ethereum ETFs. Continuing high demand has capped this drawdown for now at weekly low (~$107,500) with three separate drives into the level and a bounce each time there is a clear line in the sand to monitor this week, for now it is advantage bulls.
In terms of data releases there isn't much big news on the way apart from Unemployment data later in the week. I don't expect this data to influence the decision to cut interest rates later this month, as it stands a cut is going to happen. We've just started a new month and so as always bigger players who de-risked for month end can begin deploying capital once again during a period that will be pricing in a rate cut. These factors look good for the bulls after a 14% drawdown from ATHs, could the local low be in?
For me I'm still mindful of the previous poor performances each year around September, the difference being this time a rate cut is on the way which changes the dynamics slightly. IF Bitcoin were to retest the $100k mark the R:R on a long there would be huge, a -20% move down, quite normal in bull market situations.
IF the 0.25 line (~$109,000) hold/reclaim a LTF change in structure would be bullish with an invalidation below weekly low. The target from there would be weekly high for the bulls.

25/08/25 Weekly OutlookLast weeks high: $117,955
Last weeks low: $110,678.07
Midpoint: $114,316.53
This weekly outlook is a day late due to a public holiday but what happened last week is clear. A sell-off from Monday all the way until Sunday and as suggested in the last weeks outlook the $108,000-$111,000 level did provide the support BTC bulls were looking for, after a 6.2% drop from high to low despite a Friday rally thanks to the FED chairs speech.
Looking at the chart it is in my opinion not ideal for the bulls, my reasoning for this:
August/September seasonality coming into play. Historically a poor return in this period of the year.
Heavy sell-off despite good macro news implies exhaustion on the buy side.
Monthly close towards the end of this week, window dressing/de-risking takes place and increases the sell-side pressure.
Daily bearish structure confirmed with new lower high and lower low set.
So what does this mean for this week? Locating an area on the chart I'd like to see BTC strength from,. For me that would be 1D 200 EMA level at ~$103,000. Since September 2023 BTC has used the 1D 200 EMA as a springboard for each of its rallies and so for this bullrun to continue price must continue to respond positively off the level. The RSI would have likely reached oversold adding confluence to potential Long entries.
In a bullish scenario we could see the weekly low get reclaimed, this has routinely happened in the past and often leads to a test of the midpoint, this would be a good short term play but my gut says the overall higher timeframe (next month) is continued sell-off.

BTC Long (short term high risk)Hi,
I just entered a BTC long, expecting a further upwards move after the indication and pullback.
Hopefully it will short term go to around 119k, but can be a further continuation of the bull trend longterm. But thinking short term in this one, I set a stop loss just below this weekend's pullback low.
Lucky trading!
David.

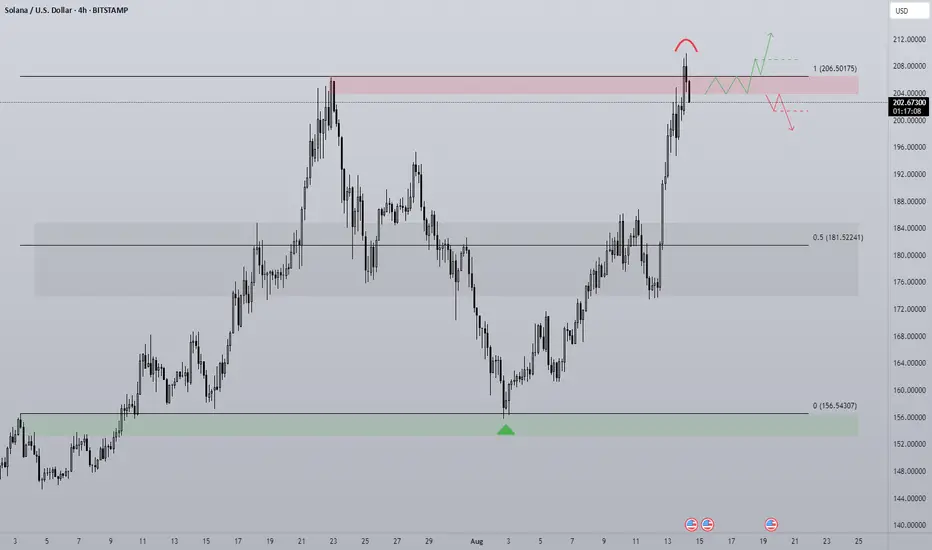
SOL - Breakout or Rangebound?For me this chart is quite simple with two options, a bullish and bearish scenario. SOL is currently rangebound but the massive momentum in the broader market has opened the door to a potential breakout of this trading environment.
To look at the context of the chart we has a clear push from the midpoint up to range high, very little in the way of pullbacks until price breaks up above the old local high. We know that generally stop losses hide behind a key high or low and so price trading into it with such momentum is something to note when entering a trade at this level.
Liquidations for SOL are currently 50:50 long and short and so this balance shows no clear liquidation event in one particular way, at least not yet.
Bullish scenario -
SOL continues the rally above the range, strong volume to confirm that price is ready to expand beyond the area that failed in the past. A retest of $206 with a strong bounce gives this move a higher probability and proof buyers are still willing to buy at the level. Idea is invalid should price accept back below the range high, signifying buyers are not ready to sustain rally continuation.
Bearish scenario -
Price accepts below range high and shows that buyers are not willing to expend beyond the range. Naturally a retreat would then follow as the bears defend the same point that they successfully defended in the past (range high). Any price action that resembles chop within the red box would be a non action area as there is an area of balance giving no clear clue of direction either way.
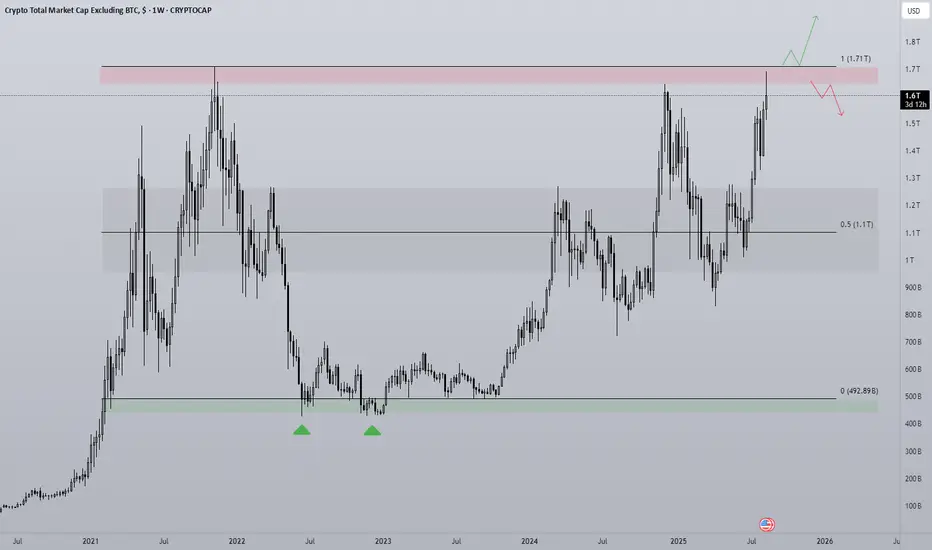
TOTAL2 - Breakout or Rangebound?The altcoin market as a whole has reached a critical point in the cycle. With all time highs in sight the question of what happens next is an important one.
Bullish scenario -
Accumulation under the Range high and a strong break above with volume, that would put TOTAL2 into price discovery and from there just riding the wave until there is a reason not too. Invalidation on the loss of range high.
Bearish scenario -
Clear rejection off the Range high and a break in bullish structure e.g a lower high and lower low on the 4H/1D time frame. This does not include bullish accumulation under the high as that shows coiling for a breakout instead of a loss of momentum.
Paying close attention to the context of the trading environment is key to the execution of the trade as well. Anecdotally the crypto sphere is euphoric with many calling for astronomical gains, posting their trade gain screenshots etc, google searches for coins like Ethereum have sky rocketed. These are all warning signs for me that at least as of now we are due a correction going off of previous cycles. I am by no means bearish on the larger time frame but coming into range high resistance with the market environment the way that it is this needs to be considered in trade execution.
From FOMO to Game Over: The Witch’s Market ProphecyPolitics and market forces are cooking the soup too hot, and greed is on the menu. Investors, funds, and retail traders are ignoring the signs — and just like in the Wild West, only the weapons have changed: stocks, futures, and options. Today, we’ll peek over the witch’s shoulder to see what she sees in the chart’s shadows.
The Setup
This chart shows the market reaching the U-MLH (Upper Median Line Parallel) for the third time. Even this week, the greedy market is nibbling at that level, trying to chew its way higher. The question: does it break through — or break down?
Scenarios
(0) → Price touches the U-MLH for the third time.
Historically, repeated touches can lead to either an explosive breakout or a sharp reversal.
(2) → A momentum kick, driven by FOMO, could push price up to the Warning 1/4 line.
This would be the bulls’ dream run.
(3) → The market reaches the next pitchfork line/deviation — because that’s what markets do.
After that? Only the market gods know.
(4) → Price fails to reach WL1 (Warning Line 1), triggering a Hagopian.
This typically signals a failed breakout and a likely pullback.
Key question: Will U-MLH hold as support?
If not, expect a quick test/retest from below… then it’s Game Over.
(5) → In 80% of cases, the centerline gets tagged as Profit Target 1.
That could be the “logical” next stop.
(6) → L-MLH (Lower Median Line Parallel) — the panic zone.
This is when fear takes over, selling accelerates, and the market feels like the fan just got hit.
Final Word
Whatever happens next, the witch doesn’t care — she’ll be riding her broom into the moonrise, leaving the rest of us to trade the chaos.
#SPX500 #NASDAQ100 #TechnicalAnalysis #Pitchfork #Futures #Options #MarketOutlook #SwingTrading #FOMO

XAU USDxau usd we are expecting kind a move according to our analysis.... right now price is ranging on sideways so we will plan accordingly as per direction which we havr marked

Latest BTCUSDT Update TodayBitcoin surged to an incredible $122,056 by the close of trading on August 11, once again challenging the key resistance level of the world’s leading cryptocurrency. But this isn’t just any number—this is the Fibonacci 1.618% extension, known as the "golden ratio" in technical analysis.
The golden ratio originates from two major market bottoms: the 2018 bear market low and the 2022 bear market low. For those who have tracked Bitcoin through various cycles, these timeframes mark the darkest periods in the history of the cryptocurrency market.
In my view, Bitcoin surpassing new highs is just a matter of time after a month of accumulation. I’ve witnessed strong ETF inflows, more companies buying Bitcoin, and positive remarks from the White House.
While Bitcoin struggles with resistance, Ethereum is on a completely different trajectory. According to TradingView data, ETH has tripled from $1,435 in April to its current price of $4,315.
Bitcoin’s volatility is still near all-time lows, while Ethereum has seen a significant increase. Just a month ago, the market predicted a 5% chance for Ethereum to reach $4,500 in August, but now everything has changed.
Many traders are betting on ETH revisiting its all-time high.
The simultaneous price surge of Bitcoin and Ethereum has pushed the total cryptocurrency market cap to a new record high of $4.14 trillion. This number reflects the strong recovery of the entire blockchain industry after a challenging phase.
With the strong rally this weekend, we expect Bitcoin and Ethereum prices to continue rising, unless there are any tariff shocks.
Will Bitcoin break through and challenge its all-time high? Stay tuned!

DOGEUSD Has reached it's (first?) targetAfter reaching the Centerline, price eitheradvances to the Upper Extreme (U-MLH), or it reverses and it's target is the L-MLH, the lower Extreme of the Fork.
An Open & Close below the Centerline would indicate further progress to the downside.
A stop above the last high with a target around 2 would be the trade I would take.

DOGE Breakout?After a 13 day rally and a 12 day pullback, could DOGE be breaking out and confirming a new 4H trading range?
After a bounce off the bullish orderblock DOGE has broken out of the diagonal downtrend, then pulled back to retest the previous diagonal resistance level as new support. This is a textbook breakout play & retest but this doesn't 100% guarantee the breakout will be successful. Should it be a successful breakout Local Resistance is the first clear level of interest for the bears to fight back.
This type of setup does give a clear invalidation should price fall back into the downtrend with acceptance. A fakeout could also lead to a loss of the Major Support level, that would introduce a potential revisit of $0.166.

Bitcoin Faces Pressure Below $114,000 – What’s Next?Hey crypto community, BINANCE:BTCUSDT continues to face pressure as the price slips below $114,000 during Thursday’s trading session. Although there was an attempt to break through the $116,000 resistance, buying power remains weak, mainly due to diminishing demand from institutional players.
A clear indication of this trend is seen in the ongoing outflows from US-listed Bitcoin ETFs – on Tuesday alone, $196 million was withdrawn, extending the losing streak to four consecutive days.
However, there’s a glimmer of hope from Asia: SBI Holdings in Japan has recently filed for approval of a dual-asset ETF that includes both BTC and XRP. This could be a sign of a fresh wave coming from the East.
On the chart, if BTC fails to reclaim the $114k – $116k range soon, further downside potential remains. But keep in mind, deep corrections often provide an opportunity for large players to accumulate.
👉 What do you think about this correction? Will BTC hold its ground against selling pressure? Let me know your thoughts!

BTCUSD – Heading Towards Lower Support?Hello everyone, what are your thoughts on BTCUSD?
BTCUSD is currently trading around 113,92, moving within a clear downward price channel. It seems like the price could continue to decline as the coin moves toward the lower boundary of the channel.
If conditions remain favorable, I expect 110,000 to be tested in the short term.
What do you think? Do you expect BTCUSD to keep heading lower, or will it bounce back? Let me know your thoughts below!

BTCUSD – bullish momentum is backBitcoin is making a strong comeback, breaking above short-term resistance and reestablishing its uptrend after a prolonged consolidation phase. The technical structure now shows clear control from the bulls, with higher highs and higher lows beginning to form.
Positive risk sentiment and growing expectations of capital flowing back into the crypto space—especially after a series of weak U.S. economic data—are fueling the current BTCUSD rally. If momentum holds, the next target could be the upper boundary of the price channel.
Keep an eye on how price reacts at key levels and trendlines — this might be the launchpad for the next bullish leg.
Good luck, and if you enjoyed this analysis, don’t forget to hit like and drop a comment!

Bitcoin on the edge – Is a sharp drop coming?Bitcoin is keeping investors on edge as price action remains volatile and primed for an explosive move once news or capital flows ignite the market.
🌍 Latest market updates:
– Whales are back in accumulation mode, with on-chain data showing large wallets growing rapidly.
– The U.S. government has just transferred a significant amount of BTC to exchanges — is a dump coming?
– U.S. spot Bitcoin ETFs are witnessing record inflows after CPI came in lower than expected, fueling hopes that the Fed will pause further rate hikes this year.
📉 Technical outlook:
– On the H4 chart, BTC formed a tightening wedge pattern, which has now broken to the downside.
– A steep drop toward the 113,000 to 110,000 USD zone is entirely possible.
This looks like a classic break-retest setup — a golden window for strategic entries. If sell volume surges, it could be the perfect moment for bears to strike.
Stay sharp — and good luck!
The Edge Of The Fork - The Joker In Your PocketWOW!
\ \ First of all, I want to say THANK YOU for all the boosts, follows, and comments. You guys & gals give me the energy to continue this journey with you.\ \
Today, I want to show you that what we’ve learned with horizontal lines can also be applied to "Medianlines," or Forks.
Listen, I don’t want you to blow your brain with all the rules.
Not at the beginning of this journey, and not later on either.
Don’t ask yourself:
* when to use which Fork
* which swing to measure
* when to trade
* where to set your stop
* what if... bla bla bla
That’s not fun — that’s stress.
I don’t like stress — nobody does.
So let’s just chill and have fun here.
That’s my personal reason for doing all this Trading thing. I want to have fun — the money will take care of itself, just like the destination of a trail takes care of itself, as long as I keep putting one foot in front of the other. And that’s simple, right?
So let’s do it exactly the same way.
Just simple steps, connecting some dots, and BAM! — You’re there before you even know it §8-)
\ Let’s jump to the chart:\
Today, you’ll find out why Medianlines/Forks are a cousin of the horizontal Channel — but NOT the same.
Where are they different?
Forks are different because they’re capable of projecting the most probable path of price. And that’s a HUGE difference.
Yes, you can apply the full rule set of Forks to a horizontal Channel.
But the Channel CANNOT project the most probable path of price.
I hear you, I hear you: "No one and nothing can foresee the future. How is it even possible that Forks can?"
\ Here’s why:\
There’s a thing called "Statistical Importance." And it means that if something happens very often in the same way, we have a higher chance of seeing the same behavior again in the future.
And that’s what the inventor, Allan Andrews, discovered — and he created the rules around his findings.
\ A high probability that price will move in the direction of the projected path, as long as it stays within the boundaries of the Medianlines/Fork.\
That’s the whole "magic" behind Medianlines/Forks.
And the same applies to the "Behavior of Price" within and around Medianlines. That’s really all there is to it.
Look at the chart and compare the Channel and the Fork:
1. Price reaches the Centerline about 80% of the time
2. HAGOPIAN → price goes farther in the opposite direction than where it came from
3. HAGOPIAN’s rule fulfilled
4. Price reaches the Centerline again
5. Price reaches the other extreme
6. Price reaches the Centerline about 80% of the time
You’ll see the same behavior inside the Fork!
That’s beautiful, isn’t it? §8-)
And here’s a little Joker in your pocket — if you know the difference between the Channel and the Forks!
Do you know what it is?
Yep! You’d automatically know the direction to trade — giving you another 10% edge right out of the box — LONG TRADES ONLY. Because the Fork projects the most probable path of price to the upside, not down.
That's all folks §8-)
Like this lesson?
With a simple boost and/or a little comment, you load my Battery so I can continue my next step on the trail with you.
Thank you for spending your time with me §8-)
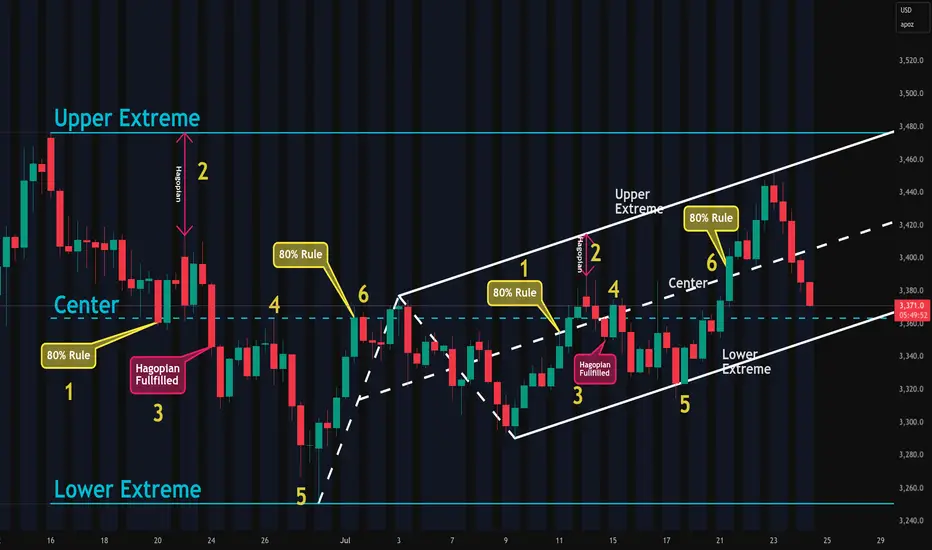
80% Of Time - A Trading Edge You Don't Want To MissDo you want to know why trading with median lines, also known as pitchforks, can be so successful? It’s simple:
Prices swing from one extreme back to the middle.
From the middle, they often swing to the other extreme.
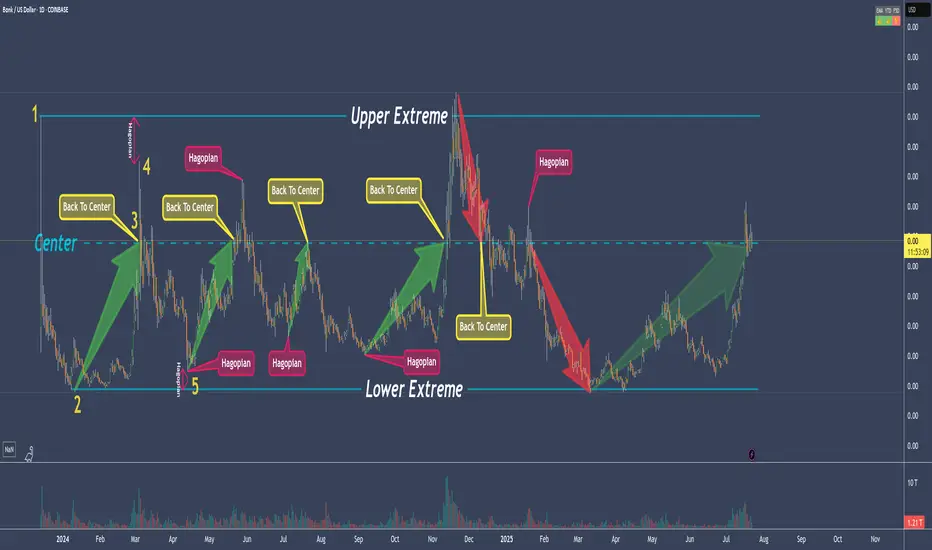
What do we see on the chart?
- The upper extreme
- The center
- The lower extreme
So far, so good.
Now let’s follow the price and learn a few important rules that belong to the rulebook of median lines/pitchforks, and with which you can make great trades.
Point 1
The price starts and is sold off down to…
Point 2
...and from there starts to rise again, up to…
Point 3
...which is the center. And here we have a rule that is very important and one that you need to be aware of in trading to be successful:
THE PRICE RETURNS TO THE CENTER IN ABOUT 80% OF ALL CASES
If we know this, then we can stay in a trade with confidence.
Point 4
The price climbed even higher but missed the upper extreme.
This is the “Hagopian Rule” (named after the man who discovered it).
And the rule goes: If the price does not reach the next line (upper extreme, lower extreme, or center), then the price will continue moving in the opposite direction from where it originally came.
Phew...that’s a mouthful ;-)
But yes, we actually see that the price does exactly this.
From point 4, where the price missed the upper extreme, the price not only goes back to the center but continues and almost reaches the lower extreme!
Now if that isn’t cool, I don’t know what is!
And what do we have at point 5?
A "HAGOPIAN"!
What did we just learn?
The price should go higher than the center line.
Does it do that?
Oh yes!
But wait!
Not only does the Hagopian Rule apply. Remember?
"The price returns to the center line in about 80% of the cases."
HA!
Interesting or interesting?
So, that’s it.
That’s enough for now.
Now follow the price yourself and always consider which rule applies and whether it’s being followed.
How exactly do you trade all this, and what are the setups?
...one step at a time.
Don’t miss the next lesson and follow me here on TradingView.
Wishing you lots of success and fun!
ETHUSD - Decision TimeWhat do make of the current situation?
What if you are long?
Here's what to expect:
a) support at the U-MLH, further advancing up to the WL
b) open & close within the Fork. If so, there's a 95% Chance of price dumping down to the Centerline.
Taking 50% off the table is never bad.
50% money in the pocket if price falls down to the Centerline.
Or if it advances up to the WL, you still have 50% that generates profits.
Either way, you have a winner on your hands.
Don't let it dig into a Looser!

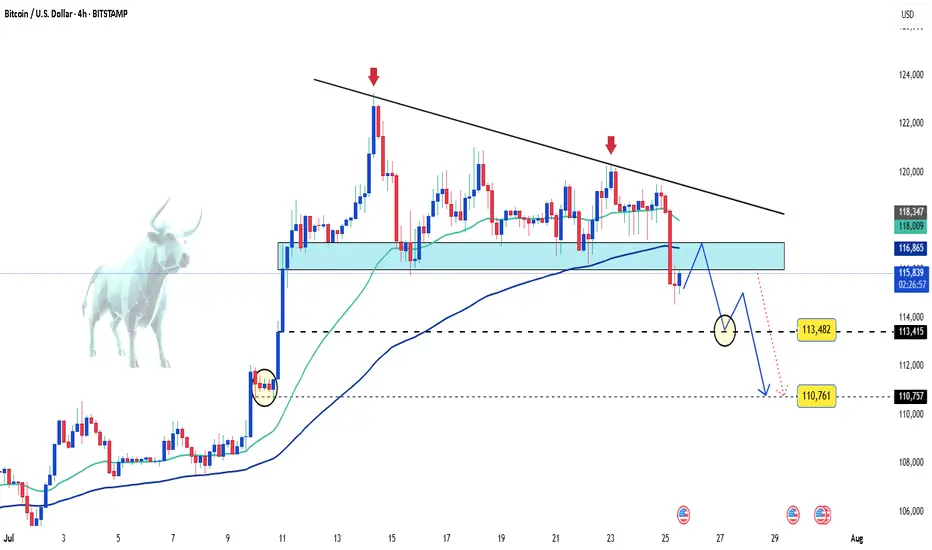
BTCUSDT: A Period of Adjustment and the Next TrendAfter a strong rally to record highs, BTCUSDT is currently entering a period of slight correction. The coin is now trading around 118,500 USD, down more than 0.57% on the day.
From a technical perspective, BTCUSD is moving within a narrowing price wedge, showing a slight downtrend. The support level at 116,500 USD is acting as a springboard for the Bulls. However, as the price approaches the tip of the wedge, a breakout may occur at any time, with two possible scenarios highlighted on the chart.
My personal outlook is that BTCUSDT will continue to decline in the short term before breaking out of the wedge in an upward direction. What do you think about BTCUSDT?
Please share your thoughts in the comments and don’t forget to like this post!
Wishing you all happy and successful trading!
