AUDNZD is Nearing a Strong Support AreaHey Traders, in today's trading session we are monitoring AUDNZD for a buying opportunity around 1.15900 zone, AUDNZD is trading in an uptrend and currently is in a correction phase in which it is approaching the trend at 1.15900 support and resistance area.
Trade safe, Joe.
LONG

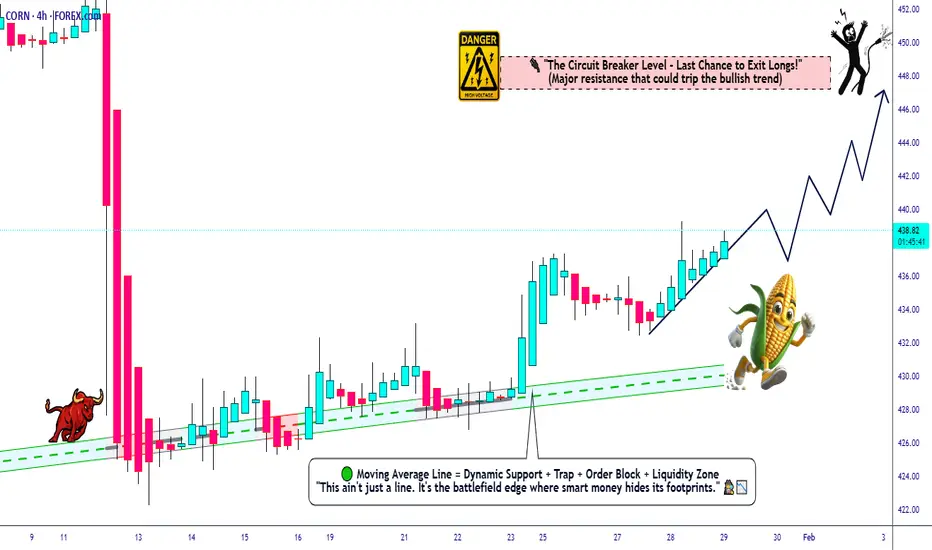
CORN → Bullish Bias Above Key Moving Averages🌽⚡ CORN CFD | High Voltage Breakout Strategy 📊 (Day/Swing Setup)
🎯 TRADE PLAN OVERVIEW
Asset: CORN Futures/CFD (ZC) - Agricultural Commodities Market
Bias: 🐂 BULLISH MOMENTUM ACTIVATED - Multiple MA rejections + pullback structure locked in
Strategy Type: Thief's Multi-Layer Limit Entry System 🥷💰
📍 ENTRY ZONES - THIEF'S STEALTH LADDER METHOD
💎 YOU CAN ENTER AT ANY PRICE LEVEL - But the Thief plays it SMART with layered limits:
Layer 1: 432.00 🎯 (First steal)
Layer 2: 434.00 🎯 (Second steal)
Layer 3: 436.00 🎯 (Third steal)
Layer 4: 438.00 🎯 (Final steal)
This is the THIEF'S STRATEGY METHOD OF ENTRY - Dollar Cost Average like a pro, accumulate on dips, maximize the ride! 🌊💸
⚡ TAKE PROFIT TARGET
TP @ 447.00 🚀🔥
Why this level? HIGH VOLTAGE ELECTRIC SHOCK WALL acting as brutal resistance ⚡🧱 + Overbought zone + Bull trap territory + Correction magnet! Escape with your profits before the shock hits! 💰✨
⚠️ IMPORTANT NOTE: Dear Ladies & Gentlemen (Thief OG's) - I am NOT recommending you set only my TP. It's YOUR choice! You can make money, then take YOUR money at YOUR own risk! Scale out, trail it, or ride - YOU decide! 🎲🔥
🛑 STOP LOSS
Thief's SL @ 430.00 ❌🚨
Clean invalidation below structure support. This is the "game over" line if price breaks below.
⚠️ IMPORTANT NOTE: Dear Ladies & Gentlemen (Thief OG's) - I am NOT recommending you set only my SL. It's YOUR choice! You can make money, then take YOUR money at YOUR own risk! Adjust according to YOUR account size and risk appetite! 🧭💪
🔗 CORRELATED PAIRS TO WATCH 👀
These instruments move together - watch them for confluence signals! 🧬📈
Agricultural Sector:
AMEX:WEAT (Wheat Futures) 🌾 - Direct grain sector correlation | When wheat pumps, corn often follows
AMEX:SOYB (Soybeans) 🫘 - Rotation flows between crops | Farmers switch planting based on prices
AMEX:DBA (Agriculture ETF) 🚜 - Broad sector sentiment barometer | Overall ag market health check
Macro Drivers:
DXY (US Dollar Index) 💵 - INVERSE correlation | Weak dollar = stronger commodity prices (exports cheaper)
NYSE:CL (Crude Oil) 🛢️ - Energy costs impact farming/production | Lower oil = cheaper fertilizer & transport
AMEX:NG (Natural Gas) 🔥 - Fertilizer production costs | Lower gas = better farmer margins
🔑 Key Correlation Play: When DXY drops + Energy stabilizes = 🚀 BULLISH rocket fuel for ag commodities!
📰 FUNDAMENTAL & ECONOMIC FACTORS (Real-Time Analysis)
🌍 Current Market Drivers:
✅ Weather Conditions - U.S. Corn Belt weather patterns critical (drought/flooding = supply shock potential) 🌦️
✅ USD Weakness - Recent dollar softness making U.S. grain exports more competitive on global market 💵📉
✅ China Demand - World's largest grain importer - watch Chinese purchase data closely 🇨🇳
✅ Ethanol Production - ~40% of U.S. corn → ethanol fuel | Crude oil prices directly impact demand ⛽
✅ Fertilizer Costs - Natural gas prices affect production costs (lower = bullish margins) 🌱
✅ Global Food Security - Geopolitical tensions driving strategic grain stockpiling 🌍
📅 Upcoming Economic Events to Monitor:
🔥 USDA Monthly Crop Reports - Supply/demand estimates (MASSIVE market mover!)
🔥 Weekly Export Sales Data - Released every Thursday (shows global demand strength)
🔥 WASDE Report (World Agricultural Supply & Demand) - Major volatility trigger
🔥 Fed Interest Rate Decisions - Impacts dollar strength & commodity capital flows
🔥 EIA Ethanol Production Reports - Shows corn-to-fuel conversion demand
🔥 NOAA Weather Forecasts - Critical for growing season outlook
📊 Current Macro Setup: Moderating inflation + potential Fed pivot + weak dollar environment = favorable conditions for commodity rally! 🎯
THIEF TRADER STYLE - WISHES & MOTIVATION 💎
"The market doesn't reward the greedy, it rewards the strategic. Layer in, scale out, live to trade another day." 🧠💰
📈 TRADE SMART, TRADE SAFE, TRADE LIKE A THIEF!
Drop a 🚀 if you're riding this CORN rocket with me!
Drop a 💎 if you're layering in like a PRO!
Drop a ⚡ if you're ready for that high voltage resistance battle!
Let's get this GRAIN! 🌽🔥
GBPNZD Will Move Higher! Long!
Take a look at our analysis for GBPNZD.
Time Frame: 4h
Current Trend: Bullish
Sentiment: Oversold (based on 7-period RSI)
Forecast: Bullish
The market is trading around a solid horizontal structure 2.276.
The above observations make me that the market will inevitably achieve 2.296 level.
P.S
The term oversold refers to a condition where an asset has traded lower in price and has the potential for a price bounce.
Overbought refers to market scenarios where the instrument is traded considerably higher than its fair value. Overvaluation is caused by market sentiments when there is positive news.
Like and subscribe and comment my ideas if you enjoy them!

CHFJPY Is Bullish! Buy!
Please, check our technical outlook for CHFJPY.
Time Frame: 4h
Current Trend: Bullish
Sentiment: Oversold (based on 7-period RSI)
Forecast: Bullish
The market is on a crucial zone of demand 197.884.
The oversold market condition in a combination with key structure gives us a relatively strong bullish signal with goal 199.265 level.
P.S
Overbought describes a period of time where there has been a significant and consistent upward move in price over a period of time without much pullback.
Like and subscribe and comment my ideas if you enjoy them!

USD/JPY BULLS ARE GAINING STRENGTH|LONG
USD/JPY SIGNAL
Trade Direction: long
Entry Level: 152.456
Target Level: 153.874
Stop Loss: 151.519
RISK PROFILE
Risk level: medium
Suggested risk: 1%
Timeframe: 1h
Disclosure: I am part of Trade Nation's Influencer program and receive a monthly fee for using their TradingView charts in my analysis.
✅LIKE AND COMMENT MY IDEAS✅

Gold Is Breaking Higher — Next Move Depends on Pullback BehavesHello traders,
Gold has just delivered a strong impulsive expansion, lifting price decisively away from the prior consolidation and pushing the market toward new all time highs. The breakout was clean, vertical, and accompanied by clear follow-through a hallmark of initiative buying rather than short-term speculation. This confirms that the broader bullish structure remains firmly in control.
After such an aggressive push, the market is now entering a natural pause phase. This is not a signal of weakness. In strong trends, price rarely moves in a straight line. Instead, it often rotates or pulls back modestly to rebalance liquidity and allow momentum to reset. The projected retracement toward the five thousand one hundred ninety to five thousand one hundred seventy area aligns with prior structural interaction, making it a logical zone for buyers to reassess and defend.
As long as pullbacks remain corrective and contained above the highlighted support zone, the bullish thesis stays intact. Acceptance above this area would favor continuation toward the upper resistance and new ATH region around five thousand four hundred, where price discovery may temporarily slow again. This level should be viewed as a reaction zone, not a guaranteed destination.
Invalidation remains clearly defined. A decisive breakdown below the support zone would disrupt the current structure and shift focus toward a deeper consolidation or corrective phase. Until then, downside moves are best interpreted as part of a healthy trend digestion process.
Gold has already shown its hand. Now patience and structure will determine the next expansion.

What Looks Like Weakness Is Actually Trend RepairHello traders,
Bitcoin is currently trading near eighty-eight thousand nine hundred, following a sharp downside sweep that briefly broke below the prior support zone before being aggressively reclaimed. That breakdown did not transition into acceptance. Instead, price was quickly absorbed and pushed back above support, signaling a failed breakdown and liquidity grab, not the start of sustained bearish control.
The recovery that followed was decisive. Price rotated back into a well-defined ascending channel, reclaiming both structure and directional bias. This behavior is important: strong trends often shake out late sellers before resuming higher. The impulsive rebound from the lows suggests demand stepped in with intent, repairing the structure rather than merely bouncing.
Since reclaiming the channel, price has shifted into a controlled consolidation phase near the mid-channel region. This pause should not be mistaken for rejection. Overlapping candles and reduced volatility indicate acceptance and rebalancing, allowing momentum to reset after the sharp recovery. As long as price continues to hold above the reclaimed support and channel base, the broader bullish structure remains valid.
Looking ahead, the upper boundary of the ascending channel near $91,000 stands out as the next key technical reference. This zone represents a likely reaction area, not a guaranteed target, where price may pause again if reached.
Invalidation remains clear. A sustained loss of the reclaimed support zone and a breakdown back below the channel would challenge the current bullish bias and reopen the door for deeper corrective price action.
For now, the message is straightforward:
The breakdown failed. Structure was reclaimed. Trend repair is in progress let behavior confirm continuation.

Silver Is Digesting the Breakout — Continuation Depends Hello traders, Silver is currently trading near $114.60, following a strong impulsive advance that previously pushed price into all-time high territory. That expansion leg was sharp and initiative-driven, confirming that the broader bullish structure remains intact. Since then, price has transitioned into a controlled pullback and rotation phase, which is a typical response after vertical price discovery.
From a structural standpoint, the recent retracement remains corrective rather than impulsive. Price has pulled back toward the former breakout region around $112.60–$113.00, an area that now acts as a key technical reference. This zone represents short-term balance, where the market is reassessing participation rather than distributing aggressively.
Below current price, the highlighted demand zone around $104.80–$106.50 continues to serve as the major structural support. As long as silver holds above this area, downside moves should be viewed as part of a broader consolidation process, not a trend reversal. Buyers have previously defended this zone with conviction, and it remains the line that separates healthy digestion from structural failure.
On the upside, sustained acceptance above $116.00–$117.00 would signal that the consolidation phase has completed, opening the door for another expansion leg toward the $122.00–$124.00 region, where price may again pause due to profit-taking and liquidity interaction. These levels should be treated as reaction zones, not guaranteed targets.
Invalidation is clear and objective. A decisive breakdown below the $104.80–$106.50 demand zone would disrupt the current bullish structure and shift focus toward a deeper corrective phase.
For now, silver is not breaking down. it is digesting gains.

Gold Compressing Near Resistance Ahead of Potential BreakoutHello traders! Here’s my technical outlook on XAUUSD (3H) based on the current chart structure. Gold has been trading in a strong bullish trend, clearly defined by a rising structure that started after a prolonged consolidation phase. Initially, price moved sideways within a well-marked range, signaling market balance and accumulation. This range acted as a base for the next directional move. Once buyers gained control, XAUUSD broke decisively above the range highs, confirming a shift from consolidation to expansion and triggering a strong impulsive rally. Currently, price is approaching the Resistance Level / Seller Zone around the 5,330–5,350 area. Momentum remains bullish, but the market is showing signs of short-term consolidation near the highs, suggesting a pause after the strong impulse. This behavior is typical after vertical moves, as the market digests gains before deciding on continuation or correction. Importantly, price is still holding above the rising support line and above the Buyer Zone, which keeps the bullish bias intact. My scenario: as long as XAUUSD holds above the Buyer Zone around 5,060–5,100 and continues to respect the ascending channel support, I expect a continuation higher toward the Seller Zone near 5,350 (TP1). A brief corrective pullback into support would be a healthy move within the trend and could provide renewed buying interest. A clean breakout and acceptance above the Seller Zone would confirm further upside continuation and open the door for higher targets. However, a strong rejection from the Seller Zone followed by a breakdown below the rising support line and Buyer Zone would signal a deeper corrective phase. For now, the structure, momentum, and price action continue to favor buyers, with the current consolidation appearing as preparation for the next move, not a reversal. Please share this idea with your friends and click Boost 🚀

#EURJPY , Gonna be sweet with us ?📊 Morning Market Brief | London Session Prep
🔎 Instrument Focus: #EURJPY
⚠️ Risk Environment: High
📈 Technical Overview:
Not a Quality Setup , if it Moves Perfectly will take it , if not .... just let it go
🚀 Trading Plan:
• Need Valid momentum Structure over the POI
• LTF ENTRY NEEDED
• Just and Only for QuickScalp
🧠 Stay updated with real time news and macro events, visit 👉 @News_Ash_TheTrader_Bot
#Ash_TheTrader #Forex #EURUSD #MarketInsight #PriceAction #TradingPlan #RiskManagement #LondonSession #Scalping #Futures #NQ #Gold

Bitcoin Is Trapped Between Supply and Demand Bitcoin is currently trading near $88,900, positioned cleanly between a well-defined demand zone around $86,400–$86,800 and a higher-timeframe resistance zone near $90,800–$91,200. This is not a trending environment yet it is a compression phase, where price is rotating and building liquidity rather than committing to direction.
The recent rebound from the demand zone was technically constructive. Price reclaimed short-term structure and stabilized above the moving average, but upside momentum has remained controlled rather than impulsive. This tells us that buyers are present, but not yet aggressive. At the same time, sellers have failed to push price back into the demand zone, reinforcing the idea of balance and acceptance within the current range.
Structurally, Bitcoin continues to coil between these two key levels. Overlapping candles and reduced volatility signal that the market is absorbing orders, not rejecting price. This behavior often precedes expansion, but direction will only be confirmed once price commits outside the range.
The bullish scenario requires a clean breakout and sustained acceptance above the resistance zone around $90,800–$91,200. If that occurs, the next upside reference shifts toward the $91,900–$92,000 region, where price discovery could accelerate. Until that acceptance is seen, upside attempts remain reactive rather than structural.
On the downside, invalidation is straightforward. A decisive breakdown below the demand zone around $86,400 would invalidate the current compression and shift focus toward a broader corrective phase.
For now, Bitcoin is doing exactly what it should here waiting.
Range defined. Liquidity building. Let price confirm the resolution.

Bitcoin Is Holding Structure — Consolidation, Not Rejection, DefHello traders,
Bitcoin is currently trading around eighty nine thousand one hundred, following a sharp rebound from the lower boundary of a well defined ascending channel. The recovery was impulsive and decisive, signaling strong demand absorption near the highlighted support zone around eighty-seven thousand two hundred. This reaction confirms that buyers are still active at structurally important levels.
Since the rebound, price has transitioned into a controlled consolidation phase below the mid-channel region and the descending EMA. This slowdown should not be interpreted as weakness. After an impulsive recovery, markets often pause to rebalance liquidity and allow late participants to reposition. The overlapping candles and reduced downside follow-through suggest acceptance rather than rejection.
Structurally, the bullish case remains intact as long as price continues to respect the ascending channel and holds above the established support zone. Pullbacks that remain shallow and corrective would favor continuation toward the upper channel boundary near ninety-one thousand, which aligns with a prior technical reference and serves as a potential reaction area, not a guarantee.
Invalidation is clear and objective. A decisive breakdown below the support zone and sustained acceptance outside the channel would challenge the current bullish structure and shift focus toward a deeper corrective phase.
For now, Bitcoin is not breaking down it is pausing with intent.
Structure is respected. Direction will be decided by behavior, not impatience.

EURGBP: Bullish Continuation
The analysis of the EURGBP chart clearly shows us that the pair is finally about to go up due to the rising pressure from the buyers.
Disclosure: I am part of Trade Nation's Influencer program and receive a monthly fee for using their TradingView charts in my analysis.
❤️ Please, support our work with like & comment! ❤️

EURUSD: Bullish Continuation & Long Signal
EURUSD
- Classic bullish setup
- Our team expects bullish continuation
SUGGESTED TRADE:
Swing Trade
Long EURUSD
Entry Point - 1.1916
Stop Loss - 1.1885
Take Profit - 1.1977
Our Risk - 1%
Start protection of your profits from lower levels
Disclosure: I am part of Trade Nation's Influencer program and receive a monthly fee for using their TradingView charts in my analysis.
❤️ Please, support our work with like & comment! ❤️

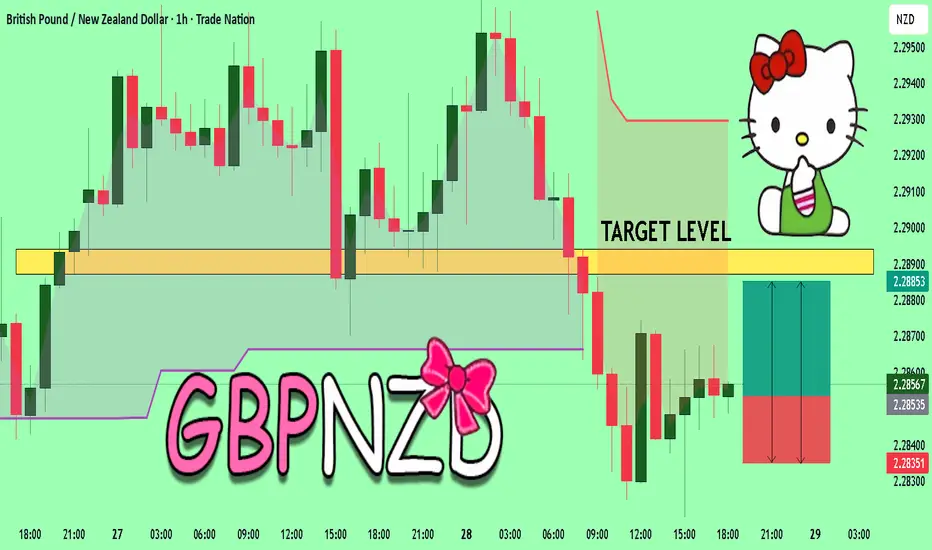
GBPNZD The Target Is UP! BUY!
My dear friends,
My technical analysis for GBPNZD is below:
The market is trading on 2.2852 pivot level.
Bias - Bullish
Technical Indicators: Both Super Trend & Pivot HL indicate a highly probable Bullish continuation.
Target - 2.2887
Recommended Stop Loss - 2.2835
About Used Indicators:
A pivot point is a technical analysis indicator, or calculations, used to determine the overall trend of the market over different time frames.
Disclosure: I am part of Trade Nation's Influencer program and receive a monthly fee for using their TradingView charts in my analysis.
———————————
WISH YOU ALL LUCK
EURCHF: Growth & Bullish Continuation
Looking at the chart of EURCHF right now we are seeing some interesting price action on the lower timeframes. Thus a local move up seems to be quite likely.
Disclosure: I am part of Trade Nation's Influencer program and receive a monthly fee for using their TradingView charts in my analysis.
❤️ Please, support our work with like & comment! ❤️

EURNZD Is Very Bullish! Buy!
Here is our detailed technical review for EURNZD.
Time Frame: 4h
Current Trend: Bullish
Sentiment: Oversold (based on 7-period RSI)
Forecast: Bullish
The market is approaching a key horizontal level 1.983.
Considering the today's price action, probabilities will be high to see a movement to 1.991.
P.S
Overbought describes a period of time where there has been a significant and consistent upward move in price over a period of time without much pullback.
Like and subscribe and comment my ideas if you enjoy them!

EURNZD: Long Trading Opportunity
EURNZD
- Classic bullish formation
- Our team expects pullback
SUGGESTED TRADE:
Swing Trade
Long EURNZD
Entry - 1.9837
Sl - 1.9816
Tp - 1.9885
Our Risk - 1%
Start protection of your profits from lower levels
Disclosure: I am part of Trade Nation's Influencer program and receive a monthly fee for using their TradingView charts in my analysis.
❤️ Please, support our work with like & comment! ❤️

EUR/GBP BULLISH BIAS RIGHT NOW| LONG
Hello, Friends!
EUR/GBP pair is trading in a local downtrend which we know by looking at the previous 1W candle which is red. On the 3H timeframe the pair is going down too. The pair is oversold because the price is close to the lower band of the BB indicator. So we are looking to buy the pair with the lower BB line acting as support. The next target is 0.869 area.
Disclosure: I am part of Trade Nation's Influencer program and receive a monthly fee for using their TradingView charts in my analysis.
✅LIKE AND COMMENT MY IDEAS✅

EURJPY Sellers In Panic! BUY!
My dear followers,
I analysed this chart on EURJPY and concluded the following:
The market is trading on 182.77 pivot level.
Bias - Bullish
Technical Indicators: Both Super Trend & Pivot HL indicate a highly probable Bullish continuation.
Target - 183.96
About Used Indicators:
A super-trend indicator is plotted on either above or below the closing price to signal a buy or sell. The indicator changes color, based on whether or not you should be buying. If the super-trend indicator moves below the closing price, the indicator turns green, and it signals an entry point or points to buy.
Disclosure: I am part of Trade Nation's Influencer program and receive a monthly fee for using their TradingView charts in my analysis.
———————————
WISH YOU ALL LUCK

EUR/AUD LONG FROM SUPPORT
Hello, Friends!
We are going long on the EUR/AUD with the target of 1.718 level, because the pair is oversold and will soon hit the support line below. We deduced the oversold condition from the price being near to the lower BB band. However, we should use low risk here because the 1W TF is red and gives us a counter-signal.
Disclosure: I am part of Trade Nation's Influencer program and receive a monthly fee for using their TradingView charts in my analysis.
✅LIKE AND COMMENT MY IDEAS✅

XAUUSD Long: Consolidation Before the Next Impulsive MoveHello traders! Here’s a clear technical breakdown of XAUUSD (1H) based on the current chart structure. Gold is trading within a strong and well-defined ascending channel, confirming a sustained bullish trend supported by consistent higher highs and higher lows. This structure reflects strong buyer dominance and healthy trend conditions rather than an overextended or exhausted move. Prior to the impulsive rally, price spent a prolonged period consolidating within a range, indicating accumulation and balance between buyers and sellers. This range eventually resolved to the upside, triggering a clean breakout and initiating a strong bullish impulse that pushed price firmly into the ascending channel.
Currently, Gold is pulling back toward a strong Demand Zone around 4,990–5,010, which aligns closely with the lower boundary and midline of the ascending channel. This confluence between horizontal demand and dynamic channel support significantly strengthens the level. The pullback so far appears corrective, with price showing stabilization and buyer reactions near demand, indicating that sellers are losing momentum while buyers continue to defend the broader bullish structure.
My scenario: as long as XAUUSD holds above the demand zone and continues to respect the ascending channel, the bullish structure remains intact. A sustained reaction from this demand area could lead to another bullish leg targeting the 5,150 Supply Zone (TP1). A clean breakout and acceptance above this supply would confirm trend continuation and open the door for further upside expansion within the channel. However, a decisive breakdown and acceptance below the demand zone and channel support would invalidate the bullish bias and signal a deeper corrective phase. For now, structure, trend, and price action continue to favor buyers. Manage your risk!

BTCUSDT Long: Reacts From Demand - Pullback Toward $89,500Hello traders! Here’s a clear technical breakdown of BTCUSDT (2H) based on the current chart structure. Bitcoin previously traded within a well-defined ascending channel, confirming a strong bullish phase with consistent higher highs and higher lows. During this advance, price successfully broke above a key Supply Zone, signaling strong buyer control and triggering a continuation move. After the breakout, BTC entered a consolidation range, reflecting temporary balance and profit-taking before the next expansion. This range eventually resolved to the upside, leading to a sharp impulsive rally that formed a clear pivot high, where selling pressure began to emerge.
Currently, BTCUSDT is trading just above the demand zone after the fake breakdown, indicating that buyers are starting to react and defend this area. The rejection from below demand and stabilization near this level increases the probability of a corrective bounce rather than further impulsive selling. Structurally, this area aligns with prior demand and a key reaction zone, making it critical for the next directional move.
My scenario: After the strong bearish impulse, I expect a corrective pullback to the upside, targeting the 89,500 level (TP1). This level represents previous support turned resistance and is a natural retracement target after a fake breakout from demand. This setup should be treated as a counter-trend corrective move within a broader corrective structure, not a full trend reversal. A clean breakout and acceptance above 89,500 would open the door for a deeper recovery. However, failure to hold above the 87,200 demand zone would invalidate this scenario and increase the probability of further downside continuation. For now, price is at a key reaction area where buyers may attempt to reclaim lost ground. Manage your risk!
