BTCUSD H1 — Support Held, Structure Is RebuildingBitcoin has cleanly defended the 87,200–87,500 support zone after a sharp sell-off, printing a sequence of higher lows that signals short-term structural repair. Price is now grinding higher along a rising trendline, but remains below the declining EMA 98, meaning this move is still corrective until proven otherwise. The key near-term test sits at 88,800–89,000 — a local lower-high resistance and dynamic EMA confluence. A confirmed reclaim and hold above this level would open the path toward 89,700 → 91,000, aligning with prior liquidity and range highs. However, failure to hold the rising trendline or a breakdown back below 87,200 would invalidate the bullish recovery and expose downside toward the 86,000 liquidity pocket.
⚠️ This is not a breakout yet. BTC is deciding whether this bounce becomes continuation or just a relief rally.
LONG

It’s Compressing Between Smart Money Supply & Unfilled Demand🔥 EURUSD H1 — Impulse Complete, Now Trapped Between Supply & Demand
EURUSD has already completed a clean impulsive expansion from the 1.1720 base, leaving a clear inefficiency / demand gap around 1.1835–1.1850. That impulsive leg signals strong participation, but price is no longer in expansion mode. it is now rotating beneath a well defined resistance zone near 1.1895–1.1910, where prior sell-side liquidity and supply are stacked. Structurally, this is post-impulse consolidation, not continuation yet. As long as price fails to reclaim and hold above the resistance zone, upside attempts remain corrective. The most probable path is range rotation: a pullback into the demand gap to rebalance liquidity before the next decision point.
From a technical supply–demand perspective, the demand zone aligns with the origin of the impulse and unmitigated orders, making it the only area where buyers are structurally justified. A clean reaction there keeps bullish structure intact; a failure would expose a deeper mean-reversion toward the rising EMA cluster below.
On the macro side, EURUSD is currently caught between USD rate expectations and Eurozone growth uncertainty. Markets are still pricing sticky U.S. inflation and a “higher-for-longer” Fed bias, which caps EUR upside near resistance. Without a clear macro catalyst (weaker U.S. data or dovish Fed repricing), EURUSD lacks the fuel for immediate breakout — reinforcing the technical expectation of pullback before continuation.
This is not a breakdown, but not a breakout either. EURUSD is compressing between supply and demand. Continuation requires demand hold + resistance reclaim otherwise, price will rotate lower to rebalance before the next macro-driven move.

USDJPY Isn’t Reversing — This Is a Classic Pullback Into Supply FX_IDC:JPYUSD on the H1 is structurally bearish. After a sharp impulsive rally, price failed to hold continuation and transitioned into a clean lower-high sequence, respecting a well-defined descending trendline. Each bounce is getting sold aggressively a textbook sign of distribution, not accumulation. The highlighted GAP zone below current price acts as a magnet for liquidity, and price is compressing toward it with weak bullish follow through, suggesting continuation lower rather than reversal. EMA alignment still favors sellers, and momentum remains corrective inside a broader downtrend.
From a macro perspective, this aligns with persistent USD weakness expectations as rate-cut narratives gain traction, while the Bank of Japan remains sensitive to excessive JPY weakness, keeping intervention risk asymmetric. That macro pressure caps upside and reinforces sell-the-rally behavior.
Bias: Short below trendline
Invalidation: Clean break and acceptance above the descending structure
Expectation: Liquidity sweep into the GAP → continuation lower unless macro sentiment flips
This is not a bottom it’s a pause before the next leg.

GBPCHF What Next? BUY!
My dear friends,
Please, find my technical outlook for GBPCHF below:
The price is coiling around a solid key level - 1.0565
Bias - Bullish
Technical Indicators: Pivot Points Low anticipates a potential price reversal.
Super trend shows a clear buy, giving a perfect indicators' convergence.
Goal - 1.0611
About Used Indicators:
The pivot point itself is simply the average of the high, low and closing prices from the previous trading day.
Disclosure: I am part of Trade Nation's Influencer program and receive a monthly fee for using their TradingView charts in my analysis.
———————————
WISH YOU ALL LUCK

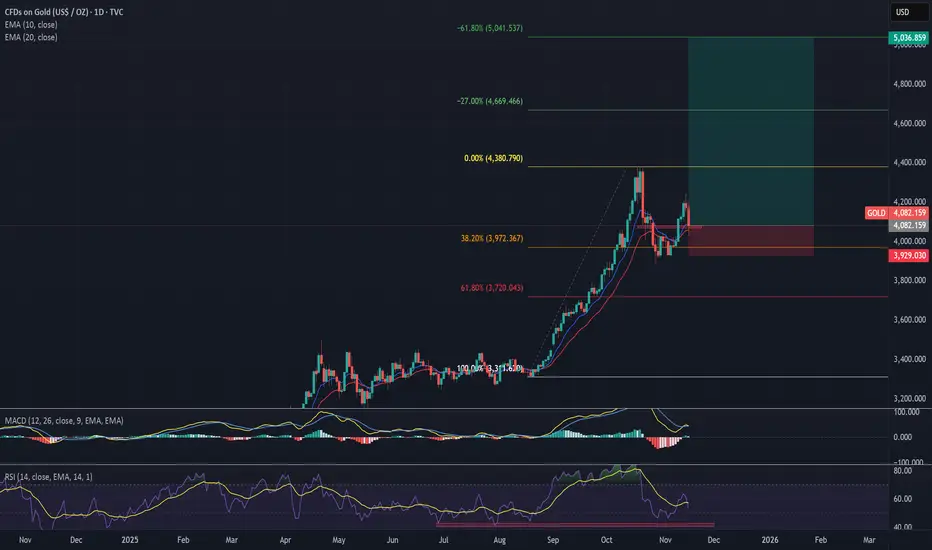
Generational Wealth | Precious Metals Super Cycle | GoldStrategy: Impulse Correction
Direction: Bullish
Moving Average: Blue above Red
Fib Retracement: 38.2 reached
MACD > 0
Support: After a massive sell-off across the board, we will look to see if gold can hold support by bouncing off the moving averages. Lets see if it can find bullish strength and regain the move experienced on Friday. If it moves lower, we could see it going back to 4000, before a potential reversal.
1st Target = 4380
2nd Target = 4669
3rd Target = 5041
Lots: 0.1 (Plan to pyramid into this one)
INSIGHTS: Precious metals continue to show strength with a weakening dollar. Pay attention to the DBC commodity Index which is indicating strength across the commodity complex. Alongside this, the DXY is sitting at an interesting level. Lets see whether will bounce at this level off a multiyear trend or whether the dollar will give way to lower lows in the coming months.
CHFJPY: Bulls Will Push
Remember that we can not, and should not impose our will on the market but rather listen to its whims and make profit by following it. And thus shall be done today on the CHFJPY pair which is likely to be pushed up by the bulls so we will buy!
Disclosure: I am part of Trade Nation's Influencer program and receive a monthly fee for using their TradingView charts in my analysis.
❤️ Please, support our work with like & comment! ❤️

NZDUSD Breakout and Potential Retrace!Hey Traders, in today's trading session we are monitoring NZDUSD for a buying opportunity around 0.58200 zone, NZDUSD was trading in a downtrend and successfully managed to break it out. Currently is in a correction phase in which it is approaching the retrace area at 0.58200 support and resistance area.
Trade safe, Joe.

EURUSD is Nearing an Important Support!Hey Traders, in today's trading session we are monitoring EURUSD for a buying opportunity around 1.18200 zone, EURUSD is trading in an uptrend and currently is in a correction phase in which it is approaching the trend at 1.18200 support and resistance area.
Trade safe, Joe.

GBPJPY Massive Long! BUY!
My dear friends,
My technical analysis for GBPJPY is below:
The market is trading on 210.57 pivot level.
Bias - Bullish
Technical Indicators: Both Super Trend & Pivot HL indicate a highly probable Bullish continuation.
Target - 211.67
About Used Indicators:
A pivot point is a technical analysis indicator, or calculations, used to determine the overall trend of the market over different time frames.
Disclosure: I am part of Trade Nation's Influencer program and receive a monthly fee for using their TradingView charts in my analysis.
———————————
WISH YOU ALL LUCK

USDJPY Technical Analysis! BUY!
My dear friends,
Please, find my technical outlook for USDJPY below:
The instrument tests an important psychological level 153.70
Bias - Bullish
Technical Indicators: Supper Trend gives a precise Bullish signal, while Pivot Point HL predicts price changes and potential reversals in the market.
Target - 154.23
Recommended Stop Loss - 153.39
About Used Indicators:
Super-trend indicator is more useful in trending markets where there are clear uptrends and downtrends in price.
Disclosure: I am part of Trade Nation's Influencer program and receive a monthly fee for using their TradingView charts in my analysis.
———————————
WISH YOU ALL LUCK

ZM - Zoom in on this one...Growing Revenue, chart stabilising...Is NASDAQ:ZM looking to make a serious move to the upside?
Our systems have identified a point of potential interest & volatility in ZM.
If price can hold above $78.21 ... Significant Bullish potential may be unlocked.
If however price falls below $78.21 ... Significant Bearish risk may come into play.
As things sit now, it seems momentum may have turned to the upside for ZM, but will it hold? Let's find out...
We're inspired to bring you the latest developments across worldwide markets, helping you look in the right place, at the right time.
Explore our profile for further updates, and we look forward to being of service along your trading & investing journey!
Disclaimer: Please note all information contained within this post and all other Bullfinder-official Tradingview content is strictly for informational purposes only and is not intended to be investment advice. Past performance is not in any way indicative of future performance. Please DYOR & Consult your licensed financial advisors before acting on any information contained within this post, or any other Bullfinder-official TV content.

CADCHF Will Go Up! Long!
Here is our detailed technical review for CADCHF.
Time Frame: 4h
Current Trend: Bullish
Sentiment: Oversold (based on 7-period RSI)
Forecast: Bullish
The market is approaching a key horizontal level 0.566.
Considering the today's price action, probabilities will be high to see a movement to 0.570.
P.S
The term oversold refers to a condition where an asset has traded lower in price and has the potential for a price bounce.
Overbought refers to market scenarios where the instrument is traded considerably higher than its fair value. Overvaluation is caused by market sentiments when there is positive news.
Like and subscribe and comment my ideas if you enjoy them!

EURUSD: Breakout continuation or bull trap?EURUSD on the H1 timeframe has just delivered a strong impulsive breakout from the prior range, leaving a clear imbalance (GAP) and confirming short-term bullish momentum. Price is now pulling back into the gap zone around 1.1835–1.1845, which is a critical decision area: if this zone holds and shows acceptance, it signals healthy continuation behavior after expansion, opening the path toward the 1.1865 and 1.1890 resistance highs. Structurally, this pullback is corrective momentum remains intact, candles are compressing rather than selling off aggressively, and the broader structure has flipped previous resistance into support. However, failure to hold the gap would invalidate the immediate bullish continuation and expose a deeper retracement toward the main support zone at 1.1750–1.1765, where buyers must defend to maintain the bullish bias.
From a macro perspective, the USD side remains sensitive to upcoming US data and Fed expectations. Any cooling inflation signals or softer US economic data would reinforce USD weakness, supporting EURUSD continuation higher. Conversely, a hawkish repricing of rate expectations or stronger US data could trigger a fake breakout scenario, pushing price back into the prior range. In short, this is not a blind buy zone. it’s a confirmation trade area: hold above the gap favors trend continuation, lose it and the market likely rotates deeper before the next directional move.

ETH bounce = resistance test, not a reversal.On the 1H timeframe, ETH remains structurally bearish despite the sharp rebound from the recent sell-off. Price is still trading below the declining EMA 98, which continues to act as dynamic resistance, aligning closely with the descending trendline a confluence that reinforces seller control. The current bounce shows corrective characteristics: overlapping candles, weak follow-through, and rejection near the 2,880–2,900 zone rather than impulsive continuation. This suggests short-covering and mean reversion, not fresh demand. As long as ETH fails to reclaim and hold above the EMA 98 with strong momentum, the dominant scenario favors another leg down, with downside targets toward 2,838 first and potentially the 2,780–2,800 demand pocket if selling pressure resumes. Only a clean break and acceptance above the EMA 98 would invalidate this bearish continuation bias.

Strong impulse, controlled pullback, and liquidity is setting TICKMILL:EURUSD has just delivered a clean bullish impulse, breaking decisively above prior intraday structure and accelerating into the 1.1880–1.1890 area before pulling back. This move was not random. it was driven by buy-side liquidity expansion after price spent time compressing below 1.1800, where sellers were repeatedly absorbed. Once that liquidity was cleared, the market expanded vertically, leaving behind an inefficient structure and a clear demand zone between 1.1830 and 1.1850. The current pause above this zone is constructive, not weak. Price is no longer trending impulsively, but rotating in a tight range, which signals acceptance above former resistance rather than rejection.
From a structure perspective, the bullish bias remains intact as long as price holds above the 1.1830 demand zone. This area represents the origin of the impulse and is where smart money typically defends long exposure. A controlled pullback into this zone would likely attract fresh buyers, especially as late sellers get trapped expecting a deeper retracement. The projected path higher is logical: first continuation toward 1.1900, followed by 1.1940, and ultimately a new upside target near 1.1975, where buy-side liquidity and prior highs are resting. Importantly, the projected pullbacks in between are healthy. they allow the market to rebalance orders and prevent an exhausted rally.
From a liquidity and market psychology standpoint, this structure favors continuation. Traders who missed the initial breakout are waiting for a retracement to enter long, while short sellers are increasingly uncomfortable above 1.1850. This imbalance often fuels the next expansion leg. On the macro side, EURUSD remains sensitive to U.S. dollar weakness, driven by shifting Federal Reserve rate expectations, U.S. yield compression, and risk-on sentiment. As long as the dollar fails to regain strength, pullbacks in EURUSD are likely to be treated as buy-the-dip opportunities, not trend reversals.
The bullish invalidation is clear and disciplined: a sustained breakdown and acceptance below 1.1830 would signal that the impulse has failed and open the door for a deeper retracement toward 1.1800 and 1.1760. Until that happens, this remains a bullish continuation structure, with demand in control and liquidity pointing higher.
Bias: Bullish above 1.1830
Key demand: 1.1830–1.1850
Upside targets: 1.1900 → 1.1940 → 1.1975
Patience here is rewarded the trend is not finished, it is reloading.

From Panic to Opportunity: Demand Absorption Is Shaping Bitcoin has just completed a textbook liquidity-driven sell-off, followed by a sharp reaction from higher-timeframe demand, and the current structure suggests the market is transitioning from panic to stabilization. After failing to hold below the descending EMA cluster, BTC accelerated lower and swept sell-side liquidity aggressively, flushing late longs and triggering forced liquidations into the 86,000–86,800 demand zone. This move was emotional and fast a classic signature of capitulation, not healthy trend continuation. Immediately after tapping this demand, price reacted strongly, reclaiming intraday structure and pushing back above 88,000, confirming that buyers were waiting below, not absent. From a market structure perspective, Bitcoin is still technically in a broader corrective phase, but the downside momentum has clearly slowed. The impulsive sell-off has transitioned into a higher-low recovery, which tells us that selling pressure is no longer dominant. Price is now attempting to build acceptance above 88,000–88,500, an important equilibrium area inside the prior range. As long as Bitcoin continues to hold above the demand zone and prints higher lows, this recovery should be viewed as a developing corrective leg upward, not a dead-cat bounce.
Looking at liquidity and order flow, the current price action makes sense. Sell-side liquidity below 87,000 has already been taken, and the market now has an incentive to move higher toward buy-side liquidity resting above 89,500, 90,500, and into the major resistance zone near 90,800–91,200. This is where trapped shorts from the breakdown and breakout traders from the previous range have their stops clustered. The projected zigzag path higher reflects how the market typically rebalances — partial pullbacks to trap premature longs, followed by continuation to the next liquidity pool.
From a psychological standpoint, sentiment has just shifted from fear to hesitation. Many traders are still biased bearish after the sharp drop and are selling too early into strength. That hesitation is fuel for continuation. As long as price does not collapse back into the 86,000 demand zone, bears lack follow-through. Meanwhile, dip buyers are becoming more confident, especially as volatility compresses after the sell-off.
On the macro and narrative side, Bitcoin remains sensitive to risk sentiment, U.S. dollar movement, and real yields. Any pause or pullback in the U.S. dollar, combined with stabilization in equity markets, supports further upside relief in BTC. Importantly, this is still a range recovery, not a confirmed macro bull continuation — which means resistance must be respected, especially near the 90,800–91,200 supply zone.
Bullish scenario:
As long as BTC holds above 86,000–86,800, price is likely to continue grinding higher toward 89,500, then 90,500, and potentially a full test of the 90,800–91,200 resistance zone.
Bearish invalidation:
A decisive breakdown and acceptance below 86,000 would signal that demand has failed and open the door for a deeper continuation toward 84,000–82,500.
Bias: Short-term recovery, medium-term range
Key demand: 86,000–86,800
Key resistance: 90,800–91,200
This is not a market to chase emotionally. Bitcoin is doing what it always does after a liquidity sweep reset sentiment, rebuild structure, and hunt the next pool of liquidity.

Liquidity Sweep Complete — ETH Eyes ResistanceEthereum has just completed a classic sell-side liquidity sweep followed by aggressive demand absorption, and the current one-hour structure suggests the market is transitioning from distribution pressure into a corrective recovery phase. The sharp breakdown below prior consolidation was not a sign of trend acceleration, but rather forced liquidation price accelerated lower, sweeping stops and panic sellers into the 2,780–2,820 support zone, where large buyers clearly stepped in. The immediate and impulsive rebound from that area confirms that this zone is not weak support; it is higher-timeframe demand, likely defended by institutions and swing participants. This reaction alone shifts the short-term narrative from continuation lower to mean reversion and rebalancing.
Structurally, Ethereum remains below the descending EMA eighty-nine and under the broader resistance band between 2,980 and 3,020, meaning the higher-timeframe trend is still corrective. However, momentum has changed character. The downside impulse has ended, volatility has compressed after the rebound, and price is now forming higher lows, signaling that sellers are losing control. This is typical behavior after a liquidity purge: the market pauses, rebuilds structure, and seeks the next pool of liquidity above. From a price action standpoint, as long as Ethereum holds above 2,820, the probability favors continued upside probing rather than a full trend continuation lower.
From a liquidity perspective, the move is logical. Sell-side liquidity below 2,800 has already been consumed. With that fuel gone, the market now has incentive to move toward buy-side liquidity clustered above 2,950, 2,980, and into the major resistance zone near 3,000–3,020. That zone represents both previous distribution and trapped breakout longs, making it a natural magnet for price. The projected zigzag path higher reflects how Ethereum typically trades in corrective phases shallow pullbacks to trap early sellers, followed by continuation into the next liquidity pocket.
Psychologically, sentiment is still fragile. Many traders remain bearish after the sharp sell-off and are either shorting too late or exiting longs too early. This hesitation is exactly what allows price to grind higher without strong momentum markets climb walls of doubt. As long as price does not aggressively reclaim below the support zone, bearish conviction lacks confirmation.
On the macro and intermarket side, Ethereum continues to trade as a high-beta risk asset. Stabilization in Bitcoin, combined with a pause in U.S. dollar strength and easing volatility in equities, supports short-term upside relief across crypto. However, this remains a corrective recovery, not a confirmed bullish trend reversal. Until Ethereum can reclaim and hold above 3,020, rallies should be treated as tactical, not structural trend shifts.
Bullish scenario:
Holding above 2,780–2,820 opens the path toward 2,950, then 2,980–3,020, where reaction is expected.
Bearish invalidation:
A clean breakdown and acceptance below 2,780 would signal demand failure and expose 2,650–2,600 next.
Bias: Short-term recovery within a broader corrective structure
Key support: 2,780–2,820
Key resistance: 2,980–3,020
Ethereum has done the hard part it flushed liquidity. What comes next is not emotion, but structure and patience.

CUSD (1H) — The breakdown isn’t the danger. The failed retestOn the 1H timeframe, Bitcoin is playing out a very textbook range–liquidity–breakdown sequence. Price spent a prolonged period consolidating inside a sideways range between 88,200 and 90,250, allowing liquidity to build on both sides of the box. Once that liquidity matured, the market executed a clean breakdown below the 88,200 support, triggering stop-losses from late longs and breakout traders a classic sell side liquidity sweep. The sharp bounce that followed is not bullish by default; it is a natural reaction after liquidity has been consumed. At this stage, the rally should be treated as a relief bounce, not a confirmed trend reversal.
Structurally, the short-term market remains bearish. The EMA is still sloping downward, and price has not yet reclaimed any key resistance. This makes the retest zone between 88,200 and 88,600 the most critical area on the chart. If price rallies into this zone and shows rejection long upper wicks, bearish closes, or increased sell volume. it would confirm that former support has flipped into resistance. In that scenario, the market is likely transitioning into distribution below resistance, with high probability of another leg lower toward the 86,000–86,500 liquidity pocket, where unfilled orders and resting buy-side liquidity are likely sitting below the recent low.
From a liquidity and psychology perspective, this area is extremely sensitive. Traders who were stopped out during the breakdown are now emotionally inclined to sell near breakeven, while aggressive shorts often enter late after the flush. This creates the perfect environment for a failed retest, where sellers regain control and push price lower once again. Conversely, the bullish invalidation is very clear and objective: if Bitcoin reclaims and holds above 88,600, with a strong hourly or four-hour close and a successful retest, then the breakdown would be classified as a false break / stop-hunt. In that case, price could rotate back into the prior range and target 90,250 first, followed by 91,270, and ultimately the higher resistance zone near 93,500.
From a macro standpoint, Bitcoin remains tightly correlated with risk sentiment. Any sudden moves in U.S. dollar strength, bond yields, or Federal Reserve rate-cut expectations can act as catalysts for sharp liquidity-driven moves. During periods of thin liquidity, the market often exaggerates reactions to news, producing wicks designed to trap emotional traders before the real direction unfolds. This is why confirmation at structure levels matters far more than prediction.
Trading plan summary:
– Bearish base case: Look for rejection signals in the 88,200–88,600 retest zone. Failure here favors continuation toward 86,000 and below.
– Bullish invalidation: Only shift bullish if price reclaims and holds above 88,600, opening the path back toward 90,250 → 91,270 → 93,500.
Until that reclaim happens, this market should be treated as a corrective bounce within a bearish structure, not a confirmed reversal. Risk management remains key.

ETHUSD 4H – Downtrend Structure ConfirmedEthereum is firmly in a downtrend market on the H4 timeframe. The aggressive sell-off broke below the key EMA and prior structure support, flipping that area into a resistance zone around ~2,950–3,000. Price is now consolidating below this level, showing weak bullish follow-through and overlapping candles a classic bearish pause, not accumulation.
As long as ETH remains below the EMA and fails to reclaim the resistance zone, the dominant bias stays bearish. Any short-term bounce into resistance is more likely to be a pullback for continuation, not a reversal. The projected path favors another leg lower, targeting the liquidity zone around 2,660–2,620, where buyers may attempt a reaction.
Bias: Bearish
Key resistance: ~2,950–3,000
Downside targets: ~2,660 → 2,620
Invalidation: Strong acceptance back above resistance + EMA reclaim

AUDUSD Strong Bullish Momentum!Hey traders, in today's trading session we are monitoring AUDUSD for a buying opportunity around 0.68800 zone, AUDUSD is trading in an uptrend and currently is in a correction phase in which it is approaching the trend at 0.68800 support and resistance area.
Trade safe, Joe.

$JNJ with a bullish outlook following its earnings #StocksThe PEAD projected a bullish outlook for NYSE:JNJ after a negative over reaction following its earnings release placing the stock in drift A with an expected accuracy of 57%.

GBPJPY : Growth & Bullish Forecast
Balance of buyers and sellers on the GBPJPY pair, that is best felt when all the timeframes are analyzed properly is shifting in favor of the buyers, therefore is it only natural that we go long on the pair.
Disclosure: I am part of Trade Nation's Influencer program and receive a monthly fee for using their TradingView charts in my analysis.
❤️ Please, support our work with like & comment! ❤️

EURCHF: Bullish Forecast & Bullish Scenario
The charts are full of distraction, disturbance and are a graveyard of fear and greed which shall not cloud our judgement on the current state of affairs in the EURCHF pair price action which suggests a high likelihood of a coming move up.
Disclosure: I am part of Trade Nation's Influencer program and receive a monthly fee for using their TradingView charts in my analysis.
❤️ Please, support our work with like & comment! ❤️
