From Panic to Opportunity: Demand Absorption Is Shaping Bitcoin has just completed a textbook liquidity-driven sell-off, followed by a sharp reaction from higher-timeframe demand, and the current structure suggests the market is transitioning from panic to stabilization. After failing to hold below the descending EMA cluster, BTC accelerated lower and swept sell-side liquidity aggressively, flushing late longs and triggering forced liquidations into the 86,000–86,800 demand zone. This move was emotional and fast a classic signature of capitulation, not healthy trend continuation. Immediately after tapping this demand, price reacted strongly, reclaiming intraday structure and pushing back above 88,000, confirming that buyers were waiting below, not absent. From a market structure perspective, Bitcoin is still technically in a broader corrective phase, but the downside momentum has clearly slowed. The impulsive sell-off has transitioned into a higher-low recovery, which tells us that selling pressure is no longer dominant. Price is now attempting to build acceptance above 88,000–88,500, an important equilibrium area inside the prior range. As long as Bitcoin continues to hold above the demand zone and prints higher lows, this recovery should be viewed as a developing corrective leg upward, not a dead-cat bounce.
Looking at liquidity and order flow, the current price action makes sense. Sell-side liquidity below 87,000 has already been taken, and the market now has an incentive to move higher toward buy-side liquidity resting above 89,500, 90,500, and into the major resistance zone near 90,800–91,200. This is where trapped shorts from the breakdown and breakout traders from the previous range have their stops clustered. The projected zigzag path higher reflects how the market typically rebalances — partial pullbacks to trap premature longs, followed by continuation to the next liquidity pool.
From a psychological standpoint, sentiment has just shifted from fear to hesitation. Many traders are still biased bearish after the sharp drop and are selling too early into strength. That hesitation is fuel for continuation. As long as price does not collapse back into the 86,000 demand zone, bears lack follow-through. Meanwhile, dip buyers are becoming more confident, especially as volatility compresses after the sell-off.
On the macro and narrative side, Bitcoin remains sensitive to risk sentiment, U.S. dollar movement, and real yields. Any pause or pullback in the U.S. dollar, combined with stabilization in equity markets, supports further upside relief in BTC. Importantly, this is still a range recovery, not a confirmed macro bull continuation — which means resistance must be respected, especially near the 90,800–91,200 supply zone.
Bullish scenario:
As long as BTC holds above 86,000–86,800, price is likely to continue grinding higher toward 89,500, then 90,500, and potentially a full test of the 90,800–91,200 resistance zone.
Bearish invalidation:
A decisive breakdown and acceptance below 86,000 would signal that demand has failed and open the door for a deeper continuation toward 84,000–82,500.
Bias: Short-term recovery, medium-term range
Key demand: 86,000–86,800
Key resistance: 90,800–91,200
This is not a market to chase emotionally. Bitcoin is doing what it always does after a liquidity sweep reset sentiment, rebuild structure, and hunt the next pool of liquidity.
LONG

Liquidity Sweep Complete — ETH Eyes ResistanceEthereum has just completed a classic sell-side liquidity sweep followed by aggressive demand absorption, and the current one-hour structure suggests the market is transitioning from distribution pressure into a corrective recovery phase. The sharp breakdown below prior consolidation was not a sign of trend acceleration, but rather forced liquidation price accelerated lower, sweeping stops and panic sellers into the 2,780–2,820 support zone, where large buyers clearly stepped in. The immediate and impulsive rebound from that area confirms that this zone is not weak support; it is higher-timeframe demand, likely defended by institutions and swing participants. This reaction alone shifts the short-term narrative from continuation lower to mean reversion and rebalancing.
Structurally, Ethereum remains below the descending EMA eighty-nine and under the broader resistance band between 2,980 and 3,020, meaning the higher-timeframe trend is still corrective. However, momentum has changed character. The downside impulse has ended, volatility has compressed after the rebound, and price is now forming higher lows, signaling that sellers are losing control. This is typical behavior after a liquidity purge: the market pauses, rebuilds structure, and seeks the next pool of liquidity above. From a price action standpoint, as long as Ethereum holds above 2,820, the probability favors continued upside probing rather than a full trend continuation lower.
From a liquidity perspective, the move is logical. Sell-side liquidity below 2,800 has already been consumed. With that fuel gone, the market now has incentive to move toward buy-side liquidity clustered above 2,950, 2,980, and into the major resistance zone near 3,000–3,020. That zone represents both previous distribution and trapped breakout longs, making it a natural magnet for price. The projected zigzag path higher reflects how Ethereum typically trades in corrective phases shallow pullbacks to trap early sellers, followed by continuation into the next liquidity pocket.
Psychologically, sentiment is still fragile. Many traders remain bearish after the sharp sell-off and are either shorting too late or exiting longs too early. This hesitation is exactly what allows price to grind higher without strong momentum markets climb walls of doubt. As long as price does not aggressively reclaim below the support zone, bearish conviction lacks confirmation.
On the macro and intermarket side, Ethereum continues to trade as a high-beta risk asset. Stabilization in Bitcoin, combined with a pause in U.S. dollar strength and easing volatility in equities, supports short-term upside relief across crypto. However, this remains a corrective recovery, not a confirmed bullish trend reversal. Until Ethereum can reclaim and hold above 3,020, rallies should be treated as tactical, not structural trend shifts.
Bullish scenario:
Holding above 2,780–2,820 opens the path toward 2,950, then 2,980–3,020, where reaction is expected.
Bearish invalidation:
A clean breakdown and acceptance below 2,780 would signal demand failure and expose 2,650–2,600 next.
Bias: Short-term recovery within a broader corrective structure
Key support: 2,780–2,820
Key resistance: 2,980–3,020
Ethereum has done the hard part it flushed liquidity. What comes next is not emotion, but structure and patience.

CUSD (1H) — The breakdown isn’t the danger. The failed retestOn the 1H timeframe, Bitcoin is playing out a very textbook range–liquidity–breakdown sequence. Price spent a prolonged period consolidating inside a sideways range between 88,200 and 90,250, allowing liquidity to build on both sides of the box. Once that liquidity matured, the market executed a clean breakdown below the 88,200 support, triggering stop-losses from late longs and breakout traders a classic sell side liquidity sweep. The sharp bounce that followed is not bullish by default; it is a natural reaction after liquidity has been consumed. At this stage, the rally should be treated as a relief bounce, not a confirmed trend reversal.
Structurally, the short-term market remains bearish. The EMA is still sloping downward, and price has not yet reclaimed any key resistance. This makes the retest zone between 88,200 and 88,600 the most critical area on the chart. If price rallies into this zone and shows rejection long upper wicks, bearish closes, or increased sell volume. it would confirm that former support has flipped into resistance. In that scenario, the market is likely transitioning into distribution below resistance, with high probability of another leg lower toward the 86,000–86,500 liquidity pocket, where unfilled orders and resting buy-side liquidity are likely sitting below the recent low.
From a liquidity and psychology perspective, this area is extremely sensitive. Traders who were stopped out during the breakdown are now emotionally inclined to sell near breakeven, while aggressive shorts often enter late after the flush. This creates the perfect environment for a failed retest, where sellers regain control and push price lower once again. Conversely, the bullish invalidation is very clear and objective: if Bitcoin reclaims and holds above 88,600, with a strong hourly or four-hour close and a successful retest, then the breakdown would be classified as a false break / stop-hunt. In that case, price could rotate back into the prior range and target 90,250 first, followed by 91,270, and ultimately the higher resistance zone near 93,500.
From a macro standpoint, Bitcoin remains tightly correlated with risk sentiment. Any sudden moves in U.S. dollar strength, bond yields, or Federal Reserve rate-cut expectations can act as catalysts for sharp liquidity-driven moves. During periods of thin liquidity, the market often exaggerates reactions to news, producing wicks designed to trap emotional traders before the real direction unfolds. This is why confirmation at structure levels matters far more than prediction.
Trading plan summary:
– Bearish base case: Look for rejection signals in the 88,200–88,600 retest zone. Failure here favors continuation toward 86,000 and below.
– Bullish invalidation: Only shift bullish if price reclaims and holds above 88,600, opening the path back toward 90,250 → 91,270 → 93,500.
Until that reclaim happens, this market should be treated as a corrective bounce within a bearish structure, not a confirmed reversal. Risk management remains key.

ETHUSD 4H – Downtrend Structure ConfirmedEthereum is firmly in a downtrend market on the H4 timeframe. The aggressive sell-off broke below the key EMA and prior structure support, flipping that area into a resistance zone around ~2,950–3,000. Price is now consolidating below this level, showing weak bullish follow-through and overlapping candles a classic bearish pause, not accumulation.
As long as ETH remains below the EMA and fails to reclaim the resistance zone, the dominant bias stays bearish. Any short-term bounce into resistance is more likely to be a pullback for continuation, not a reversal. The projected path favors another leg lower, targeting the liquidity zone around 2,660–2,620, where buyers may attempt a reaction.
Bias: Bearish
Key resistance: ~2,950–3,000
Downside targets: ~2,660 → 2,620
Invalidation: Strong acceptance back above resistance + EMA reclaim

AUDUSD Strong Bullish Momentum!Hey traders, in today's trading session we are monitoring AUDUSD for a buying opportunity around 0.68800 zone, AUDUSD is trading in an uptrend and currently is in a correction phase in which it is approaching the trend at 0.68800 support and resistance area.
Trade safe, Joe.

$JNJ with a bullish outlook following its earnings #StocksThe PEAD projected a bullish outlook for NYSE:JNJ after a negative over reaction following its earnings release placing the stock in drift A with an expected accuracy of 57%.

GBPJPY : Growth & Bullish Forecast
Balance of buyers and sellers on the GBPJPY pair, that is best felt when all the timeframes are analyzed properly is shifting in favor of the buyers, therefore is it only natural that we go long on the pair.
Disclosure: I am part of Trade Nation's Influencer program and receive a monthly fee for using their TradingView charts in my analysis.
❤️ Please, support our work with like & comment! ❤️

EURCHF: Bullish Forecast & Bullish Scenario
The charts are full of distraction, disturbance and are a graveyard of fear and greed which shall not cloud our judgement on the current state of affairs in the EURCHF pair price action which suggests a high likelihood of a coming move up.
Disclosure: I am part of Trade Nation's Influencer program and receive a monthly fee for using their TradingView charts in my analysis.
❤️ Please, support our work with like & comment! ❤️

EURNZD: Long Trade with Entry/SL/TP
EURNZD
- Classic bullish pattern
- Our team expects retracement
SUGGESTED TRADE:
Swing Trade
Buy EURNZD
Entry - 1.9854
Stop - 1.9840
Take - 1.9880
Our Risk - 1%
Start protection of your profits from lower levels
Disclosure: I am part of Trade Nation's Influencer program and receive a monthly fee for using their TradingView charts in my analysis.
❤️ Please, support our work with like & comment! ❤️

NZD/JPY LONG FROM SUPPORT
Hello, Friends!
NZD/JPY is trending up which is evident from the green colour of the previous weekly candle. However, the price has locally plunged into the oversold territory. Which can be told from its proximity to the BB lower band. Which presents a beautiful trend following opportunity for a long trade from the support line below towards the supply level of 92.530.
Disclosure: I am part of Trade Nation's Influencer program and receive a monthly fee for using their TradingView charts in my analysis.
✅LIKE AND COMMENT MY IDEAS✅

NZDUSD Outlook | Uptrend Holds at 0.59000 SupportIn today’s trading session, we are closely monitoring NZDUSD for a potential buying opportunity around the 0.59000 zone. NZDUSD remains in a well-established uptrend and is currently undergoing a healthy corrective pullback, approaching a key trendline confluence and the 0.59000 support-turned-resistance area, which may act as a strong demand zone for bullish continuation.
As always, wait for confirmation and manage risk responsibly.
Trade safe,
Joe.

XAUUSD Long: Bullish Trend Intact Below the $5,000 Supply ZoneHello traders! Here’s a clear technical breakdown of XAUUSD (1H) based on the current chart structure. Gold is trading within a well-defined bullish trend, supported by a clean ascending channel that has guided price higher from the lower levels. Earlier in the move, XAUUSD respected the lower boundary of the channel and formed a sequence of higher highs and higher lows, confirming sustained buyer control. During this advance, price entered a consolidation range, signaling temporary balance and accumulation before continuation. This range eventually resolved to the upside, triggering a strong impulsive breakout and accelerating bullish momentum. After the breakout, Gold pushed higher within the ascending channel and approached a major Supply Zone near the psychological 5,000 level. At this area, price showed hesitation and formed a fake breakout above resistance, indicating that sellers were active near the highs. Following this rejection, XAUUSD pulled back toward the mid-lower area of the channel, where previous resistance has now turned into a Demand Zone around 4,870. This zone aligns with channel support and a key structural level, making it an important area for buyer reaction. The recent dip into demand appears corrective rather than impulsive, suggesting a pause within the broader uptrend.
Currently, XAUUSD is trading above the demand zone and remains inside the ascending channel, with buyers defending structure. The market is compressing after the pullback, which often precedes continuation in trending conditions.
My scenario: as long as Gold holds above the 4,870 demand zone and continues to respect the ascending channel, the bullish bias remains intact. A renewed push higher could lead to another test of the 5,000 Supply Zone (TP1). A clean breakout and acceptance above this level would confirm trend continuation and open the door for further upside expansion. However, failure to hold demand and a breakdown below channel support would weaken the bullish setup and signal a deeper corrective phase. For now, structure and momentum continue to favor buyers. Manage your risk!

BTCUSDT: Buyers Defend 88,500 Support, Targeting 90,600 RetestHello everyone, here is my breakdown of the current BTCUSDT setup.
Market Analysis
BTCUSDT is trading within a broader corrective-to-recovery phase after a strong impulsive move earlier. On the left side of the chart, price was capped by a descending triangle resistance line, where multiple breakout attempts occurred, including fake breakouts, before buyers finally gained momentum. This breakout led to a sharp bullish impulse, pushing price into a clearly defined range zone between approximately 94,000 and 98,000, where the market transitioned into consolidation. After spending time ranging, BTC failed to hold the lower boundary of the range, resulting in a strong bearish breakdown and acceleration to the downside. This impulsive sell-off brought price into a key Support Zone around 88,500–88,800, where selling pressure weakened significantly. Buyers stepped in aggressively from this demand area, leading to a sharp rebound and the formation of a new ascending channel, signaling the start of a short-term bullish recovery structure.
Currently, price is respecting the upward channel, forming higher lows and showing gradual bullish pressure. BTC is consolidating just below the Resistance Zone around 90,600, which previously acted as a key level and is now being tested again. Price action near this level suggests compression and potential buildup rather than strong rejection, indicating that buyers are attempting to regain control.
My Scenario & Strategy
My primary scenario remains bullish as long as BTCUSDT holds above the 88,500–88,800 support zone and continues to respect the lower boundary of the ascending channel. A confirmed breakout and acceptance above the 90,600 resistance would validate continuation and open the path toward higher targets within the recovery structure.
However, if price breaks above resistance with momentum, continuation toward the next resistance levels becomes likely. However, if BTC fails to break higher and loses the ascending channel support, a pullback toward the support zone could occur for another potential reaction. A decisive breakdown below the support zone would invalidate the bullish recovery scenario and suggest a deeper continuation of the corrective move. For now, structure favors buyers while support and the ascending channel remain intact.
That's the setup I'm tracking. Thank you for your attention, and always manage your risk.

BTCUSD – Accumulation Below EMA, Expansion Depends on ResolutionBTC is currently trading inside a well-defined accumulation price range after a sharp impulsive sell-off from the higher resistance zone. The aggressive downside move flushed liquidity and pushed price into a demand zone, where selling pressure clearly weakened and price began rotating sideways instead of continuing lower. This sideways behavior is not random — it reflects absorption and balance, not trend continuation.
Structurally, the market is compressed between demand and the mid-range, with overlapping candles and failed follow-through on both sides — a classic accumulation signature. However, price remains below the EMA, meaning the broader short-term bias is still neutral-to-bearish until reclaim occurs. That said, repeated defenses of the demand zone suggest sellers are losing control, and downside momentum is fading.
As long as BTC holds the demand zone, the most likely path is continued range expansion with higher internal highs, eventually targeting the upper boundary of the accumulation range. A clean break and acceptance above the range high would signal bullish expansion, opening the door for a move toward ~90.3k and higher.
Conversely, a decisive breakdown and acceptance below demand would invalidate the accumulation thesis and likely trigger another impulsive leg down as trapped liquidity is released.
BTC is not trending. it’s building energy. The next impulsive move will be dictated by which side of the accumulation range gets reclaimed, not by prediction but by confirmation.

EURUSD H4 — Breakout Area Under TestOn the EURUSD H4 timeframe, price has delivered a strong impulsive rally from the lower support zone, breaking the prior bearish structure and shifting short-term momentum to the upside. However, the market is now reacting around the 1.1670–1.1700 breakout area, which is a critical decision zone. This level represents former resistance turned potential support, and price behavior here will determine continuation versus failure. As long as EURUSD holds above the break level, the structure favors a bullish continuation with upside targets toward 1.1780 and 1.1800, following a higher-high / higher-low sequence. That said, rejection and acceptance back below the break would signal a failed breakout, opening the path for a deeper pullback into the broader H4 support zone around 1.1580–1.1600. In short, this is a textbook break-and-retest phase continuation is possible, but only confirmation above the reclaimed level validates the bullish scenario.

BTC Compresses Inside Accumulation – Breakout or Final Shakeout On the 45-minute chart, Bitcoin is clearly transitioning from an impulsive sell-off into a broad accumulation phase, with price now rotating inside a well-defined range between roughly 88,400–90,400. The sharp downside move into the demand zone near 87,800–88,200 indicated sell-side exhaustion, and the strong reaction from that level confirms that buyers are actively defending lower prices. Since then, price has shifted into sideways behavior, marked by overlapping candles and repeated rejections at both range extremes — classic signs of balance after distribution, not immediate trend continuation.
Structurally, BTC remains below the declining EMA, which tells us that the broader short-term trend is still bearish. However, the failure to make new lower lows, combined with repeated absorption near demand, suggests that selling pressure is weakening. This type of compression often precedes a volatility expansion. As long as price holds above the demand zone, downside follow-through becomes increasingly difficult, favoring range continuation or a base-building process.
From here, two scenarios matter. If price continues to accept above 89,000–89,300 and eventually breaks and holds above the 90,400 range high, the structure shifts into a bullish breakout from accumulation, opening upside targets toward 91,200 → 92,800, where higher-timeframe liquidity sits. Conversely, a clean loss of 88,400 would invalidate the accumulation thesis and expose BTC to another sell-off toward 86,900–86,500.
In summary, Bitcoin is coiling inside accumulation after a completed markdown, with both buyers and sellers temporarily balanced. The market is no longer trending — it is preparing. Until a range break occurs, patience is key, but once expansion begins, the move is likely to be fast and decisive.

EURUSD Rejects Major Supply – Bullish Structure Pauses, PullbackOn the H1 chart, EURUSD is showing clear signs of exhaustion at a higher-timeframe resistance zone around 1.1755–1.1765. The prior move into this area was impulsive and well-supported by EMA alignment, confirming a short-term bullish trend. However, once price reached this supply zone, upside momentum stalled and candles began to compress, signaling seller absorption and profit-taking rather than clean continuation.
Structurally, this is a bullish leg meeting higher-timeframe supply, which often results in a corrective phase. The initial rejection from resistance suggests buyers are no longer aggressive at premium prices. As a result, the market is likely to rotate lower to rebalance liquidity. The most immediate downside magnet sits around 1.1710–1.1720, followed by the 1.1690–1.1700 zone, where prior structure and the EMA cluster converge. These levels are critical for determining whether the trend can sustain higher lows or transitions into a deeper correction.
As long as price remains below the resistance zone, upside attempts should be treated cautiously. A clean break and acceptance above 1.1765 would invalidate the pullback scenario and reopen bullish continuation. Until that happens, the projected path favors choppy corrective price action, potentially forming a lower high before another leg down toward support.
In summary, EURUSD remains bullish on structure, but is currently in a distribution phase at resistance. The bias in the near term favors a pullback rather than immediate breakout, with buyers expected to re-enter only if price holds and reacts cleanly from key support levels below.

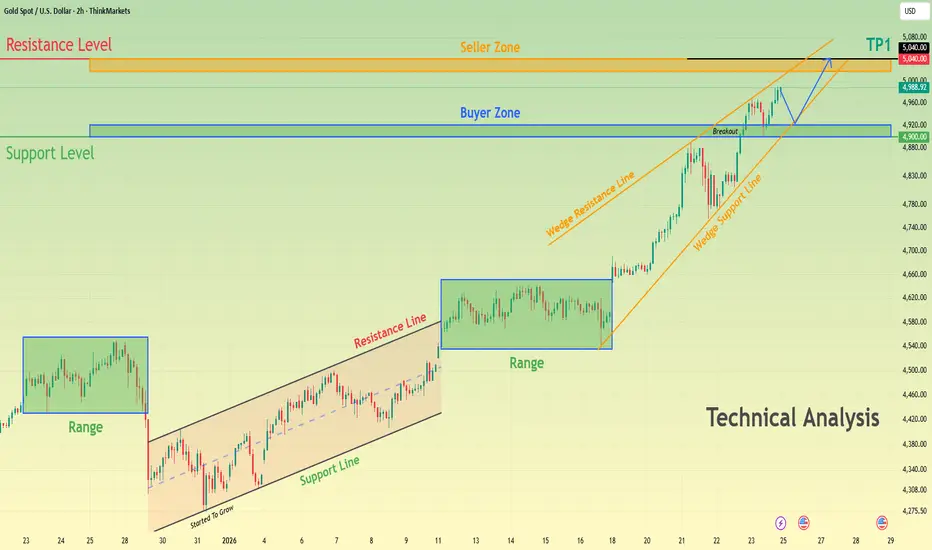
XAUUSD Bullish Structure Intact - $5,040 AheadHello traders! Here’s my technical outlook on XAUUSD (2H) based on the current chart structure. Gold continues to trade within a broader bullish context, maintaining a sequence of higher highs and higher lows. Earlier in the move, price spent a significant amount of time consolidating inside multiple range structures, indicating accumulation before continuation. After breaking out of the most recent range, XAUUSD accelerated higher and respected a rising trend structure, confirming sustained buyer control. This bullish impulse transitioned into a rising wedge formation, where price continued to climb while compressing between the wedge support and resistance lines. During this phase, pullbacks remained corrective, and buyers consistently defended higher support levels. Recently, Gold broke above the key Buyer Zone around the 4,900 level, confirming a successful breakout and acceptance above previous structure. This level has now flipped into support and aligns with the broader Support Level marked on the chart. Price is currently consolidating above this zone while respecting the wedge support line, suggesting continuation rather than exhaustion. Above the market, a well-defined Seller Zone and Resistance Level near 5,040–5,050 stands as the next major obstacle, where profit-taking or selling pressure may emerge. My scenario: as long as XAUUSD holds above the 4,900 Buyer Zone and continues to respect the rising wedge support, the bullish bias remains intact. I expect buyers to maintain control and attempt a continuation toward the 5,040 resistance area (TP1). A clean breakout and acceptance above this Seller Zone would confirm further upside continuation and open the door to new highs. However, a clear rejection from resistance could lead to a short-term pullback toward the Buyer Zone before the next directional move. A decisive breakdown below support would weaken the bullish structure and signal a deeper corrective phase. For now, market structure and momentum continue to favor buyers. Please share this idea with your friends and click Boost 🚀
EUR/CHF SENDS CLEAR BULLISH SIGNALS|LONG
Hello, Friends!
EUR/CHF pair is in the downtrend because previous week’s candle is red, while the price is obviously falling on the 4H timeframe. And after the retest of the support line below I believe we will see a move up towards the target above at 0.926 because the pair oversold due to its proximity to the lower BB band and a bullish correction is likely.
Disclosure: I am part of Trade Nation's Influencer program and receive a monthly fee for using their TradingView charts in my analysis.
✅LIKE AND COMMENT MY IDEAS✅

Bullish Continuation Above Structure, ATH Still the MagnetOn the H1 chart, Gold remains in a clean bullish continuation structure following a strong impulsive expansion. Price has successfully broken above prior resistance and accepted above it, confirming a bullish market shift rather than a fake breakout. The former resistance zone around 4,860–4,880 has now flipped into a well-defined support zone, which is exactly what we want to see in a healthy uptrend.
The pullback currently projected on the chart is corrective in nature, not distributive. As long as price holds above the support zone (~4,870), the bullish structure remains valid. Deeper retracements into the support premium zone (~4,760–4,780) would still be structurally acceptable and offer higher-quality demand reactions, especially with the EMA rising underneath price a sign that momentum is still aligned to the upside.
From a price-action perspective, the market is likely to range briefly or form higher lows, then continue stair-stepping upward. Liquidity is clearly resting above recent highs, making the 5,000 psychological level / new ATH zone the natural upside magnet. Continuation toward that level favors patience over chasing, waiting for pullbacks into structure rather than buying extension candles.
Invalidation:
Only a clean loss and acceptance below the support premium zone would weaken this bullish thesis and open the door for a deeper move toward the lower gap.
Gold is trending, not topping. As long as price respects flipped support, this remains a buy the dip continuation environment, with ATH as the dominant objective, not the ceiling .

Bullish Structure Intact, Pullback = OpportunityOn the H1 timeframe, EURUSD is maintaining a bullish continuation structure after a strong impulsive rally. Price has already shifted market structure to the upside, with higher highs and higher lows clearly established. The recent pause is corrective, not bearish — momentum has slowed, but structure has not broken.
The highlighted demand zone around 1.1675–1.1690 is the key area to watch. This zone aligns cleanly with the rising EMA, reinforcing it as a high-probability reaction area rather than random support. As long as price holds above this demand, the bullish bias remains valid.
From a price-action perspective, the market is likely to pull back into demand, form a higher low, and then continue its upside rotation. Liquidity sits above recent highs, making 1.1764 → 1.1779 the next logical upside objectives. The projected path on the chart reflects a classic impulse–correction–continuation sequence.
Invalidation:
A clean break and acceptance below 1.1663 would weaken the bullish thesis and open the door for a deeper retracement toward the lower demand zone.
This is not a top it’s a pause. EURUSD remains a buy-the-dip structure, favoring patience and confirmation at demand rather than chasing strength near resistance.

“EURUSD Pulls Back — Structure Still Favors the UpsideEURUSD H1 — Bullish Structure Holds, Pullback Is Still Corrective
On the H1 timeframe, EURUSD remains in a bullish market structure, with price continuing to respect the EMA 98 and holding above a clearly defined support zone around the 1.1680–1.1700 region. The previous impulsive rally shifted structure to the upside, and the current price action is best interpreted as a corrective pullback, not a trend reversal.
The recent rejection from the local high near 1.1750–1.1760 shows short-term profit taking, but importantly, the pullback is overlapping and controlled, lacking bearish momentum. This type of retracement typically serves to rebalance liquidity and attract fresh buyers, especially while price remains above both the EMA and the demand/support zone.
As long as the support zone holds, the bullish scenario remains valid. A reaction from this area would likely produce another leg higher, with price targeting a retest of 1.1768, and if that level is broken and accepted, continuation toward higher highs becomes increasingly probable.
However, if price loses acceptance below the support zone and the EMA 98, that would invalidate the bullish continuation thesis and shift focus back to deeper consolidation or a range.
EURUSD is still in a buy the dip environment, not a sell-the-rally market. Bias remains bullish, with continuation dependent on support holding and momentum returning on the next push up.

AUDCHF: Bullish Continuation & Long Trade
AUDCHF
- Classic bullish setup
- Our team expects bullish continuation
SUGGESTED TRADE:
Swing Trade
Long AUDCHF
Entry Point - 0.5382
Stop Loss - 0.5372
Take Profit - 0.5401
Our Risk - 1%
Start protection of your profits from lower levels
Disclosure: I am part of Trade Nation's Influencer program and receive a monthly fee for using their TradingView charts in my analysis.
❤️ Please, support our work with like & comment! ❤️
