ETHUSD: Market of Buyers
The charts are full of distraction, disturbance and are a graveyard of fear and greed which shall not cloud our judgement on the current state of affairs in the ETHUSD pair price action which suggests a high likelihood of a coming move up.
Disclosure: I am part of Trade Nation's Influencer program and receive a monthly fee for using their TradingView charts in my analysis.
❤️ Please, support our work with like & comment! ❤️
LONG

ETHUSD Expected Growth! BUY!
My dear followers,
This is my opinion on the ETHUSD next move:
The asset is approaching an important pivot point 2930.7
Bias - Bullish
Technical Indicators: Supper Trend generates a clear long signal while Pivot Point HL is currently determining the overall Bullish trend of the market.
Goal - 2970.9
About Used Indicators:
For more efficient signals, super-trend is used in combination with other indicators like Pivot Points.
Disclosure: I am part of Trade Nation's Influencer program and receive a monthly fee for using their TradingView charts in my analysis.
———————————
WISH YOU ALL LUCK

BTCUSDT Long: Demand at 88K Could Fuel a Move to $92,700Hello traders! Here’s a clear technical breakdown of BTCUSDT based on the current chart structure. Bitcoin recently completed a prolonged move lower within a well-defined descending channel, confirming strong bearish pressure during that phase. This bearish structure remained intact until price reached a key pivot low, where selling momentum clearly weakened. After the initial impulsive move higher, BTC tested the 92,700 Supply Zone, where temporary rejection occurred. This reaction resulted in several pullbacks toward the 88,000 Demand Zone, which aligns with previous resistance turned support and the lower boundary of the ascending channel. Each pullback into this demand area was met with buying interest, indicating absorption rather than distribution.
Currently, price is stabilizing above the 88,000 Demand Zone, and the pullbacks remain corrective in nature. Multiple minor breakouts along the channel support further confirm that buyers continue to defend structure. The market is consolidating while maintaining bullish alignment.
My scenario: as long as BTCUSDT holds above the 88,000 Demand Zone, the bullish structure remains intact. A strong reaction from this area could lead to another attempt toward the 92,700 Supply / Resistance Zone. A confirmed breakout and acceptance above 92,700 would open the door for further upside continuation within the ascending channel. Only a decisive breakdown below demand would invalidate the bullish scenario. For now, the bias remains bullish, with buyers in control while price respects the ascending channel. Manage your risk!

KRAB - A joke that became a good investmentIm pushing the joke and found something that looks like a rly good investment.
Perfect text book example of accumulation after a downward move (down move not shown on the chart) and a reaccumulation at 0.5 at 11
additional evidences are the pick volume on early 2024 and re accumulation at 11 shown by blue arrows
we are targeting 17 for the next wave up, on 2026 and maybe further up to 21 then
cheers not financial advice

NASDAQ Breakout and Potential RetraceHey Traders, in today's trading session we are monitoring NAS100 fora buying opportunity around 25,450 zone, NASDAQ was trading in a downtrend and successfully managed to break it out. Currently is in a correction phase in which it is approaching the retrace area at 25,450 support and resistance area.
Trade safe, Joe.

ETHUSD Is Bullish! Buy!
Take a look at our analysis for ETHUSD.
Time Frame: 1h
Current Trend: Bullish
Sentiment: Oversold (based on 7-period RSI)
Forecast: Bullish
The market is testing a major horizontal structure 2,924.68.
Taking into consideration the structure & trend analysis, I believe that the market will reach 2,971.06 level soon.
P.S
Overbought describes a period of time where there has been a significant and consistent upward move in price over a period of time without much pullback.
Like and subscribe and comment my ideas if you enjoy them!

USD/JPY(20251224)Today's AnalysisMarket News:
The US economy expanded at a rate of 4.3% in the third quarter, the fastest growth in two years, but the US consumer confidence index declined for the fifth consecutive month.
ADP Weekly Employment Report: In the four weeks ending December 6, 2025, private sector employers added an average of 11,500 jobs per week.
Trump: Those who disagree with him will never become Fed Chair. Next Fed candidate Hassett: Predicts monthly job growth may return to 100,000+, and the Fed is far behind the times on interest rate cuts.
Technical Analysis:
Today's Buy/Sell Threshold:
156.30
Support and Resistance Levels:
157.71
157.18
156.84
155.76
155.42
154.90
Trading Strategy:
If it breaks above 156.30, consider buying, with a first target price of 156.84.
If it breaks below 155.76, consider selling, with a first target price of 155.42.

ETH - 5.6RR idea.BINANCE:ETHUSDT.P
It's a logical idea. We get a short reaction from a short four-hour imbalance. Then, we take all the excess liquidity and move upward.

EURAUD: Bullish Forecast & Bullish Scenario
The price of EURAUD will most likely increase soon enough, due to the demand beginning to exceed supply which we can see by looking at the chart of the pair.
Disclosure: I am part of Trade Nation's Influencer program and receive a monthly fee for using their TradingView charts in my analysis.
❤️ Please, support our work with like & comment! ❤️

GBPAUD: Trading Signal From Our Team
GBPAUD
- Classic bullish formation
- Our team expects growth
SUGGESTED TRADE:
Swing Trade
Buy GBPAUD
Entry Level - 2.0161
Sl - 2.0143
Tp - 2.0191
Our Risk - 1%
Start protection of your profits from lower levels
Disclosure: I am part of Trade Nation's Influencer program and receive a monthly fee for using their TradingView charts in my analysis.
❤️ Please, support our work with like & comment! ❤️

EURCAD On The Rise! BUY!
My dear friends,
Please, find my technical outlook for EURCAD below:
The instrument tests an important psychological level 1.6147
Bias - Bullish
Technical Indicators: Supper Trend gives a precise Bullish signal, while Pivot Point HL predicts price changes and potential reversals in the market.
Target - 1.6159
About Used Indicators:
Super-trend indicator is more useful in trending markets where there are clear uptrends and downtrends in price.
Disclosure: I am part of Trade Nation's Influencer program and receive a monthly fee for using their TradingView charts in my analysis.
———————————
WISH YOU ALL LUCK

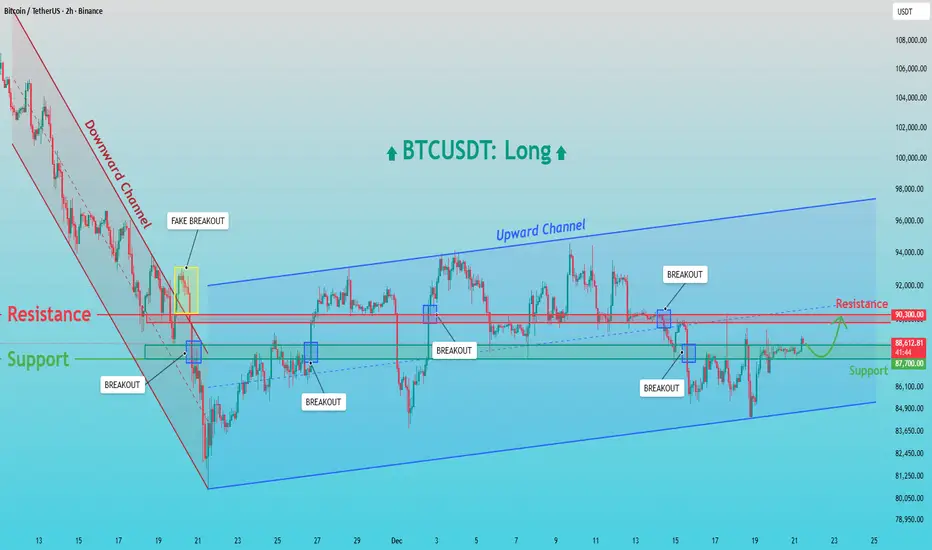
BTCUSDT: Holds Demand - Retest of 90,300 Resistance LikelyHello everyone, here is my breakdown of the current BTCUSDT setup.
Market Analysis
BTCUSDT recently transitioned from a strong downward channel into a broader bullish recovery phase. After a prolonged bearish move, price formed a base near the channel low, where selling pressure weakened. This led to a breakout from the downward channel; however, the first move above resistance resulted in a fake breakout, indicating that sellers were still active at that level. Following this, Bitcoin found strong demand around the 87,000 Support Zone, where buyers stepped in aggressively. From this area, price began to form higher lows and successfully established an ascending (upward) channel, signaling a shift in short-term market structure toward bullish control. Within this upward channel, BTC experienced several clean breakouts above intermediate resistance levels, confirming improving momentum. The key horizontal level around 90,300 acted as a major resistance, where price was rejected multiple times. Despite these rejections, the market did not break down sharply, suggesting absorption of selling pressure rather than distribution.
Currently, BTCUSDT is pulling back toward the 87,000 Support Zone, which aligns with previous resistance turned support and the lower boundary of the upward channel. Price action here remains constructive, with consolidation rather than impulsive selling, indicating that the move lower is corrective.
My Scenario & Strategy
My primary scenario remains bullish as long as BTC holds above the 87,000 support. This zone is a key demand area, and a strong reaction from here could lead to another attempt toward the 90,300 Resistance and a continuation within the upward channel. A confirmed breakout and acceptance above the 90,300 level would open the door for further upside toward higher channel targets.
However, a failure to hold the 87,000 Support Zone would signal weakness and could trigger a deeper correction toward the lower channel boundary. For now, the market structure favors long positions, with support holding and resistance as the next upside objective.
That's the setup I'm tracking. Thank you for your attention, and always manage your risk.
EURNZD: Bullish Continuation is Highly Probable! Here is Why:
Our strategy, polished by years of trial and error has helped us identify what seems to be a great trading opportunity and we are here to share it with you as the time is ripe for us to buy EURNZD.
Disclosure: I am part of Trade Nation's Influencer program and receive a monthly fee for using their TradingView charts in my analysis.
❤️ Please, support our work with like & comment! ❤️

EURJPY Trading Opportunity! BUY!
My dear subscribers,
This is my opinion on the EURJPY next move:
The instrument tests an important psychological level 184.00
Bias - Bullish
Technical Indicators: Supper Trend gives a precise Bullish signal, while Pivot Point HL predicts price changes and potential reversals in the market.
Target - 184.25
My Stop Loss - 183.83
About Used Indicators:
On the subsequent day, trading above the pivot point is thought to indicate ongoing bullish sentiment, while trading below the pivot point indicates bearish sentiment.
Disclosure: I am part of Trade Nation's Influencer program and receive a monthly fee for using their TradingView charts in my analysis.
———————————
WISH YOU ALL LUCK

EURUSD Breakout and Potential RetraceHey Traders, in today's trading session we are monitoring EURUSD for a buying opportunity around 1.17200 zone, EURUSD was trading in a downtrend and successfully managed to break it out. Currently is in a correction phase in which it is approaching the retrace area at 1.17200 support and resistance area.
Trade safe, Joe.

EURCHF Will Grow! Long!
Take a look at our analysis for EURCHF.
Time Frame: 4h
Current Trend: Bullish
Sentiment: Oversold (based on 7-period RSI)
Forecast: Bullish
The market is on a crucial zone of demand 0.929.
The oversold market condition in a combination with key structure gives us a relatively strong bullish signal with goal 0.933 level.
P.S
We determine oversold/overbought condition with RSI indicator.
When it drops below 30 - the market is considered to be oversold.
When it bounces above 70 - the market is considered to be overbought.
Like and subscribe and comment my ideas if you enjoy them!

GBPNZD Will Go Higher From Support! Buy!
Please, check our technical outlook for GBPNZD.
Time Frame: 1h
Current Trend: Bullish
Sentiment: Oversold (based on 7-period RSI)
Forecast: Bullish
The price is testing a key support 2.316.
Current market trend & oversold RSI makes me think that buyers will push the price. I will anticipate a bullish movement at least to 2.323 level.
P.S
Overbought describes a period of time where there has been a significant and consistent upward move in price over a period of time without much pullback.
Like and subscribe and comment my ideas if you enjoy them!

EURUSD Will Move Higher! Long!
Please, check our technical outlook for EURUSD.
Time Frame: 1h
Current Trend: Bullish
Sentiment: Oversold (based on 7-period RSI)
Forecast: Bullish
The market is approaching a key horizontal level 1.171.
Considering the today's price action, probabilities will be high to see a movement to 1.174.
P.S
Please, note that an oversold/overbought condition can last for a long time, and therefore being oversold/overbought doesn't mean a price rally will come soon, or at all.
Like and subscribe and comment my ideas if you enjoy them!

NZDCAD Will Go Up From Support! Buy!
Here is our detailed technical review for NZDCAD.
Time Frame: 4h
Current Trend: Bullish
Sentiment: Oversold (based on 7-period RSI)
Forecast: Bullish
The market is approaching a significant support area 0.791.
The underlined horizontal cluster clearly indicates a highly probable bullish movement with target 0.797 level.
P.S
The term oversold refers to a condition where an asset has traded lower in price and has the potential for a price bounce.
Overbought refers to market scenarios where the instrument is traded considerably higher than its fair value. Overvaluation is caused by market sentiments when there is positive news.
Like and subscribe and comment my ideas if you enjoy them!

AUDUSD Will Go Up! Buy!
Take a look at our analysis for AUDUSD.
Time Frame: 4h
Current Trend: Bullish
Sentiment: Oversold (based on 7-period RSI)
Forecast: Bullish
The market is testing a major horizontal structure 0.662.
Taking into consideration the structure & trend analysis, I believe that the market will reach 0.666 level soon.
P.S
Overbought describes a period of time where there has been a significant and consistent upward move in price over a period of time without much pullback.
Like and subscribe and comment my ideas if you enjoy them!

NZD/CAD BULLS ARE STRONG HERE|LONG
Hello, Friends!
NZD/CAD pair is trading in a local downtrend which we know by looking at the previous 1W candle which is red. On the 4H timeframe the pair is going down too. The pair is oversold because the price is close to the lower band of the BB indicator. So we are looking to buy the pair with the lower BB line acting as support. The next target is 0.797 area.
Disclosure: I am part of Trade Nation's Influencer program and receive a monthly fee for using their TradingView charts in my analysis.
✅LIKE AND COMMENT MY IDEAS✅

EUR/AUD BUYERS WILL DOMINATE THE MARKET|LONG
Hello, Friends!
We are going long on the EUR/AUD with the target of 1.769 level, because the pair is oversold and will soon hit the support line below. We deduced the oversold condition from the price being near to the lower BB band. However, we should use low risk here because the 1W TF is red and gives us a counter-signal.
Disclosure: I am part of Trade Nation's Influencer program and receive a monthly fee for using their TradingView charts in my analysis.
✅LIKE AND COMMENT MY IDEAS✅

EURAUD Will Go Up From Support! Long!
Here is our detailed technical review for EURAUD.
Time Frame: 4h
Current Trend: Bullish
Sentiment: Oversold (based on 7-period RSI)
Forecast: Bullish
The market is trading around a solid horizontal structure 1.768.
The above observations make me that the market will inevitably achieve 1.776 level.
P.S
Please, note that an oversold/overbought condition can last for a long time, and therefore being oversold/overbought doesn't mean a price rally will come soon, or at all.
Like and subscribe and comment my ideas if you enjoy them!
