Waiting for BTC to break out and recover.BTC Trading Plan – Daily Timeframe
BTC is currently in a corrective phase within a larger downtrend, but signs of a potential base formation are emerging.
Key Technical Context
Price is moving inside a descending channel / falling wedge, often a bullish reversal structure if broken to the upside.
The 93.2K level is a critical breakout line. A confirmed daily close above this level would signal a shift in short-term momentum.
The zone around 100K–102K (purple area) is a major supply / resistance, aligning with the descending trendline and EMA resistance.
Strong demand remains at 83.5K–84K, which is the key downside support.
Trading Scenarios
Bullish Scenario
Daily close above 93.2K → continuation toward 100K–102K.
A clean breakout above 102K would open the path back to higher levels and trend reversal confirmation.
Bearish Scenario
Rejection below 93.2K keeps BTC in consolidation.
Breakdown below 83.5K could trigger a deeper drop toward the 79K region.
Longbtcusd

BTC temporary recovery - short term this week📌 BTC Weekly Outlook Update — Plan Remains on Track
Bitcoin continues to follow the expected roadmap with precision. The recent price action confirms a corrective move to the upside before resuming the larger bearish structure.
📍 Current Structure & Price Behavior
BTC has shown a short-term bullish retracement after forming a temporary low. However, the overall outlook remains bearish as price continues to trade below key moving averages and under the major downtrend line.
Price is now heading toward the resistance area between 94,300 and 100,780 USD, where the following confluence exists:
Previous support turned resistance
Fibonacci retracement zone
Trendline rejection zone
Liquidity pool
This area remains the most important zone to watch early this week.
📈 Expected Move — Still Valid
The original plan remains unchanged:
Short-term move upward into the supply zone at 94K → 100K.
Rejection and continuation of the downtrend.
Price targets the Fibonacci 1.618 extension zone at ~80,000 USD.
🎯 Key Target: Fibonacci 1.618 (≈ 80,500 USD)
This level is crucial as it aligns with:
✔ A major demand zone
✔ The 1.618 Fibonacci extension
✔ A deep liquidity sweep level
✔ Potential cycle correction completion
This area is expected to act as the macro support level where buyers step in aggressively.

BTC returns to support zone, bullish reactionBTC/USD Analysis (4H timeframe)
Bitcoin continues to trade within a descending wedge structure, suggesting a potential accumulation phase before a possible bullish breakout. The market is currently reacting near the lower boundary of the pattern, showing signs of support around the 106,300–107,000 zone.
1. Market Structure
Price remains trapped between the wedge’s lower trendline support and the descending upper resistance. Each rejection from the upper boundary has been met with strong buying interest at the lower support, indicating that buyers are still defending this level.
The overall structure shows higher lows forming within the wedge, which could be a bullish signal if confirmed by a strong rebound.
2. Key Support and Resistance Levels
Immediate support: 106,300–107,000
Secondary support: 103,400 (major liquidity zone and previous swing low)
First resistance: 113,800–114,000 (near descending trendline and EMA confluence)
Second resistance: 116,300–116,500 (major breakout zone)
3. EMA Confluence
The 34, 89, and 200 EMAs are currently stacked above price, acting as dynamic resistance. A clean breakout and candle close above these EMAs would confirm a shift in momentum and likely trigger a move toward the 113,800–116,300 targets.
4. Possible Scenarios
Bullish Scenario:
If BTC holds above 106,300 and rebounds with strong bullish candles, price could retest 113,800, followed by 116,300. A breakout above 116,300 would confirm a bullish reversal and open room toward 120,000+.
Bearish Scenario:
A clear breakdown below 106,300 could lead to a deeper retracement toward 103,400 before a possible rebound.

BTC accumulates and starts to recoverBitcoin (BTC/USD) – Daily Analysis
BTC continues to trade within a broad ascending channel, currently rebounding strongly from the key demand zone around 106,000–108,000. This zone has acted as a major liquidity area where buyers have repeatedly stepped in to defend price.
After forming a double rejection at the lower channel boundary, BTC has reclaimed the EMA 34 and is now attempting to stabilize above 110,000, signaling early bullish recovery momentum.
If buyers can maintain price action above 110,000, the next resistance levels to watch are:
113,000–114,000: confluence of EMA 89 + prior structure resistance.
126,000–127,000: upper trendline of the ascending channel and potential medium-term target.
Technical Outlook:
Price respected long-term ascending channel support.
EMAs show potential for a bullish crossover if momentum continues.
Higher low formation supports a recovery scenario.
Bullish Scenario:
Holding above 110,000 would confirm strength, with possible continuation toward 113,000 → 126,000.
Bearish Scenario:
Failure to hold 108,000 could trigger a deeper retracement toward 106,000 or even 102,000 (next demand zone).

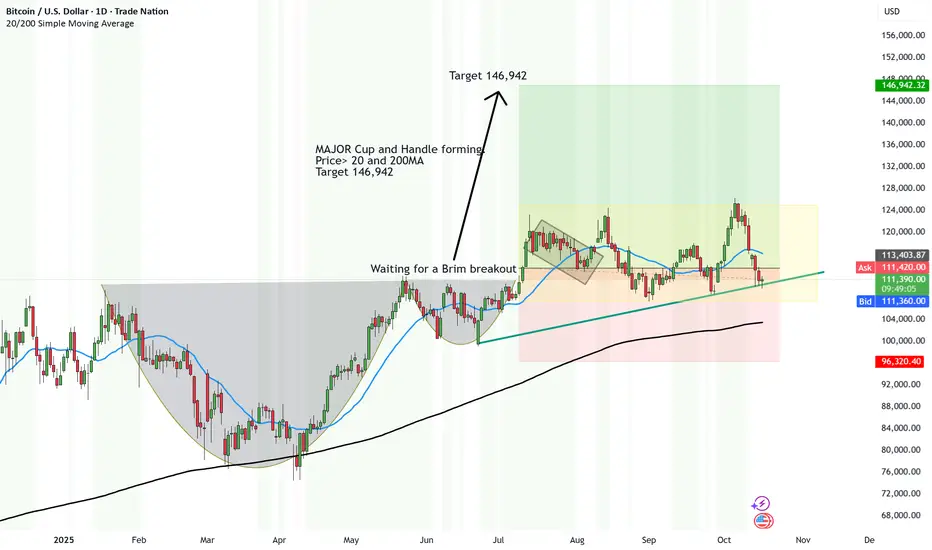
UPDATE: The Brim breakout is loading - but is upside imminent?From our last update with Bitcoin.
We’ve been tracking this MAJOR Cup and Handle for weeks.
We then had the Bitcoin flash crash wiping out 16 big Bs. But if we look at the grander scheme of things, there is nothing new to the movement of the charts.
So we are holding the uptrend for now. And far away from the stop loss level.
We’re now waiting for the brim breakout, which could send BTC straight toward the next big level at $146,942.
If we get a BREAKDOWN then it will have an M Formation which will bring the price lower before it goes up. If it hits the stop loss then there could be a MAJOR crash coming.
But I'll keep you up to date monthly.
🌍 Fundamental Reasons for Upside
🏦 Institutional Inflows:
Big money keeps flowing in through ETFs — Wall Street’s not selling, they’re accumulating.
💰 Halving Tailwinds:
Supply is tightening while demand stays strong — classic post-halving squeeze setup.
🇺🇸 Fed Pause Hopes:
If the Fed holds or cuts rates, risk assets like Bitcoin breathe again.
🪙 Growing Adoption:
Countries, corporates, and funds are treating BTC as digital gold more than ever.
Disclosure: I am part of Trade Nation's Influencer program and receive a monthly fee for using their TradingView charts in my analysis.
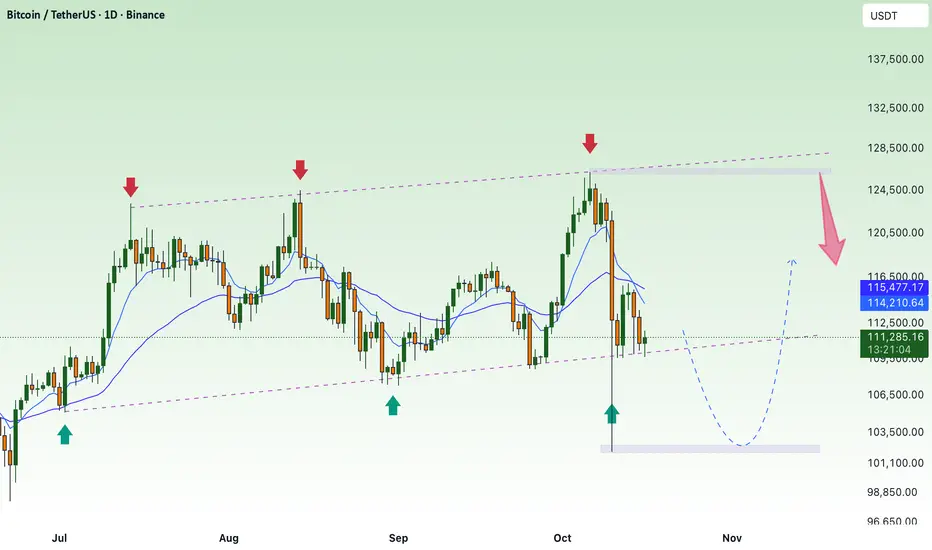
BTC mainly accumulates, remaining force decreasesBTC Technical Analysis (1D Chart)
Bitcoin continues to move inside a rising channel, where the upper trendline has repeatedly acted as strong resistance (around $125,000–126,000), and the lower boundary has held as key support near $108,000.
After the recent rejection at the upper boundary, price has pulled back sharply and is now approaching the support zone at $108,000–108,500, which aligns with:
The bottom trendline of the ascending channel
The 200-day EMA (white line)
A previous reaction zone marked by strong bullish reversals in the past
If the support holds, BTC may see a technical rebound toward the EMA89–EMA34 zone around $114,000–115,000, or even back to the channel resistance near $125,000.
However, if price breaks below $108,000, it would confirm a bearish breakout from the channel, potentially opening the way toward $100,000–102,000.
Key Levels to Watch
Resistance: $114,000 – $115,800 / $125,000 – $126,000
Support: $108,000 – $108,500 (critical zone)
Trend: Neutral to bullish inside channel; bearish breakdown if $108K fails
Positive Market - BTC Continues to Find New ATHBTCUSD Analysis
Bitcoin is currently testing the upper boundary of a long-term ascending channel, where price has previously faced rejection several times (as shown by the red arrows).
The market recently completed a strong rally toward 124K, aligning with the 1.618 Fibonacci extension (123,609) — a significant resistance zone that triggered selling pressure.
Key observations:
• Resistance area: Around 124K–125K, aligning with the upper channel line — potential for short-term correction.
• Support zones: The first support lies near 118,100, followed by 115,000–115,500, both acting as Fibonacci retracement zones.
• Possible scenarios:
1. Price may retrace toward 118K–115K to gather liquidity before another push upward.
2. If the market holds above 123K, a breakout toward 132K–133K could be confirmed.
Overall, momentum remains bullish, but the current zone requires caution — a short-term pullback is likely before the next major move.

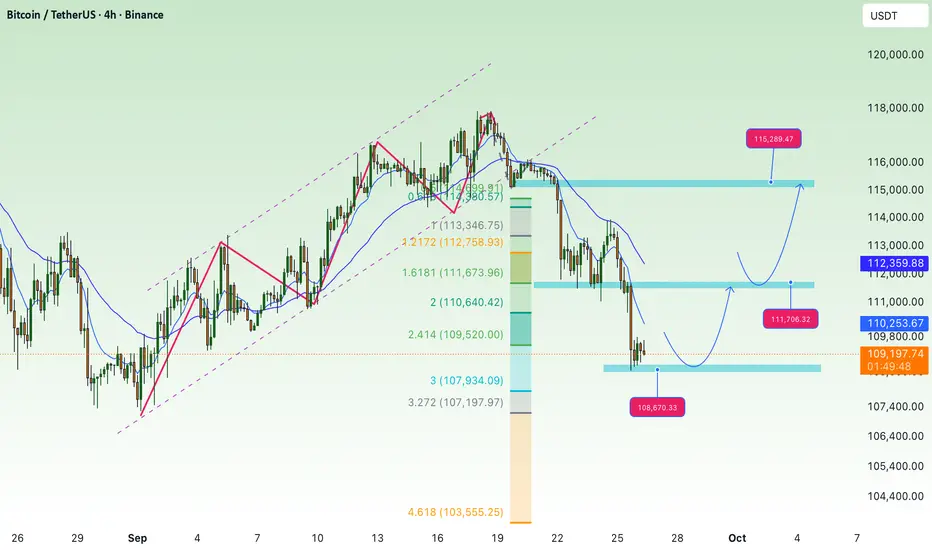
waiting for BTC to recover, accumulate above 107KBTC Technical Analysis (4H Chart):
After breaking down from the rising channel, BTC has confirmed a bearish structure, forming lower highs and lower lows.
Price recently bounced from the 108,800–109,000 support zone, which aligns with the 2.618 Fibonacci extension. This is a key short-term support area to watch.
If buyers can hold this support, BTC may retest the 111,600–111,700 resistance zone. A breakout above could open the path toward the higher resistance at 115,300–115,400.
On the downside, if the 109,000 zone fails, the next bearish targets lie at 105,900 and deeper Fibonacci projections around 104,200–103,100.
Trend Outlook:
Short-term: Possible recovery toward 111,600 or even 115,300 if demand holds above 109,000.
Medium-term: Still bearish-biased as long as price stays under the 200 EMA (~114,000).
Key Levels to Note:
Resistance: 111,600 – 111,700, 115,300 – 115,400
Support: 109,000, 105,900, 104,200 – 103,100
BITCOIN could see a price @ 80,000 in the next couple of weeks.
I know some have written-off Bitcoin at least in 2024. I never did because what you often see on Wall-street when banks and financial institutions have a bad day with their share price, its's the cryptocurrency sector that usually shines.
Bitcoin has been helped along in its price by a head 'n' shoulders pattern on the daily chart & in the past couple of days has pushed higher in it's price considerably. At the moment 60,400.
Bitcoin's 4 year in the making weekly-chart cup 'n' handle pattern is ready to pop, price now only 20% below the neckline.
Now, if the US-Dollar breaks out next week as measured by the USDX-index, and I still have this compulsive urge that it will happen prior to FOMC next Thursday, after which the USD could seriously tank under $1 on an interest rate cut, well I believe that assets like Gold would initially sell-off on an interest rate reduction but I am not so sure about Cryptocurrency, in fact I think it could shine.
Some are saying it's going to sell from here. I see 80,000 in a short space of time.
* My own views and not to be taken as financial advice. At time of writing I have long positions in Bitcoin, ZRXUSD and DOGEUSD.

BTC – Weekly Perspective – 03/03 to 10/03BTC – Weekly Perspective – 03/03 to 10/03
We can say that BTC reached the expected region at 65K, as shown in the previous analysis. I know that this final climb to 65K did not come with the excitement I expected, which would be prices making a correction to the 40K range to continue their climb.
For now, with the objective achieved, the question remains: Where will prices go?
Will we have a 50% correction (up to 40K/42K) of the rise that started at 15.4K in the distant month of November 2022? If the answer is yes, we may have the formation of C&H, a typical strength pattern for any type of asset. What a thing, right?
For the month of March, due to the force imposed by the bulls on the bears, it may be easier for prices to reach the final top region at 69K.
Due to the steeper climb, the "tip" I give is the following; Whoever bought, maintain your position; If you didn't buy it, don't buy it again, simply wait for a correction; but, if you are persistent, and want to buy at any cost, prepare a stop of at least 40% (Lol), as crypto has reached a region of strong struggle in the long term.
The C&H standard is incredible.
Do your analysis and good business.
Be aware, if you buy, use stop loss.
See other graphical analyzes below

BUY BTCUSDReason to enter buy
1. weekly resistance (blue line)
2. weekly demand zone (green zone)
3. confluence resistance & demand zone
4. possible double bottom

Previous Bottom to Top FractalHow crazy would everyone be if the price of bitcoin was still around $26k in December... This fractal plays perfectly into all trend lines that we have been creating...

Long BITCOINit seems BITCOIN is completing another correction.
if it react to fibo cluster in 52000 , it can rise again for first target in 74500 and second target in 88500
note: if it start rising from 57000, targets will be 79000 and 93000

SOPRANO FAMILY MUST GO 70K"Even a broken clock is right twice a day."
Must go to the moon before the end of the month.

BTCUSD - Uptrend is coming backHello every one.
as you see on the chart.
we can see the perfect timeframe for analyzing is daily.
at daily TF, we can see the signal of reversal that comes back to uptrend structure.
with clearly signal, I will place the buy order here & wait for award in the future.
So, whats about you?
Do you believe in this market
bye bye

BTCUSDT IDEAI think we will smash 42K and won't let any bears in for pullbacks. Let's see if this plays out.

long btcusdbuy btcusd. take profit at at least 60k or even above. it all depends on how powerful wave 3 will be. however if you account is small, wait to at least 33.5k and then you can buy from there


LONG TİME FOR BTC I am seeing good scenario for $BTCUSDT
Currently indicators are saying time to long for $BTCUSDT
Thanks for your attention. You can ask everything I am waiting
Please click like button and Appreciate my hard work.
Must follow me for latest crypto real time updates.

buy btcusdlong btcusd... it's just an idea taking minimum profits at 0.5 and 0.618 extensions of wave (3)

btcusd longprevious analysis didn't go as planned so we are switching to a more bigger timeframe to see the key points of the waves. we are buying btcusd with stop loss at 20k. this 20k is a very key price to take note of as wave (1) , also the same as 2017 high . according to elliott wave principles, wave (4) in green cannot overlap with wave (1) in green(2017 high) . hence is wise if that point is set as our stop loss. take profit 1 is 0.618 extension of wave 3 and this price falls around 68k. so we take partial profit or lock profit and see if price can advance to 90k and 120k if it's possible.

BTC 2021 bull run ideaSo this is my btc idea.
Each bull market is shown in a box, starting from when it passed the previous ath finishing at its ath.
The blue arrows show the time it took from mad bear market low to ATH, from second bottom to ath, and how long the full on bull run was (from previous ath to new ath).
So i say we still have about 200 days of full on bull ahead. Making this run end around September. To be safe i am planning to take out major profits by July/August.
If this bull run will be half as strong as the previous ones the target could be 200k $ at + 850% from 2017 ATH

Fibonacci Bands of Bull Market With Data on Alien Planet MarketsPrevious prediction:
Alien markets will be discovered by spring, allocate smartly into digital blockchain industries for the IoT and alien markets, as well as a knowledgeable population about sound money and investing long term.
Credit markets will be exposed (naked shorting) and derivatives will melt down as seen with the #silversqueeze movement and $GME.
This is a great time to be alive, allocate into Sound Money!
