Gold prices consolidate above 5000.⭐️GOLDEN INFORMATION:
Gold price (XAU/USD) extends its upside to around $5,050 during the early Asian session on Tuesday. The precious metal gains momentum amid growing concerns about financial and geopolitical uncertainty. The US ADP Employment Change and Consumer Confidence reports will be published later on Tuesday.
Traders rushed to the safe-haven asset as concern spread that US President Donald Trump is upending relations with key allies, from Europe to Canada. Trump on Saturday threatened to slap 100% tariffs on Canadian goods if the country strikes a trade deal with China, raising fears of a renewed trade war.
⭐️Personal comments NOVA:
Safe-haven assets – gold and silver – continue to surge due to global instability, accumulating and sustaining price increases.
⭐️SET UP GOLD PRICE:
🔥SELL GOLD zone: 5140 - 5142 SL 5147
TP1: $5125
TP2: $5110
TP3: $5085
🔥BUY GOLD zone: 4992 - 4990 SL 4985
TP1: $5008
TP2: $5025
TP3: $5040
⭐️Technical analysis:
Based on technical indicators EMA 34, EMA89 and support resistance areas to set up a reasonable BUY order.
⭐️NOTE:
Note: Nova wishes traders to manage their capital well
- take the number of lots that match your capital
- Takeprofit equal to 4-6% of capital account
- Stoplose equal to 2-3% of capital account
Longs

NZDJPY LONGS 0 NZD/JPY has been making higher highs and higher lows showing a clear uptrend for a number of months.
We can see after last weeks retracement the pair has found support at 91.6 zone - which is also in line with the 100MA on the four hour. This shows a strong level of supports where buyers are ready to re enter the market to push the pair higher hopefully to create its next swing high.
TP1 - 94.017

GBPJPY LONGS - NEXT LEG UPGBPJPY Has found support around the 210.344 expecting buyers to come into the market and push the pair back to previous highs at 214.367 area

GBPCHF LONGS - RANGE TRADEThe pair has revisited the bottom on the range at 1.06005 area highlighting that this support area is holding strong, we can see multiple attempts to try and break lower but buyers come back into the market.
Expecting the trade to revisit last highs with TP1 at 1.07201 and if the bullish momentum holds strong TP2 - 1.07585

CHFJPY LONGS - NEXT LEG UPCHF/JPY has been making higher highs and higher lows showing a clear uptrend for a number of months.
We can see after last weeks retracement the pair has found support at 198.480 zone - which is also in line with the 100MA on the four hour. This shows a strong level of supports where buyers are ready to re enter the market to push the pair higher hopefully to create its next swing high.
TP1 - 201.020

GBPAUD LONGS - RANGE TRADE
GBPAUD has found support at the 2.0000 zone, this is in confluence with the price stabilising above the weekly 100MA.
Given this areas level of strong support I am anticipating buyers to enter the market with TP 1 @ 2.012 & TP2 @ 2.01800 if the range is completed with the expected buy pressue

USDCAD - DOLLAR STRENGTH TO COTINUEst]
We can see the pair has been in a strong upside trend since the start of January
Price has found support at 1.38640 which also is in confluence with the 100MA on the daily time frame, we can see support has held and buyers have potentially resumed in the market to continue this trades uptrend
TP 1: 1.4000
TP 2: 1.40939

Gold prices have adjusted slightly around 4575.⭐️GOLDEN INFORMATION:
Gold (XAU/USD) loses ground after hitting a fresh record high of $4,643 in the previous session, trading around $4,600 per troy ounce on Thursday. The non-interest-bearing Gold lost ground as a stronger-than-expected United States (US) Producer Price Index (PPI) and Retail Sales, along with last week’s easing Unemployment Rate, reinforced the case for the US Federal Reserve (Fed) to keep interest rates on hold for the coming months.
Safe-haven Gold prices also weaken, partly reflecting easing geopolitical concerns. US President Donald Trump said reports indicated Iran’s crackdown-related killings were subsiding and that no large-scale executions were planned, though he did not rule out potential US military action, noting Washington would continue to monitor developments, according to Reuters.
⭐️Personal comments NOVA:
Gold prices are adjusting and consolidating around 4575, but still maintaining an upward trend.
⭐️SET UP GOLD PRICE:
🔥SELL GOLD zone: 4678 - 4680 SL 4685
TP1: $4660
TP2: $4645
TP3: $4630
🔥BUY GOLD zone: 4575 - 4573 SL 4568
TP1: $4588
TP2: $4602
TP3: $4615
⭐️Technical analysis:
Based on technical indicators EMA 34, EMA89 and support resistance areas to set up a reasonable BUY order.
⭐️NOTE:
Note: Nova wishes traders to manage their capital well
- take the number of lots that match your capital
- Takeprofit equal to 4-6% of capital account
- Stoplose equal to 2-3% of capital account

MPLX Due For A 44% RiseWhy do I believe in this trade?
Because, an important price was left behind and is likely to try a retest, the 4th dip on the weekly just occurred, price just formed a new all time low, and because price is down 30%+ from the last high, without a significant rise on the way down.
I am expecting price to rise 44% from 0.0528.

EURNZD RANGE TRADEOn the daily we can see that EURNZD has failed to break support at 2.01787, and buyers have come back into the market.
Expecting the range to trade out with first target at 2.03464 and second target at 2.03996 which would complete the range.

GBPCAD NEXT LEG UP LONG CONTINUATIONIdea linked to last GBPCAD trade idea expecting the pair to trade into my second take profit target at 1.8750

EUR/USD – 30-Minute TF Long Retracement (Before Downside)🟢 EUR/USD – 30-Minute TF Long Retracement (Before Downside)
Looking for a 30-minute timeframe long retracement on EUR/USD before the next move lower. Price is expected to pull back into supply / first, then resume the broader downside move.
Strict risk management applied
⚠️ Disclaimer
This is personal analysis for educational purposes only, not financial advice. Trade responsibly and manage risk.

Gold is accumulating and increasing in price.⭐️GOLDEN INFORMATION:
The latest FOMC Minutes showed that most Federal Reserve officials favor further rate cuts if inflation continues to ease, though divisions remain over the timing and magnitude. Meanwhile, Fed funds futures imply an roughly 82% probability of a rate hold at the January 27–28 meeting, per CME FedWatch. Expectations of lower rates continue to underpin Gold by reducing the opportunity cost of holding the non-yielding asset.
⭐️Personal comments NOVA:
Gold prices continue their upward trend – amid a weakening DXY and caution regarding risky assets at the start of 2026.
⭐️SET UP GOLD PRICE:
🔥SELL GOLD zone: 4544 - 4546 SL 4551
TP1: $4530
TP2: $4515
TP3: $4500
🔥BUY GOLD zone: 4402 - 4400 SL 4395
TP1: $4415
TP2: $4430
TP3: $4445
⭐️Technical analysis:
Based on technical indicators EMA 34, EMA89 and support resistance areas to set up a reasonable BUY order.
⭐️NOTE:
Note: Nova wishes traders to manage their capital well
- take the number of lots that match your capital
- Takeprofit equal to 4-6% of capital account
- Stoplose equal to 2-3% of capital account

USDCHF RANGE TRADE LONGSUSDCHF has been trading in the range highlighted since July it looks like we have found support at the bottom of this and buyers have started the next leg up back to the upper bounds of the range

Exploration of a possible longOn the Daily things look like they are on the rise for ILU. If the 50ema can act as support then and price action can bust through the ICH cloud and see a bit of daylight then a possible long is on the cards. Not financial advise, so it isnt.

US100 / NDX - Bullish setup for 2026. Look at this 12M yearly candle chart of NDX, Text book setup of bullish as per volume and PA. Max volume buyers for the year at bottom 20% of candle, they managed to close the candle as bullish big body hammer. So 2026 - Possible liquidity grab at FVG fill and head higher, so watch out for bigger stocks level NVDA near154, NFLX near 80 an tesla near 380... when all dots connect rocket should fire for huge run of 2026. We don't know where we will close for 2026 at the moment, but there will be good run for upside. Until this dots connect expect choppy action. BTC may also fill 75k level when these dots connect.

Gold prices recovered to around 4400.⭐️GOLDEN INFORMATION:
The minutes from the Federal Open Market Committee’s December 9–10 meeting revealed that most policymakers see scope for additional interest-rate cuts, contingent on inflation continuing to trend lower, though there was less consensus on the timing and magnitude of further easing. Expectations of lower policy rates tend to compress yields and reduce the opportunity cost of holding non-interest-bearing assets, providing a supportive backdrop for Gold.
Beyond monetary policy, elevated geopolitical risks remain a key tailwind. The ongoing Israel–Iran conflict, alongside persistent tensions between the United States and Venezuela, continues to underpin safe-haven demand. In periods of heightened uncertainty, investors typically gravitate toward assets that can preserve value, reinforcing Gold’s role as a traditional store of wealth.
⭐️Personal comments NOVA:
Gold prices are recovering at the beginning of 2026, breaking through the H1 trendline, and are recovering in the Asian session.
⭐️SET UP GOLD PRICE:
🔥SELL GOLD zone: 4443 - 4445 SL 4450
TP1: $4435
TP2: $4420
TP3: $4400
🔥BUY GOLD zone: 4276 - 4278 SL 4271
TP1: $4295
TP2: $4310
TP3: $4330
⭐️Technical analysis:
Based on technical indicators EMA 34, EMA89 and support resistance areas to set up a reasonable BUY order.
⭐️NOTE:
Note: Nova wishes traders to manage their capital well
- take the number of lots that match your capital
- Takeprofit equal to 4-6% of capital account
- Stoplose equal to 2-3% of capital account

QNT 1hr long idea QNT is currently on my active long watchlist, together with other longs I shared earlier.
Price printed a Market Structure Shift (MSS) After the MSS, we now see a healthy retracement back into a key support area.
As long as price holds above support, this zone offers a clean risk-to-reward long setup with upside toward previous highs
Not financial advice. Always manage risk.
👉 Do you think QNT will continue this bullish move, or do you expect a deeper retrace first?

SOLUSDT Demand and SupplyTrading plan = Bearish ( long )
Trading pair = CRYPTOCAP:SOL
Confluence = Demand and Supply
Take Profit = 1st T.P=178.94 2nd T.P=203
Stop loss = Below Demand zone = 94.85
Risk Reward = 1into 2.37

linkusdt Double Bottom Structure BIST:LINK CRYPTOCAP:USDT
The BIST:LINK usdt pair on the 4-hour timeframe has established a bullish double bottom structure, signaling a potential trend reversal. This pattern is confirmed as the price action has broken the previous lower high (the neckline) and subsequently initiated a new move toward a higher high, indicating a shift in market structure from bearish to bullish
⚠️ Disclaimer:
This setup is shared for educational purposes only. It is not financial advice. Always do your own analysis and apply proper risk management before trading any setup

$UPRO Long - My New Favorite ETF - $150+ Long Term TargetAMEX:UPRO is one of those indexes that beats the S&P quite regularly and is a good way to diversify a retirement account or portfolio. In my opinion, it is one of my favorite ETFs out there and may become a new part of my investment strategy, if not already. As always, none of this is investment or financial advice. Please do your own due diligence and research.

AUDNZD at a critical support levelRisky play here but the potential upside is immense. With AUD CPI just dropping hotter at 3.8% vs 3.6% forecast and NZD lowering interest rate, again, this time by 25bps, the liquidity sweep that followed on the pair could be a gift for longs. The RSI is overbought on the daily, and has been due for a correction however fundamentals are screaming for a continuation of the upward move. Currently sitting sitting at a key uptrend support of a large pennant and the daily 50SMA simultaneously. If one were to play this pair, tight SL should be a priority. Anything can happen, nothing is certain.

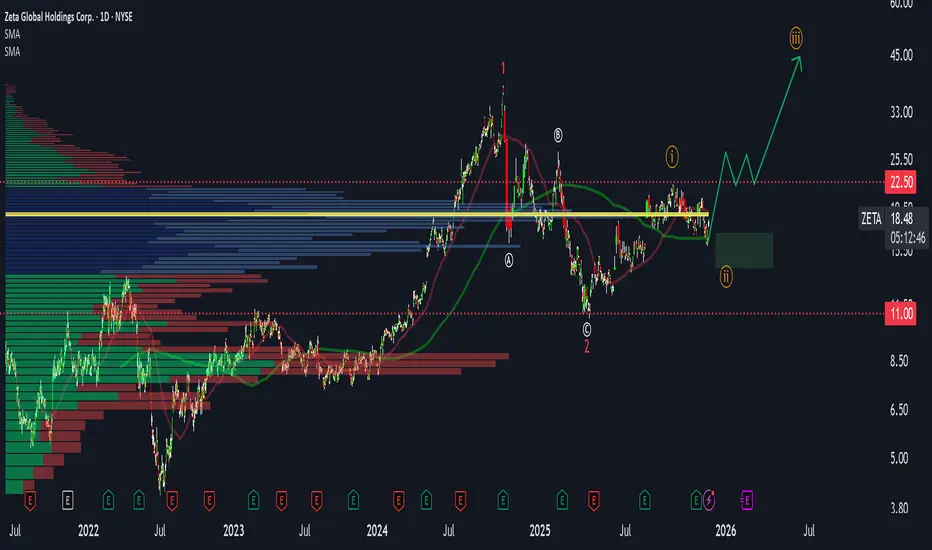
Zeta Global (ZETA) – Strong Fundamental Rebound SetupNYSE:ZETA Fundamental Overview
Zeta Global continues to show strong improvement in fundamentals.
Revenue growth:
From 2021 to 2024 revenue expanded from 360M to 1B, which represents a stable annual growth rate of 25 to 30 percent. This is a solid pace for a company still scaling into profitability.
EPS momentum:
Starting from 2023 EPS began accelerating rapidly. It grew 40 percent in 2023, then 60 percent, and based on quarterly trends 2024 EPS growth is likely to exceed 100 percent.
Quarter over quarter EPS growth from mid 2024 has also been stable at around 25 to 30 percent.
Current EPS is 0.12 and the company is moving closer to full profitability.
Forward valuation:
Forward P/E sits around 18.73 which is attractive considering triple digit EPS growth projections. This suggests that the stock is undervalued relative to forward earnings potential.
Free cash flow:
Free cash flow continues to improve. Historically, when EPS was negative, the stock still traded around 30 dollars. Now with much stronger EPS the stock is only 18 dollars, which highlights a valuation disconnect.
Dilution risk – the main negative factor:
Since 2022 the company has been increasing share count by roughly 2 to 3 percent each quarter.
A major dilution happened in November 2024 when shares increased by roughly 30 percent, which triggered the sharp decline from 30 to 18 dollars. This is currently the main fundamental risk.
Technical Analysis
Price is still inside a broad accumulation range.
Two key volume clusters:
14 to 22 dollars
7 to 9 dollars
Current decline looks like a completed wave 2 correction with early signs of wave 3 formation.
Fibonacci structure:
Wave 2 typically retraces 38 to 62 percent.
The 38 percent level has already been touched, but price can still revisit 13 to 14 dollars which matches the subwave 4 zone of the previous wave 3. This creates a strong confluence support.
Entry and risk management:
Potential entry zone: 13 to 15 dollars
Stop loss: 11 dollars – below this level the structure becomes invalid
Targets:
22.5 dollars – high of wave 1
After breakout of this level: 38 dollars – global wave 1 high
If price holds above 38 dollars after retest, a much larger rally becomes possible as institutional accumulation typically unfolds above the breakout zone.
Conclusion
Zeta Global presents a rare combination of improving fundamentals and a potentially completed corrective structure on the chart. Dilution remains a notable risk, but the valuation gap and strong earnings trajectory create an attractive reward to risk scenario.
I am monitoring the 13 to 15 dollar zone for long entries with targets at 22.5 and 38 dollars.