HP (HPQ) recent selloff shows potential longHello. This is a Macro analysis on HP Inc. (HPQ). I will discuss Technical developments indicating oversold conditions from its recent DECLINE in price. Aim of this is educational in purpose.
I will use price action, candlestick patterns, indicators and more to bring up the idea that there is potential trade opportunity here.
Firstly, I started this analysis at 1 Month timeframe. It was to capture the full picture of price history with Major Supports and Resistance areas.
1 Month is important in this case as major macro developments maybe occuring for HP
Price history for HP is that we wicked to a high of around $37.70 in Nov. 2024 and since then have been in a price DECLINE.
May 2024 was the start of HP to attempt to break above the MAJOR resistance zone of roughly $34.00 - $38.00.
But it failed and hence has been titled Major Resistance.
We also attempted in Dec. 2021 to June 2022 but failed which was the first attempt.
This current Decline in price however has me observing HP because its a Macro move of 2 + years. In my opinion im thinking potential bounce in Price can occur. We just need to determine whether that time is now.
There are 2 Major Support trendlines highlighted. We need to determine whether the Horizontal Support trendline is strong enough for price to bounce here or if we move back down to the uptrending Support trendline.
Note also The Major Resistance Horizontal trendline combined with the Major Support Horizontal trendline forms a Rectangle pattern, also known as Consolidation.
After its move from $20.00 to roughly $37.00 HP is consolidation and building market structure.
One way to look at it is to consider 2 buy zones. One now and another if price action touches the uptrending Major Support line at roughly $18.00.
Note also that this is 1 Month timeframe, and current monthly close is at the end of January so this current candle can still sell off. We need to assess and look for candle confirmations in the coming months.
We also need to analyze the lower timeframes to see if any significant signs are showing that could influence the macro picture.
Tune in for more evidence and analysis as HP continues this current move.
Longsetup

Roblox (RBLX) Macro oversold conditions + trade potentialHello. This is a Macro analysis on Roblox (RBLX). I will discuss Technical developments indicating oversold conditions from its recent DECLINE in price. Aim of this is educational in purpose.
I will use price action, candlestick patterns, indicators and more to bring up the idea that there is potential trade opportunity here.
Firstly, notice the timeframe of 1 week. I personally love to start here. Than move up timeframes and lastly check down timeframes to 1 Day when i actually want to take a trade.
Notice we hit a HIGH of roughly $140.00 and stayed around here between Summer 2025 to September.
Once Fall hit, we began a Price DECLINE of roughly -48%, bringing us to current price action. It is due to the Major resistance trend line highlighted in chart.
We hit Major Support at around $71.00 and bounced up this week roughly +13%.
Note however this weekly candle hasnt CLOSED yet.
We need to watch closely what this week does. And observe whether this $71.00 level holds or not. Usually we'd like to see a few weeks of solid candles to print ABOVE.
We also need to see how Price interacts with Resistance trendline. Watch for potential breakout and confirmation.
This recent price decline is a relatively sharp decline in my opinion. Which warrants the thinking that it may not be sustainable with potential price bounce in the horizon. As seen this week. BUT we need to make sure whether the bounce will continue upward or if it will fake us out and continue down. It is always important to base actions on the facts in the charts ONLY. Never let emotions take over.
Tune in for more evidence and analysis as RBLX continues this current price move.

Gold prices have adjusted slightly around 4575.⭐️GOLDEN INFORMATION:
Gold (XAU/USD) loses ground after hitting a fresh record high of $4,643 in the previous session, trading around $4,600 per troy ounce on Thursday. The non-interest-bearing Gold lost ground as a stronger-than-expected United States (US) Producer Price Index (PPI) and Retail Sales, along with last week’s easing Unemployment Rate, reinforced the case for the US Federal Reserve (Fed) to keep interest rates on hold for the coming months.
Safe-haven Gold prices also weaken, partly reflecting easing geopolitical concerns. US President Donald Trump said reports indicated Iran’s crackdown-related killings were subsiding and that no large-scale executions were planned, though he did not rule out potential US military action, noting Washington would continue to monitor developments, according to Reuters.
⭐️Personal comments NOVA:
Gold prices are adjusting and consolidating around 4575, but still maintaining an upward trend.
⭐️SET UP GOLD PRICE:
🔥SELL GOLD zone: 4678 - 4680 SL 4685
TP1: $4660
TP2: $4645
TP3: $4630
🔥BUY GOLD zone: 4575 - 4573 SL 4568
TP1: $4588
TP2: $4602
TP3: $4615
⭐️Technical analysis:
Based on technical indicators EMA 34, EMA89 and support resistance areas to set up a reasonable BUY order.
⭐️NOTE:
Note: Nova wishes traders to manage their capital well
- take the number of lots that match your capital
- Takeprofit equal to 4-6% of capital account
- Stoplose equal to 2-3% of capital account

NICE BULL RUN STARTING NOWNice bull run
smart money entry... Little early sure but price have to start reversing somewhere so why not here.

XAUUSD: The Bullish Trend Remains IntactXAUUSD continues to trade within a primary bullish trend , and the current short-term pullbacks are merely a healthy pause before price extends higher.
From a fundamental perspective, recent U.S. economic data suggest that inflationary pressures are easing and consumer demand is no longer excessively strong, increasing expectations that the Federal Reserve may shift toward a more dovish stance . At the same time, geopolitical risks and a cautious market sentiment continue to support safe-haven demand, providing a solid short-term foundation for gold.
On the chart, the bullish structure remains clearly intact. Price is moving within a well-defined ascending channel , consistently forming higher lows. The 4,570 support zone below plays a critical role, acting as a confluence of the rising trendline and a key acceptance area. As long as this level holds, there are no signs of a trend breakdown.
On the upside, 4,720 stands out as a key psychological resistance . A shallow pullback into support followed by a renewed push higher would represent a healthy continuation scenario, allowing the market to build momentum before challenging this resistance once again. The fact that price is not facing aggressive selling pressure near the highs indicates that buyers remain firmly in control.

Chasing Buys at the Top? USDJPY Is Sending a Risk WarningUSDJPY is entering a technical corrective pullback after an extended and aggressive rally. While the broader macro backdrop previously remained unfavorable for the Japanese yen, the market is no longer reacting strongly to USD-bullish headlines as it did before.
From a news perspective, the Japanese yen is expected to stay under pressure amid speculation that Prime Minister Sanae Takaichi may call for an early election in February. A potential victory is widely seen as supportive of expansionary fiscal policies, which would add further downside pressure on JPY. However, the key point is that most of this narrative has already been priced in , and USDJPY has rallied sharply in anticipation of that outcome.
Turning to the chart, the technical picture is flashing early warning signs . Price is approaching the key psychological resistance zone at 159.50–159.60, while simultaneously testing a long-term ascending trendline. At this level, buying momentum is clearly fading, with visible rejection signals suggesting that bulls are losing control.
In this environment, chasing long positions near the highs carries elevated risk . A more prudent approach is to wait for weak pullbacks and prioritize SELL setups in line with the corrective structure, rather than getting trapped by outdated headlines. Markets do not move because of news titles — they move because of how price reacts after the news is released.

ZM LongChart looks wonderful. Textbook bearish to bullish reversal setup here. bottomed in 8/24, series of higher highs and higher lows since. Seen in the cup-like pattern forming.
I would play the coming bullish breakout - from the pennant pattern -with an aggressive long upon price action confirmation.
Fundamentals also look strong. Cheap valuation at 14 times forward (granted growth has slowed materially since COVID era). FCF/EV yield of 11+% and profit margins north of 30%. I don't see much downside risk. I see plenty of upside, especially if investor sentiment surrounding software mean reverts.
This is not financial advice. Good luck!

MPLX Due For A 44% RiseWhy do I believe in this trade?
Because, an important price was left behind and is likely to try a retest, the 4th dip on the weekly just occurred, price just formed a new all time low, and because price is down 30%+ from the last high, without a significant rise on the way down.
I am expecting price to rise 44% from 0.0528.

EUR/USD: When Every Pullback Becomes an Opportunity for SellersAs we move into mid-January 2026 , EUR/USD is clearly reflecting the internal contradiction within the European economic narrative : short-term bright spots exist, yet long-term structural risks remain a major headwind . When this macro backdrop is placed onto the current H4 chart, the bearish trend is being reinforced both fundamentally and technically.
From a news perspective , the market is not focusing on the improvement in quarterly growth. Instead, attention remains on negative structural factors: annual GDP growth slowing, energy costs still several times higher than in the US, and persistent competitiveness constraints. These elements are not strong enough to justify fresh EUR buying in the short term, while the USD continues to hold a relative advantage . As a result, capital flows are leaning toward defense rather than aggressively bottom-fishing the euro .
From a technical standpoint , the bearish structure is clearly visible on the H4 timeframe . Price remains below the Ichimoku cloud, repeatedly rejected at the descending trendline and the 1.1680–1.1700 resistance zone . Recent rebounds have been purely technical, failing to break the lower-high structure. This confirms that sellers remain firmly in control. Under the current scenario, EUR/USD may attempt a minor rebound into resistance, but is likely to resume its decline toward 1.1630, or even lower if selling pressure accelerates.
In summary, with fundamentals failing to support the euro and the chart maintaining a clear bearish structure , the most rational short-term approach remains selling in line with the trend, rather than anticipating a premature reversal.

OTTR Stock Confirmed Bullish/Going UPHello,
Ayrfolio trade ideas are based on weekly charts and momentum, so remember to be patient! No day trades here unless the stock soars up intraday. Today we’re covering:
COMPANY: Otter Tail Corporation
STOCK SYMBOL: OTTR
POSITION: Long
TP1 Risk-Reward Ratio: 1.67
TP2 Risk-Reward Ratio: 3.34
Stop Loss: must wait AFTER daily candle closes to exit trade (regular candle, NOT Heiken Ashi)
Ultimate Stop Loss: can exit IMMEDIATELY if price reaches this level during any trading hours
EXPLANATION: Weekly momentum increased and confirmed on Monday 8/18/25 at $85.97/share. Although the stop losses are listed on the chart, if momentum has been lost then we can exit before the price reaches the stop loss.
DISCLAIMER: Please do your own due diligence before making any decisions. I am not an investment advisor, and I do not personally trade these stocks. These posts are stock trade ideas that follow my same weekly momentum strategy. Past results are not indicative of future performance.
P.S. - Stocks can soar. YOU can soar. Soaring is possible!
-Ayrfolio

PINC Stock Going UP, Confirmed Monday 8/11/25Hello,
Ayrfolio trade ideas are based on weekly charts and momentum, so remember to be patient! No day trades here unless the stock soars up intraday. Today we’re covering:
COMPANY: Premier, Inc.
STOCK SYMBOL: PINC
POSITION: Long
TP1 Risk-Reward Ratio: 1.78
TP2 Risk-Reward Ratio: 3.57
Stop Loss: must wait AFTER daily candle closes to exit trade (regular candle, NOT Heiken Ashi)
Ultimate Stop Loss: can exit IMMEDIATELY if price reaches this level during any trading hours
EXPLANATION: Weekly momentum increased and confirmed on Monday 8/11/25 at $24.95/share. Although the stop losses are listed on the chart, if momentum has been lost then we can exit before the price reaches the stop loss.
DISCLAIMER: Please do your own due diligence before making any decisions.
P.S. - Stocks can soar. YOU can soar. Soaring is possible!
-Ayrfolio

DOT/USD SSL taken → ( upside )Potential bullish expansion
A pullback into supply is expected for mitigation
This is a long-term expectation, anticipated by early 2026 (Q1)
(This is not financial advice. Trade at your own risk)

FOMO When Gold Explodes: The Trap Most Traders Fall IntoIf you’ve ever chased a strong gold rally, entered a trade out of fear of “missing the move,” and then watched price reverse and stop you out minutes later — you’re not alone.
That’s FOMO (Fear of Missing Out), and it is one of the most dangerous psychological traps when trading XAUUSD.
How FOMO shows up when gold moves aggressively
Gold is a market known for speed, volatility, and expansion.
When price starts printing large bullish candles, the trader’s mind often reacts instinctively:
“Price is running, if I don’t enter now I’ll miss it”
“Everyone is buying, it must keep going”
“I’ll just enter quickly and use a tight stop”
The problem is simple: you’re reacting emotionally, not executing a plan.
In many cases, those strong impulsive moves you see are:
- The late-stage expansion of a trend
- A liquidity push designed to trigger late buy orders
- Or the area where institutions begin distributing positions
By the time FOMO kicks in, the best part of the move is often already over.
Why FOMO is especially dangerous in gold trading
Unlike many forex pairs, gold:
- Creates sharp spikes and deep pullbacks
- Frequently produces false breakouts around key levels
- Sweeps both sides before committing to the real direction
When you trade with FOMO:
- Stops are placed too tight
- Entries are made at expensive prices
- A normal technical pullback is enough to take you out
Price may still move in the direction you expected — just without you in the trade.
Signs you’re trading with FOMO (even if you don’t realize it)
Ask yourself:
- Did I enter because of my plan, or because price was moving too fast?
- Am I trading outside my pre-marked zones?
- Am I ignoring market structure because I’m afraid of missing out?
If the answer is yes, FOMO is likely driving your decision.
How to avoid the FOMO trap when gold is running
1. Trade levels, not candles
Large green candles are not signals. Zones are.
If price has already left your area, accept the missed opportunity.
2. Ask one key question: “Who is entering here?”
If you buy after a strong expansion, you’re often buying from traders who are taking profit.
3. Accept missing trades as part of the game
No professional trader catches every move.
Missing a trade is cheaper than forcing a loss.
4. Wait for reactions, not movement
The market always offers a second chance — pullbacks, consolidations, or clearer structure.

XAU/USD – The bullish momentum is firmly supportedAs we move into the new trading week, gold is once again demonstrating its role as a safe-haven asset, benefiting strongly from the current macroeconomic backdrop. The fact that gold prices surged nearly 2% and reached a record high during the Asian session is not merely a short-term reaction, but rather reflects a clear shift in monetary policy expectations and global risk sentiment.
From a fundamental perspective , the latest U.S. labor market data released at the end of last week acted as a key catalyst. Nonfarm payrolls increased by only 50,000 jobs , significantly below expectations, signaling a clear cooling in the U.S. labor market . This development has reinforced expectations that the Federal Reserve may soon enter a rate-cutting cycle this year, weakening the U.S. dollar and bond yields — an ideal environment for gold to remain well supported and continue to be repriced higher.
At the same time, heightened geopolitical risks have added another layer of support. Rising instability in the Middle East, particularly the prolonged unrest in Iran, alongside ongoing tensions between the U.S. and Venezuela, continues to drive demand for gold as a defensive hedge against uncertainty.
On the technical side, the structure of XAU/USD fully supports a bullish continuation scenario. The 4,550 zone is currently acting as immediate support , where buying interest consistently emerges on pullbacks. As long as this support remains intact, any retracement should be viewed as technical and corrective , offering opportunities for trend continuation rather than signaling reversal. To the upside, the psychological resistance at 4,650 stands as the next key target, where price may temporarily pause before potentially extending the rally further.
Wishing you successful and disciplined trading ahead!

Continued expectations for a new all-time high (ATH) for gold.⭐️GOLDEN INFORMATION:
Gold Price (XAU/USD) jumps to near $4,600 during the early Asian session on Tuesday. The precious metal extends the rally after retreating from a fresh record high of $4,630 in the previous session amid uncertainty and geopolitical risks. The US Consumer Price Index (CPI) inflation data for December will take center stage later on Tuesday.
Federal Reserve (Fed) Chair Jerome Powell said on Sunday that he’s under criminal investigation, sparking an independence crisis and triggering a flight to safety across global markets. Powell stated that the US Department of Justice had issued subpoenas to the central bank and threatened a criminal indictment related to his testimony before the Senate Banking Committee in June 2025 concerning a $2.5 billion renovation of the Fed's Washington, D.C., headquarters. Powell called the threats a "pretext" aimed at putting pressure on the Fed to cut interest rates.
⭐️Personal comments NOVA:
Gold prices continue to fluctuate upwards, consolidating around 4600 and awaiting the formation of a new all-time high (ATH): a potential 4679.
⭐️SET UP GOLD PRICE:
🔥SELL GOLD zone: 4678 - 4680 SL 4685
TP1: $4660
TP2: $4645
TP3: $4630
🔥BUY GOLD zone: 4547 - 4545 SL 4540
TP1: $4560
TP2: $4575
TP3: $4595
⭐️Technical analysis:
Based on technical indicators EMA 34, EMA89 and support resistance areas to set up a reasonable BUY order.
⭐️NOTE:
Note: Nova wishes traders to manage their capital well
- take the number of lots that match your capital
- Takeprofit equal to 4-6% of capital account
- Stoplose equal to 2-3% of capital account

Buy DellHey Trading Fam,
Pretty simple. My Pivot Zones indicator has given me a "BUY" signal here, and so, I am buying. The technicals do support the indication. You can see, we are very oversold into that orange 350 SMA. Additionally, high-volume trading days have been supporting price moves to the upside. These are very good signs that support another great "BUY" alert from my indicator. The indicator will be released for use once beta testing is completed by the end of February.
✌️Stew

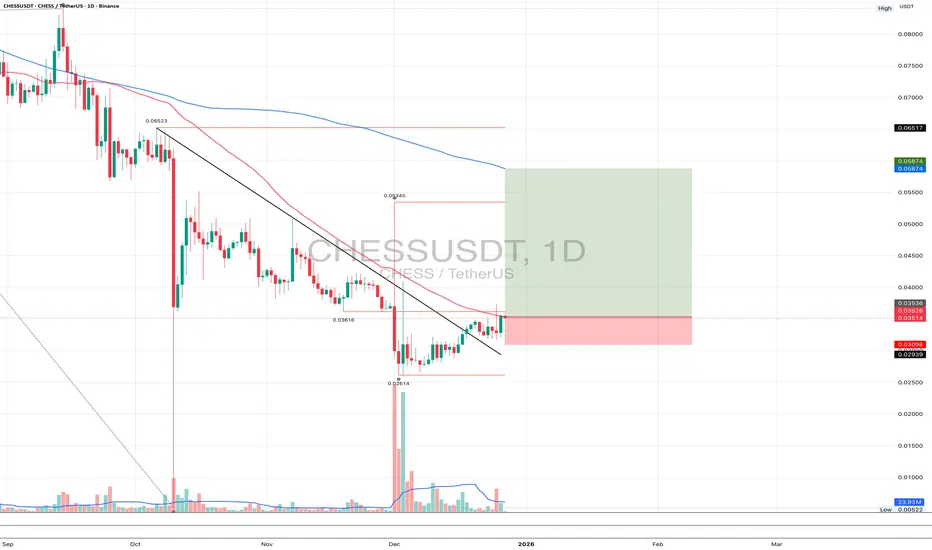
CHESSUSDT 1DShort technical update 👇
On the daily timeframe, CHESS broke its bearish structure and completed a clean retest of the breakout level. The retest held, selling pressure is fading, and higher local lows are forming. The current structure suggests a recovery phase after a prolonged decline. The base scenario is a continuation to the upside with a move toward the MA200 as the next key mid-term target.
SOLANA - Your ticket to Lambo!Across all altcoins Solana looks the strongest:
Liquidity sweep
Shift on 4h TF
Most volume on the bottom
Great choice for mid-long term investment/speculation
Potentialy price can move ~80% or more , but i really like to buy it here
my avg entry is 124
Follow for more

MUGHAL STEELMUGHAL STEEL PSX
Follow the plan | Manage Risk–Reward strictly
🔹 Price retracing → offering two strong buying zones
🔹 Good share to accumulate for medium–long term (2026 view)
🔍 Fundamental Strength
✅ Strong group backing (Conglomerate exposure)
✅ Diversified earnings streams (core + growth segments)
✅ Healthy cash flows & balance sheet support
✅ Long-term growth visibility aligned with economic recovery
📊 Technical View
📉 Retracement from recent highs — healthy correction, not trend reversal
📍 Buying Zone 1: First demand area (for partial entry)
📍 Buying Zone 2: Strong support / value zone (for accumulation)
📈 Primary trend intact (higher-highs & higher-lows structure)
🛑 Clear invalidation level — risk well defined
⚠️ Trading Plan
🎯 Staggered buying on dips
🎯 Hold for 2026 unless structure breaks or USE TPs mentioned.
❌ Avoid over-leveraging
🧠 Let price confirm — no emotional entries
This is a structured accumulation setup, not a chase trade.

Price Breakout vs Confirmed CloseA small difference — but a very high price to pay
1. What is a price breakout?
A price breakout simply occurs when a candle’s wick or body touches or moves above a previous high.
The key point is this:
- A breakout does not mean the market has accepted a new price level.
Many breakouts last only a few seconds and exist purely to sweep liquidity.
- In practice, breaking a high is a very cheap action for the market. It often takes only a small amount of orders to push price above a high in the short term.
2. What is a confirmed close?
A confirmed close occurs when:
– The candle finishes completely above the previous high
– The market accepts the new price level instead of pulling back below it
This is the critical distinction:
Price can touch a high with a wick,
but it is only confirmed by the close.
A close reflects consensus, not an instant reaction.
3. Why do breakouts often cause traders to lose?
When traders enter immediately after price breaks a high, they often place themselves right in a liquidity cluster. Stop losses are typically positioned just below the old high, making it easy for the market to sweep those orders.
The common scenario is price breaking the high, triggering buy orders, then reversing before continuing in the original direction. The market is not wrong — the entry timing is.
4. Why is the close more important than the break?
Because:
Price can be pushed up artificially,
but a close requires sustained participation.
Without real money flow, price cannot hold the level.
A confirmed close shows that:
Buyers are willing to hold positions,
Selling pressure has been absorbed,
The probability of continuation is significantly higher.
5. Practical application
A healthy trading mindset:
❌ Do not enter just because price touches a high
✅ Wait for a clear candle close
✅ Prioritize:
Close above → pullback → continuation
Or a strong close with structure remaining intact
If there is no confirmed close, there is no reason to rush.

Gold price continues to reach a new all-time high - waiting for ⭐️GOLDEN INFORMATION:
The UK and Germany are reportedly considering boosting their military footprint in Greenland to underscore Europe’s commitment to Arctic security amid heightened geopolitical strains, following last week’s arrest of former Venezuelan President Nicolas Maduro by US forces. Rising global uncertainty continues to underpin demand for traditional safe-haven assets such as Gold.
Meanwhile, a mixed US employment report has reinforced expectations of further Federal Reserve rate cuts, lending additional support to the yellow metal. Lower interest rates reduce the opportunity cost of holding non-yielding assets, keeping Gold well supported.
⭐️Personal comments NOVA:
Gold prices continue to rise - officially reaching a new all-time high. Strong buying pressure continues.
⭐️SET UP GOLD PRICE:
🔥SELL GOLD zone: 4633 - 4635 SL 4640
TP1: $4620
TP2: $4605
TP3: $4590
🔥BUY GOLD zone: 4515 - 4513 SL 4508
TP1: $4530
TP2: $4545
TP3: $4560
⭐️Technical analysis:
Based on technical indicators EMA 34, EMA89 and support resistance areas to set up a reasonable BUY order.
⭐️NOTE:
Note: Nova wishes traders to manage their capital well
- take the number of lots that match your capital
- Takeprofit equal to 4-6% of capital account
- Stoplose equal to 2-3% of capital account

SPY – ATH into Heavy Macro Week | Trend Still IntactThesis
AMEX:SPY continues to trade in a mature but intact bullish cycle, pushing to new all-time highs despite a heavy macro and event-driven calendar.
Context
- Weekly timeframe
- CPI, PPI, Jobless Claims ahead
- Start of key earnings season
- Supreme Court ruling delayed into next week, adding uncertainty
What I see
- Market printed another ATH and closed the week at the highs
- Price remains well above rising trend support
- No visible distribution or topping structure yet
- Momentum remains strong despite known macro risks
What matters now
- As long as price holds above the rising channel, the trend remains bullish
- Last CPI print came in much cooler than expected
- A second consecutive soft CPI would confirm a disinflation trend and likely fuel further upside
- Market is clearly not pricing near-term stress
Buy / Accumulation zone
- This is not an area for aggressive new buying
- Focus shifts from adding risk to managing and cleaning the portfolio
- Selectively trimming positions that fully rode the last 5–6 years of the cycle
Targets
- Trend-following extension remains open toward higher Fib projections
- No confirmed cycle top yet
Risk / Invalidation
- A sustained loss of the rising channel would signal the need to reduce exposure
- Until then, price action favors holding, not anticipating a top

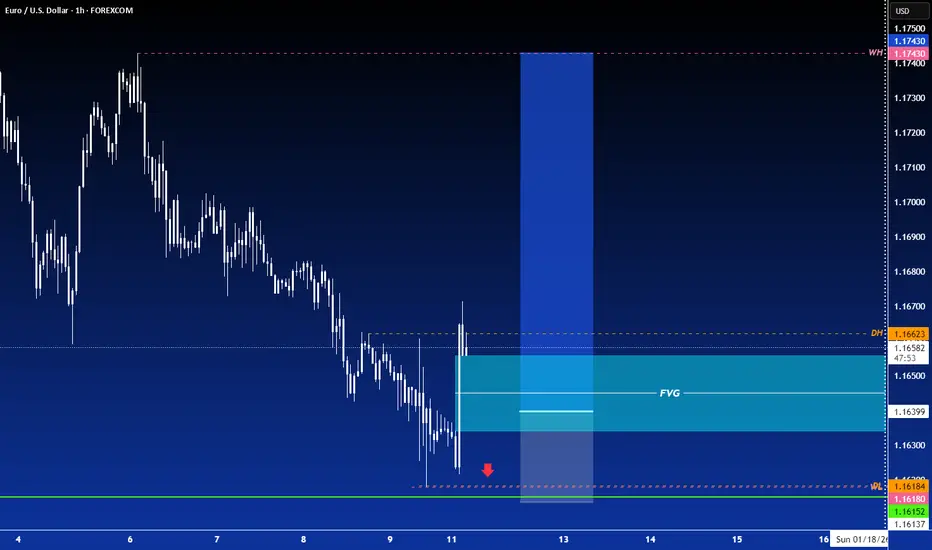
LONG ON EUR/USDEUR/USD has just given a CHOC (change of character) to the upside from is recent downtrend.
The dollar (DXY) is very bearish and I expect EUR/USD to simply retrace a little deeper into the FVG before it begins to rise.
looking to make 80-100 pips.