Waiting for gold price to break out of 4352, uptrend.⭐️GOLDEN INFORMATION:
Looking ahead, market attention will turn to the US Consumer Price Index (CPI) for November, due on Thursday, followed by the Personal Consumption Expenditures (PCE) Price Index on Friday. These key inflation releases are expected to play a pivotal role in shaping expectations around the Federal Reserve’s rate path.
Daily Digest – Market Movers: Gold advances as signs of a cooling US labor market bolster rate-cut expectations. According to the US Bureau of Labor Statistics (BLS), Nonfarm Payrolls increased by 64,000 in November, rebounding from a revised decline of 105,000 in October. The figure exceeded market forecasts of a 50,000 gain, providing a nuanced read on labor market momentum.
⭐️Personal comments NOVA:
Maintaining an upward trend - consolidating and consolidating sideways above 4300 to gain momentum for a new all-time high.
⭐️SET UP GOLD PRICE:
🔥SELL GOLD zone: 4391 - 4393 SL 4398
TP1: $4375
TP2: $4360
TP3: $4345
🔥BUY GOLD zone: 4282 - 4280 SL 4275
TP1: $4295
TP2: $4310
TP3: $4325
⭐️Technical analysis:
Based on technical indicators EMA 34, EMA89 and support resistance areas to set up a reasonable BUY order.
⭐️NOTE:
Note: Nova wishes traders to manage their capital well
- take the number of lots that match your capital
- Takeprofit equal to 4-6% of capital account
- Stoplose equal to 2-3% of capital account
Longsetup

Hello traders, let’s break down the CADUSD pair today!Canada’s CPI came in below expectations , yet CAD is still holding near its three-month highs , showing that the market views the Canadian dollar as stable and not under strong selling pressure. Meanwhile, the Bank of Canada keeping interest rates at 2.25% helps clarify policy expectations. As long as BoC does not signal further easing , CAD has a solid foundation to maintain relative strength against the USD.
On the U.S. side, the spotlight remains on NFP, the unemployment rate, and average hourly earnings . If these figures come in weaker than expected, the USD is likely to face pressure, creating a favorable scenario for CADUSD to extend higher. Conversely, very strong U.S. data may only trigger short-term volatility, not enough to break the current trend.
From a technical perspective, CADUSD is moving within a clear rising wedge , with price respecting the trendline and being supported from below by the Ichimoku cloud. The 0.7260 area is acting as near-term support, where price is consolidating firmly. The pattern of higher lows confirms that buyers remain in control.
As long as 0.7260 holds, the probability is high that price will continue its upward momentum toward 0.7310, a key psychological resistance . Current pullbacks should therefore be seen as “pauses to build momentum”, rather than signals of a trend reversal.

GBPUSD Is Climbing — Is a BUY Opportunity Opening Up?Hello traders, if you’re looking for a trade that is trend-aligned, clean, and easy to execute, GBPUSD is currently presenting a very solid bullish picture , even though short-term news may still cause some minor volatility.
From a macro perspective, weak UK data (soft GDP) can put pressure on GBP. However, on the other side, the USD is not particularly strong , as the market remains cautious ahead of key U.S. economic data . As a result, GBPUSD is more likely to move in a “slow but steady” bullish manner — pushing higher step by step, pausing, and then continuing.
On the chart, the uptrend remains clearly intact : price is holding above the rising trendline and is well supported by Ichimoku, with the cloud below acting as a strong support base. The 1.3350 zone is a key level — a confluence of trendline support and horizontal demand. As long as this level holds, the bullish structure remains healthy. The preferred scenario is a pullback toward 1.3350, some consolidation, and then a push higher toward 1.3430.
In summary , the preferred strategy remains buying on pullbacks , staying aligned with the prevailing uptrend. And the most important question right now is not “Will it go up?” — but rather: do you have the patience to wait for the 1.3350 zone to execute the cleanest possible entry?

LTC: Breakout Before Altcoin SeasonPrice has been moving inside a large 3‑month symmetrical triangle, with lower highs from the 2017 peak and higher lows since the 2018 bottom.
The current candle is compressing between the support and resistance trendlines, suggesting a larger move is getting closer.
A confirmed breakout above the triangle resistance and the 0.5–0.618 Fib would open the way toward the marked profit zone in the 0.65–0.786 area (~185–255 USD), where previous supply sits.
As long as the higher‑low structure holds, the bias remains bullish; a clean weekly/3M close back below the triangle support would invalidate this idea and shift the focus back toward the 40–50 USD zone.
Litecoin often behaves as a “mid‑cap beta play” between Bitcoin and smaller alts: when BTC stabilizes and capital starts rotating out along the risk curve, LTC is one of the first large caps to wake up. A strong, high‑timeframe breakout on Litecoin can therefore be an early sign that market participants are ready to take more risk, paving the way for a broader altcoin season.

XAUUSD Clearly Bullish – This Is Not a TrapHello traders, let’s analyze XAUUSD today!
With the current setup, XAUUSD is presenting a clean and well-defined bullish picture , without the need for overly complex speculation.
From a fundamental perspective , the environment is clearly leaning toward the bullish side. A weaker USD combined with declining U.S. bond yields is creating a favorable backdrop for gold. In addition, expectations that the Fed may ease monetary policy remain in place, encouraging capital to continue flowing into gold as both a safe-haven asset and a medium-term speculative instrument. At this stage, the market lacks a strong catalyst capable of reversing XAUUSD’s upward trend.
Looking at the chart structure, the bullish trend is strongly confirmed. Price is moving within a well-defined ascending channel , consistently forming higher highs and higher lows. The Ichimoku system fully supports the bulls, with price holding above the cloud and key lines sloping upward, signaling that this move is structurally strong rather than temporary . The recent pullback should therefore be viewed as a healthy technical correction, not a trend reversal.
In terms of scenarios, the area around 4,280 is acting as a key support zone. As long as price continues to hold above this level, XAUUSD has a strong probability of resuming its upward move toward the 4,400 target, in line with the current channel structure. This scenario aligns both technically and fundamentally.
Wishing you all successful and disciplined trading!

GBPJPY Loses Momentum – Beware of the Pullback TrapAs the macro landscape begins to shift , GBPJPY is no longer able to maintain its previous bullish rhythm. Expectations that Japan is moving closer to policy tightening , while the UK faces rising risks of slower growth , are gradually pushing capital out of GBP and into JPY. This shift creates a clear foundation for a downward corrective phase in the pair.
On the H4 timeframe, price structure shows clear signs of exhaustion after an extended rally . Price repeatedly tested the upper boundary of the ascending channel but failed to break higher, then rolled over and lost the short-term equilibrium zone. The increasingly weak pullbacks signal that buyers are no longer in control, while sellers are starting to use rallies to apply pressure.
The 208.00 level is now a critical boundary. As long as price remains capped below this zone, the bias continues to favor the bearish scenario, with 206.60 emerging as the next logical target. This area is not only a technical support, but also a zone where the market may briefly pause to reassess supply and demand dynamics.
Overall, GBPJPY appears to be entering a phase of controlled decline rather than a sharp breakdown . The more appropriate strategy at this stage is to patiently wait for pullbacks to sell, instead of rushing to catch a bottom. And if the downside momentum persists, the market may be opening a new chapter — one where control no longer rests with the bulls as it once did.

EURUSD: A Brief Pause Before Acceleration?In the current environment, where the market is still pricing in a weaker USD scenario due to expectations of a more dovish Federal Reserve , EURUSD has a solid foundation to maintain its bullish momentum . When the greenback lacks strong upside momentum, capital tends to rotate into counterpart currencies like the euro , especially when the technical structure clearly supports the trend .
From a chart perspective, EURUSD is trading within a well-defined rising wedge , following a clean rhythm of push higher – pull back – continuation. The previous impulsive rally printed a new high, and instead of selling off aggressively, price shifted into consolidation above the equilibrium zone, signaling that buyers remain firmly in control. The Ichimoku system is also leaning bullish, with price holding at elevated levels, reinforcing the trend continuation scenario.
In terms of price action, the 1.1720 zone is a key pivot. It serves both as a healthy retest area within the rising wedge and a balance point where buyers are likely to defend structure. If price pulls back toward 1.1720 and shows a clear bullish reaction, EURUSD has a high probability of extending toward the 1.1790 region — an area where short-term profit-taking and volatility typically emerge.
In summary, with fundamentals and technicals aligned , the highest-probability approach remains buying pullbacks rather than chasing price. And if 1.1790 is tested in the coming sessions, the real question will no longer be whether price can go higher, but whether the market pauses there — or ignites a much larger breakout for the next bullish leg.

AUDNZD: Tight Consolidation_Preparing for the Next Upward LegAUDNZD is entering a phase where the market looks “mature enough” to continue its uptrend , as AUD maintains a stronger base than NZD thanks to diverging policy expectations . While the RBA remains cautious about inflation, the market is increasingly less confident about the RBNZ outlook , causing short-term capital flows to lean toward AUD. This divergence forms a key foundation supporting a bullish bias for AUDNZD.
On the 4H chart, the price structure remains clean and well-defined. After rebounding from the lows, the market is now consolidating within a tight range with higher lows forming. Price is holding firmly above the 1.1450 support zone, signaling that selling pressure is not strong enough to break the structure . The current setup favors a pullback → consolidation → continuation scenario rather than a trend reversal.
In this context, 1.1450 acts as a critical anchor point for buyers. As long as price continues to hold above this level, AUDNZD has a solid basis to advance toward 1.1500 in the short term. The preferred strategy is to prioritize BUY setups on pullbacks , while avoiding chasing price near resistance .
In summary , AUDNZD is displaying a move that is “calm yet decisive.” As long as the trend structure remains intact and capital continues to favor buyers, patience in waiting for the right entry zone will be the key to staying aligned with the market in a disciplined and sustainable way.

Pepe Gann Fann Bottom LevelDoing a quick up and down gann on Pepe shows us the best possible entry:
0.033 to 0.034 as a possible bottom not he weekly.
The move would then takes us to 1/1 of the red downward facing gann for next breakout and TP

Waiting for BTC to break out and recover.BTC Trading Plan – Daily Timeframe
BTC is currently in a corrective phase within a larger downtrend, but signs of a potential base formation are emerging.
Key Technical Context
Price is moving inside a descending channel / falling wedge, often a bullish reversal structure if broken to the upside.
The 93.2K level is a critical breakout line. A confirmed daily close above this level would signal a shift in short-term momentum.
The zone around 100K–102K (purple area) is a major supply / resistance, aligning with the descending trendline and EMA resistance.
Strong demand remains at 83.5K–84K, which is the key downside support.
Trading Scenarios
Bullish Scenario
Daily close above 93.2K → continuation toward 100K–102K.
A clean breakout above 102K would open the path back to higher levels and trend reversal confirmation.
Bearish Scenario
Rejection below 93.2K keeps BTC in consolidation.
Breakdown below 83.5K could trigger a deeper drop toward the 79K region.

When to Trade — When to Stay OutHi everyone,
In the way I approach the market, I don’t see trading as a reflexive reaction to price movements. I see it as a structured decision-making process , built on clearly defined conditions. The market is active all the time, but constant activity alone does not create tradable opportunities. Acting without clear conditions means confusing movement with real advantage.
That’s why every decision starts with an analysis of the broader context . I only consider getting involved when the market structure is coherent, price dynamics are readable, and the environment allows for a clear assessment of risk. When the market becomes unstable, fragmented, or dominated by noise, every attempt to enter inevitably weakens decision quality. In those moments, staying out of the market is not passivity—it’s a rational act of protection .
Once the context is validated, my absolute priority becomes risk management . Before evaluating any potential reward, I need to know exactly where my scenario is invalidated. Without that information, no trade can be justified. A stop-loss is not an emotional safety net; it’s a fundamental part of decision logic. When risk is clearly defined and limited, the outcome of a trade becomes a matter of probabilities, not hope.
Even so, in a technically favorable environment, a decision remains fragile if it’s made in an unhealthy mental state . The market doesn’t punish analysis mistakes as much as it punishes execution errors driven by emotion. Any decision influenced by urgency, fear of missing out, or the desire to recover a previous loss immediately breaks the integrity of the process. In those conditions, not trading is the only decision aligned with discipline .
This is exactly why I consider the ability not to intervene a core skill. Most of the time, the market does not offer a structure with a clear edge. Being constantly in a position is neither an obligation nor a goal. Preserving capital, maintaining mental clarity, and protecting decision discipline are prerequisites for sustainable performance.
In conclusion , knowing when to trade and when to stay out is not a technical issue—it’s a mindset. When action is limited to genuinely favorable contexts and inaction is fully accepted as a strategic choice, trading stops being a chase for short-term results and becomes a controlled risk-management process . At that point, long-term performance is neither accidental nor emotional—it’s built on logic.
Wishing you profitable and disciplined trading.

Gold prices rose at the beginning of the week: 4366⭐️GOLDEN INFORMATION:
Gold (XAU/USD) pushes to fresh seven-week highs above $4,325 during Asian trading on Monday, extending its bullish momentum amid growing conviction that the US Federal Reserve will pivot toward rate cuts next year. Expectations of a lower interest-rate environment continue to compress the opportunity cost of holding non-yielding assets, providing a solid fundamental tailwind for the yellow metal. In addition, elevated uncertainty and risk-off dynamics are underpinning safe-haven demand, further reinforcing gold’s upside bias.
That said, recently hawkish commentary from Fed officials poses a near-term headwind, as it could offer renewed support to the US Dollar (USD) and cap gains in USD-denominated commodities. Market participants will look for additional direction from upcoming remarks by Fed Governor Stephen Miran and New York Fed President John Williams later on Monday.
⭐️Personal comments NOVA:
The market remains very positive - price increase above 4300. The upside target is 4366.
⭐️SET UP GOLD PRICE:
🔥SELL GOLD zone: 4366 - 4368 SL 4373
TP1: $4350
TP2: $4335
TP3: $4320
🔥BUY GOLD zone: 4267 - 4265 SL 4260
TP1: $4280
TP2: $4295
TP3: $4310
⭐️Technical analysis:
Based on technical indicators EMA 34, EMA89 and support resistance areas to set up a reasonable BUY order.
⭐️NOTE:
Note: Nova wishes traders to manage their capital well
- take the number of lots that match your capital
- Takeprofit equal to 4-6% of capital account
- Stoplose equal to 2-3% of capital account

Scalp LONG – SUN🐂 Scalp LONG – SUN
SUN is deeply oversold on the 1h timeframe, signaling exhaustion on the sell side. Price action is compressing and approaching a classic breakout structure, suggesting momentum is building for a sharp upside expansion. A strong bullish breakout is anticipated.
🎯 TP: 0.02088
🛡️ SL: 0.01993
📊 RR: 1 : 3.75
A high-quality long setup: 1h oversold conditions + breakout structure → strong rebound potential with attractive risk-to-reward.

Clean vs Trap Pullbacks — Don’t Get FooledIn trading, a pullback can be an opportunity…
but it is also one of the most common traps that causes traders to lose money.
Some pullbacks allow you to enter with low risk, clean RR, and follow the trend smoothly.
Others look perfectly reasonable… until the market reverses and wipes out your stop loss.
So how do you tell a clean pullback from a trap pullback?
1. Clean Pullback – A Pause Before Continuation
A clean pullback is a healthy correction within a strong, intact trend.
Think of it as the market catching its breath before the next push.
Key characteristics of a clean pullback:
◆ The main trend remains clear
Higher highs – higher lows (uptrend)
Lower lows – lower highs (downtrend)
◆ The retracement is weaker than the impulse move
Smaller candles, shorter bodies, long wicks
No structural break
◆ Volume decreases during the pullback
Selling (or buying) pressure is not aggressive
The market is simply “resting”
◆ Price pulls back into a logical area
Previous support/resistance
Structural zones
Common Fibonacci levels (38.2 – 50 – 61.8)
👉 A clean pullback does not damage the trend’s integrity — it only tests it.
2. “Trap” Pullback – Looks Like a Retracement, Acts Like a Reversal
Trap pullbacks usually appear after a trend has extended too far or when momentum starts to fade.
They make traders think:
“It’s just a normal pullback…”
But in reality, smart money is already distributing.
Signs of a trap pullback:
◆ Trend strength is clearly weakening
New highs fail to exceed previous highs
Previous lows start getting broken
◆ The retracement is strong and aggressive
Large-bodied candles closing deep
Price moves confidently against the trend
◆ Volume increases during the pullback
This is no longer a technical retracement
Real money is changing direction
◆ Market structure breaks
Key highs/lows are violated
Break → retest → continuation in the opposite direction
👉 Trap pullbacks exploit a trend trader’s overconfidence.
3. A Common Mistake: “Price Pulls Back = Enter Trade”
Many traders don’t lose because of bad analysis,
but because they enter too early.
Familiar thoughts:
“It pulled back to support — buy.”
“The trend is still bullish.”
“That candle is just a retracement.”
But the market doesn’t care what you think.
It only cares about where the money is flowing.
4. How to Avoid Trap Pullbacks – Survival Rules
If you remember these three rules, you’ll avoid most pullback traps:
◆ Never enter just because price pulls back
Wait for confirmation:
rejection candles
small break & retest
clear reaction at structure
◆ Always check market structure first
Is the structure intact or broken
Are key highs/lows still respected?
◆ Compare impulse vs retracement
Strong impulse – weak pullback → trend is alive
Strong pullback – weak impulse → reversal risk
XAUUSD: Bullish Momentum StrengthensGold is entering a highly promising bullish phase as the market shifts strongly to the buy-side following the Fed’s decision to cut interest rates. The emerging risk-on sentiment aligns perfectly with a technical setup that is paving the way for a potential breakout — creating an exceptionally attractive environment for traders in the coming days.
1. Fundamental Drivers Supporting Gold’s Uptrend
• The Fed cut rates by 25 bps, something the market had been waiting for weeks. This immediately pushed the USD down to its lowest level in eight weeks.
• With a weaker USD, gold becomes cheaper for global buyers → strong inflows into XAUUSD.
• President Donald Trump continues to support low interest rates, a long-term policy signal that reinforces expectations that gold still has room to rise.
• Markets are now watching the December 16 NFP report, but given the current backdrop, this data will likely bring short-term volatility rather than change the broader bullish trend.
=> The macro landscape is clearing the path for gold to continue rising in the mid-term.
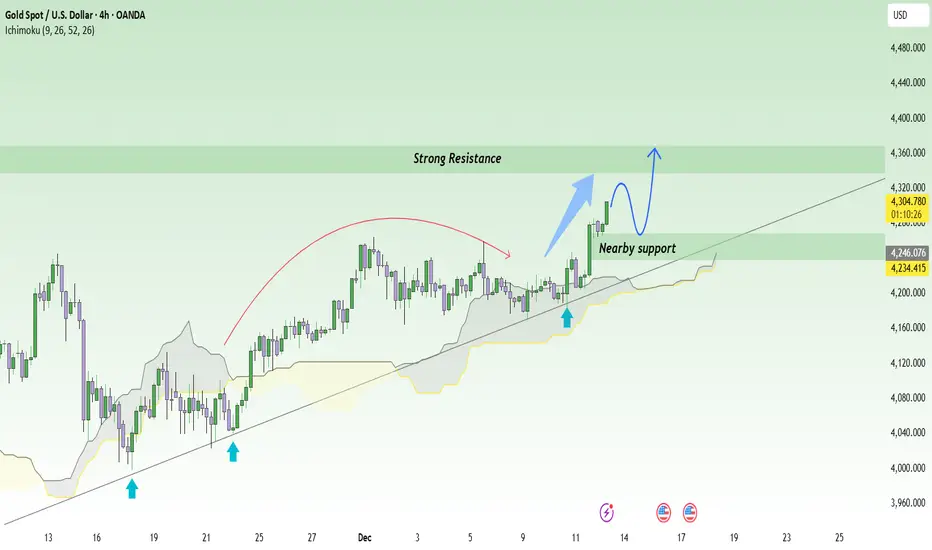
2. Technicals: Gold Holds Its Uptrend and Is Approaching Strong Resistance
Looking at the chart:
• XAUUSD is maintaining its position above the ascending trendline established since mid-November.
• Each time price touched the trendline, it bounced sharply — showing that buyers remain active.
• The nearby support at 4,270 is acting as a strong dynamic floor.
• Price is now approaching a major resistance zone at 4,360 – 4,370. With the current momentum, the likelihood of a slight pullback followed by a breakout is very high.
• If the breakout succeeds, the next target sits around 4,400 – 4,420.
=> A clean uptrend structure, nearby support, and strong momentum — buyers are fully in control.
3. Suggested Trading Setup
Prioritize buying with the trend.
Wait for a potential retest at 4,270 – 4,290 for an optimal entry.
A break above 4,370 will serve as a confirmation signal to scale in further.
BTC Isn’t FOMO — But It’s Not Ready to Drop EitherIf we look at BTC right now as a tug-of-war, the buyers are winning slightly — and consistently . Recent news continues to support a moderate risk-on environment , institutional capital has not exited Bitcoin , and the market lacks a shock strong enough to trigger a deep sell-off. As a result, the most reasonable scenario over the next 1–2 days is a gradual, controlled upside rather than a sharp vertical breakout.
From a technical perspective, the overall trend still leans bullish . Price is holding above a rising trendline and continues to find support on pullbacks. The 90,000 level stands out as a key psychological support and has repeatedly acted as a reliable base for rebounds. Ichimoku analysis shows price hovering around short-term equilibrium, suggesting the current move is more about accumulation and slow continuation than an aggressive rally.
The plan for a mild bullish bias is clear: prioritize BUY setups on pullbacks toward the 90,000–90,300 zone, especially if price shows strong holding behavior. If BTC regains momentum and stabilizes above this area, the next upside target sits near 94,000 as the upper resistance zone. Conversely, a clean break below 90,000 would weaken the bullish-light scenario and increase the likelihood of a deeper pullback for renewed accumulation.
In short, BTCUSDT is in a healthy, moderate bullish phase — not euphoric , but structurally supported. The real question now isn’t “will it go up?”, but rather: will you wait for a clean pullback to 90,000 for a safer entry, or step in as price starts pushing higher?

ZEC — Another -50% Drop AheadZEC has had one of the wildest runs this year, a +2000% explosion from August to November, all in just 80 days, before topping out at $750. Moves that go vertical like this tend to unwind just as aggressively, and ZEC did exactly that: a sharp –60% correction back into the $300 support zone.
That reaction wasn’t random, $300 was a major confluence level:
0.618 Fib retracement of the entire +2000% move
Weekly level lining up cleanly
0.786 Fib of the smaller impulsive wave
Altogether, an ideal spot for a bounce and that’s exactly what we saw. Looking at the current structure, here’s what I’d like to see next:
1. A move toward $500 → Short opportunity
$500 should now act as a psychological resistance level and would be the perfect area for a rejection.
2. A drop into the $250 region → Long opportunity
This zone is stacked with confluence:
0.702 Fib sweet-spot entry of the entire move
0.886 Fib retracement (deep retrace zone)
Weekly order block
Anchored VWAP
Monthly level
POC
This makes $250 a very attractive long-entry, with a simple target back toward $300.
Educational Insight
Parabolic moves like ZEC’s +2000% rally in such a short time almost never resolve sideways. When price accelerates this fast, the market typically needs time to rebalance value. This usually happens through deep retracements and distribution structures.
The first major retrace to the 0.618 Fib often acts as a relief bounce, which we already saw around $300. This bounce doesn’t mean the trend is healthy again it usually represents short covering and dip-buyers stepping in early. Structurally, these bounces often lead to lower highs, forming patterns like Head & Shoulders or broader distribution ranges.
Deeper retracement levels such as the 0.786 and 0.886 Fib tend to be where strong hands accumulate, especially when they align with:
Anchored VWAPs (fair value over time)
High-volume nodes (POC)
Higher-timeframe order blocks
Monthly or weekly levels
This is why the $250 zone stands out. It’s not just “another support”, it’s where multiple market participants agree on value, which increases the probability of a meaningful reaction.
On the flip side, psychological levels like $500 often attract late buyers and breakout traders during corrective rallies. When momentum fades into these areas, they frequently become ideal zones for short entries, especially if volume dries up or rejection wicks form.
Key takeaway:
Instead of chasing fast moves, focus on where value is likely to be defended or rejected. High-probability trades are built where structure, Fibonacci, volume, and VWAP all align.
In summary:
ZEC is offering two solid setups → one on the short side near $500, and one long near $250. Set alerts on both levels and wait for the reaction.
_________________________________
💬 If you found this helpful, drop a like and comment!

Is Rivian Setting Up For a Breakout?Hi Traders!
On Nov. 5th, Rivian created a daily bullish CHOCH pushing price to resistance at $18. The following weeks showed price returning back to retest that daily CHOCH. Since then, it looks to me that Rivian is working to complete a cup and handle pattern (Lower TFs).
IMO the daily and weekly look bullish, and Rivian could be setting up to break past resistance at $18. Therefore, my plan is to long swing Rivian to a potential target at $20. My ideal entry would be around/in between $16-$16.50, but when looking at a lower TF $17 area could be respected. Watching closely, and alerts are set!
*DISCLAIMER: I am not a financial advisor. The ideas and trades I take on my page are for educational and entertainment purposes only. I'm just showing you guys how I trade. Remember, trading of any kind involves risk. Your investments are solely your responsibility and not mine.*

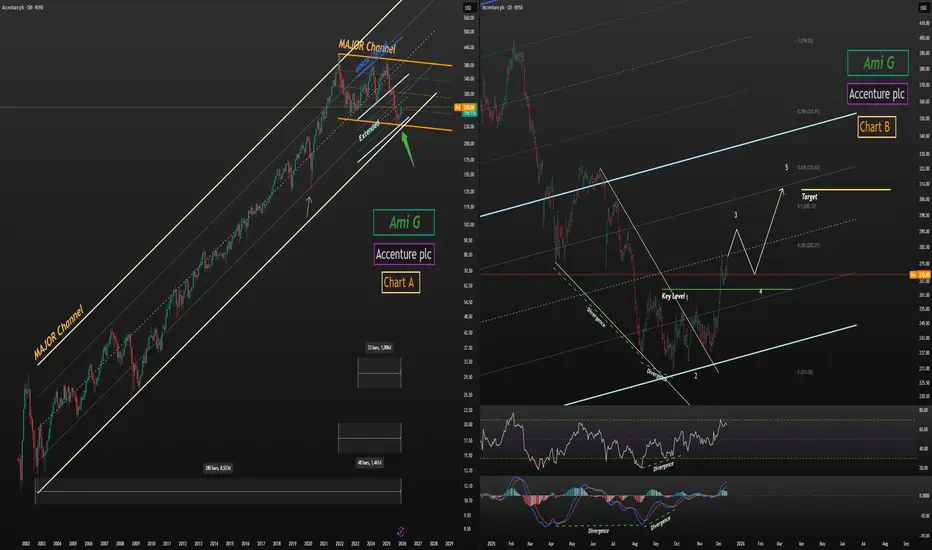
Accenture plc ACN Multi Timeframe Channel AnalysisAccenture plc (ACN) Multi Timeframe Channel Analysis
1. Long-Term Structure
This analysis is built on three major structural channels:
24-year channel
5-year channel
3-year extended channel
Price is currently positioned at a rare triple confluence zone, touching:
The bottom of the 24-year channel
The bottom of the 5-year channel
The extended lower boundary of the 3-year channel
This alignment significantly strengthens the probability of a medium-term bullish reversal.
2. Reversal Signals
At the channel confluence, price completed a clean Ending Diagonal pattern and reacted strongly, showing:
Powerful bullish divergences on momentum indicators
A decisive breakout from the diagonal structure
These signals collectively confirm a strong demand zone and a potential macro reversal.
3. Wave Count and Bullish Scenario
Following the breakout, price has started to build a five-wave impulsive structure.
After breaking its key level, ACN is now positioned in wave 3 of 3, which is typically the strongest part of the move.
Minimum upside target:
310
This level aligns with structural resistance and wave projections.
4. Final Notes
This is my personal analysis I’d be glad to hear your views.
For more detailed breakdowns and live swing trades on stocks, feel free to follow me on TradingView.
KPIT Technologies AnalysisPrice has taken strong support twice at the ₹1100–1150 demand zone.
Weekly structure is in accumulation with early signs of slow upside.
First resistance / target: ₹1550–1600.
Major supply zone: ₹1850–2000.
Bias stays neutral–bullish as long as ₹1100 holds.
Disclaimer: Educational only, not a buy/sell call.

Fed Cuts Rates, USD Weakens — Gold’s Moment Has Arrived!Based on the current market landscape, XAUUSD is entering a phase where buyers hold a clear advantage , supported by both favorable macro conditions and a technical structure that reinforces a new bullish leg. This is a period where gold isn’t rising just because of news — it now has a solid foundation to sustain its trend.
To begin with, the Fed’s 0.25% rate cut — from 4.00% to 3.75% — immediately pressured the USD. Lower rates naturally drive capital away from USD-denominated assets and toward safe-haven assets like gold. In addition, J obless Claims are projected to rise to 220K, up from 191K, signaling a slowing labor market. A weaker labor market often pushes the Fed further into an easing stance — a key catalyst that helps gold maintain its upward momentum.
On the chart, price is rebounding from the 4,190 support zone, an area that has repeatedly shown strong buying interest. The structure remains above the Ichimoku cloud, signaling that the medium-term uptrend is still intact . The accumulation happening directly inside this support area further strengthens the scenario of XAUUSD retesting the 4,240 resistance. As long as 4,190 holds, the bullish momentum is essentially “open and ready” for buyers.
Combining both fundamentals and technicals, gold is standing in front of a clear opportunity to extend its bullish expansion. This is a phase where the market is less noisy, the bullish bias is clean and decisive , and monetary policy is providing a solid launchpad. If buyers keep control above 4,190, the 4,240 target becomes only a matter of time.

XAUUSD Ready to Break Out – Strong Uptrend Ahead!Hello traders! Today, we will analyze the XAUUSD currency pair.
Fundamental Factors Affecting XAUUSD:
Fed rate cut: The Fed is expected to cut interest rates in the December meeting, which will weaken the USD and make gold a more attractive safe-haven asset for investors.
Geopolitical situation: The tensions between Russia and Ukraine continue to escalate, creating global instability and driving demand for gold as a safe-haven asset.
Weak economic data: Weak ADP employment data and GDP data from the US have increased market expectations that the Fed will maintain or cut interest rates, making gold even more attractive.
Technical Analysis:
On the chart, XAUUSD is currently trading within a clear upward trendline, with strong support at 4.170 USD. This is a price level that has been tested and bounced multiple times in the past, showing stability and the potential for continued growth.
The immediate resistance level for XAUUSD is at 4.220 USD, where the price has encountered resistance before. If XAUUSD breaks through this resistance, the price could continue moving towards higher targets, such as 4.250 USD.
Thank you for listening to my analysis, and I wish you successful trading!

EURUSD Poised for a Breakout as the Fed Turns DovishWhen looking at EURUSD right now, we can clearly see the shift in momentum: the Fed has become more dovish , while Europe is not rushing into easing . The USD weakened after the rate-cut decision, and the ECB delivered a more optimistic outlook on economic growth — creating a solid foundation for the next bullish leg on the euro.
On the H4 chart, price is moving within a steady ascending structure, supported by the rising trendline and the Ichimoku cloud. The zone around 1.1680 acts as the nearest support — aligning with both the trendline and the base of the previous breakout. A clean scenario would be a mild pullback into this area, confirming demand before pushing higher again. The psychological resistance at 1.1770 becomes the natural upside target if the bullish trend continues.
As long as EURUSD holds above 1.1680, the bias remains bullish with a clear preference for a buy-on-dip strategy, following the capital flow shifting away from the USD toward the euro. What remains is to see how price approaches 1.1770 — through a smooth retest or an additional false break before the real breakout. Either way, it opens the door for high-quality entry opportunities in the sessions ahead.
