Gold price around 4200 - market waiting⭐️GOLDEN INFORMATION:
Gold Price (XAU/USD) trades in negative territory around $4,195 during the early Asian session on Tuesday. The precious metal edges lower amid concerns that the US Federal Reserve (Fed) will adopt a hawkish tone in its rhetoric, despite delivering a rate cut on Wednesday.
Markets widely expect a 25 basis points (bps) rate cut at the Fed’s December meeting, with traders seeing a 90% probability, up from about 66% in November, according to the CME FedWatch tool. Traders will closely monitor the press conference and a Summary of Economic Projections, or ‘dot-plot,’ for fresh impetus. If the US central bank delivers a "hawkish cut," this could support the US Dollar (USD) and weigh on the USD-denominated commodity price.
⭐️Personal comments NOVA:
Gold price adjusted down around 4200, market mainly sideways before December interest rate
⭐️SET UP GOLD PRICE:
🔥SELL GOLD zone: 4258 - 4260 SL 4265
TP1: $4245
TP2: $4230
TP3: $4215
🔥BUY GOLD zone: 4162 - 4160 SL 4155
TP1: $4175
TP2: $4190
TP3: $4200
⭐️Technical analysis:
Based on technical indicators EMA 34, EMA89 and support resistance areas to set up a reasonable BUY order.
⭐️NOTE:
Note: Nova wishes traders to manage their capital well
- take the number of lots that match your capital
- Takeprofit equal to 4-6% of capital account
- Stoplose equal to 2-3% of capital account
Longsetup

Don’t Miss the GBPJPY Bullish Wave!If I had to choose a pair that’s been climbing steadily while most traders overlook it, right now it would be GBPJPY. The yen remains under pressure as markets doubt the BoJ will raise rates aggressively, while sentiment toward the British pound is more stable after recent budget developments. In short, the macro backdrop is leaning slightly toward GBP buyers over JPY .
On the H4 chart, price is holding beautifully above the rising trendline and above the Ichimoku cloud – classic signs of a strong trend with shallow pullbacks. The area around 206.5 is both horizontal support and aligned with the trendline, making it an ideal “launch point” for buyers. Above, we have the 207.9 resistance zone as the nearest target if price bounces as projected.
My preferred plan: wait for price to dip slightly toward 206.5 and watch how it reacts; if a clear bullish candle forms, buying with a first target at 207.9 makes sense. As long as price holds above the trendline and doesn’t break significantly below 206.5, I continue to treat GBPJPY as a buy-the-dip market rather than trying to short a trend that’s still moving smoothly upward.

Will the Sky clear for higher Goldprice? Week 8-12 DecContext: After a quiet week with little impact from economic data, Gold FX_IDC:XAUUSD has been moving sideways within a triangle structure. The US economy looks resilient—better than many expected—shifting all eyes to the FED rate cut decision this Wednesday. 🇺🇸👀
📅 Market Recap:
Mon Dec 1 (Asia Session): Price pumped +$60 up to $4264, only to dump -$101 back down to $4163, sweeping liquidity in the beginning of the US Session. 🧹
Consolidation: Since then, Gold has consolidated in a narrow range between $4190 and $4226. ↔️
Friday: US Inflation data was less dramatic than feared, but Gold still dropped around -$64, closing the week near $4191.
🔥 The Week Ahead:
We have key dates coming up, but with the Rate Cut Decision pending on Wednesday, data needs to be dramatic to force a major move before then.
Quiet/Choppy markets until Wednesday. 💤
The Exception: Tuesday, when US Job Data is released. 📊
🎯 The Trade Setup:
If the US Job Market remains stable, there is room for further downside. I am watching for a dip to sweep liquidity before looking for entries.
📉 Downside Targets (Buy Zones):
Primary Target: $4150 🥇
Secondary Target: $4110 🥈
There is strong support between this zones, so it is very possible the drop stops right at $4150 without reaching the second target.
🐂 Strategy: I see the market chopping sideways until the announcement. My plan is to look for LONG positions 🚀 if price sweeps into my targets ($4150 / $4110).
My last idea about was not longer valid because the right shoulder did not went down, but a Quasimodo pattern could be a thing... Maybee FED does skip the cut? Let's see...
-------------------------------------------------------------------------
This is just my personal market idea and not financial advice! 📢 Trading gold and other financial instruments carries risks – only invest what you can afford to lose. Always do your own analysis, use solid risk management, and trade responsibly.
Good luck and safe trading! 🚀📊

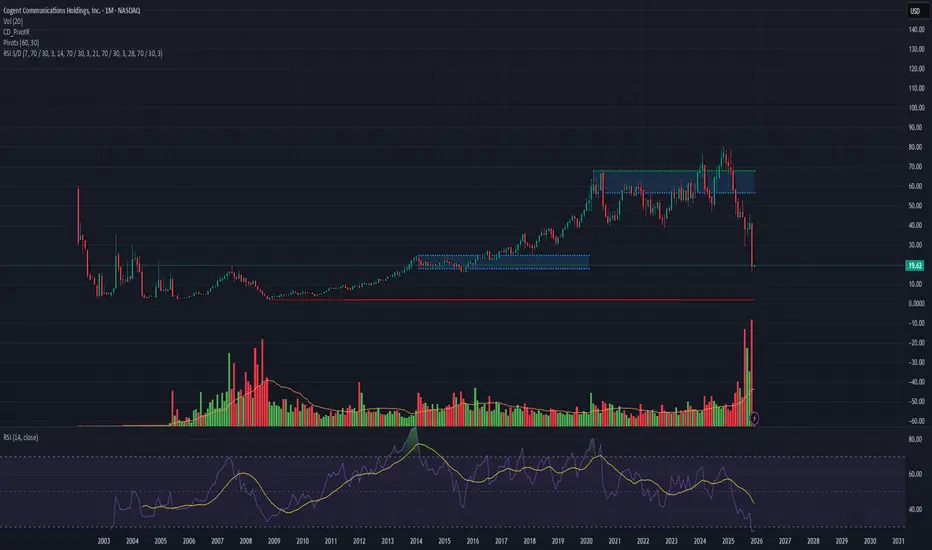
CCOI Fast Bounce Setup | 19.62 → 20.60(+5%)
CCOI just printed the highest monthly volume in its entire history since IPO 🔥
This type of volume spike often signals a short-term reversal or momentum bounce.
RSI Behavior 🔍
Across the daily, weekly, and monthly intervals, RSI has shown a repeated pattern of bouncing 10%–100% after oversold conditions.
Based on this history, a 5% bounce from here is completely reasonable and aligned with previous cycles 🎯📉➡️📈
Fundamentals 📊
Revenue forecasts are improving and gradually compensating for weaker past years.
This supports the upside even during a downtrend.
Risk Note ⚠️
Catching profit in a downtrend is always aggressive.
But the volume structure + RSI behaviour build a strong short-term case.
As always, we only select stocks with predicted revenue growth, that are oversold, and that show a repeated behavioural pattern in similar conditions.
Our strategy is not based on one fixed formula for all stocks.
Each symbol has its own unique pattern that repeats historically, and we focus only on that repeated behaviour. This is why every setup is different — it must match the stock’s own history. 🔍📈
Accumulate at the beginning of the week - the bulls wait⭐️GOLDEN INFORMATION:
Gold (XAU/USD) holds in positive territory near $4,205 in early Asian trading on Monday, supported by expectations of a Fed rate cut at Wednesday’s December meeting.
Although inflation remains above the 2% target, signs of a cooling labor market have strengthened the case for a quarter-point cut to support economic activity. Lower rates reduce the opportunity cost of holding non-yielding gold, helping keep the metal supported.
⭐️Personal comments NOVA:
Gold price maintains accumulation - stable around 4200. Market psychology waiting for big fluctuations this week
⭐️SET UP GOLD PRICE:
🔥SELL GOLD zone: 4250 - 4252 SL 4257
TP1: $4240
TP2: $4230
TP3: $4215
🔥BUY GOLD zone: 4170 - 4168 SL 4163
TP1: $4180
TP2: $4190
TP3: $4200
⭐️Technical analysis:
Based on technical indicators EMA 34, EMA89 and support resistance areas to set up a reasonable BUY order.
⭐️NOTE:
Note: Nova wishes traders to manage their capital well
- take the number of lots that match your capital
- Takeprofit equal to 4-6% of capital account
- Stoplose equal to 2-3% of capital account

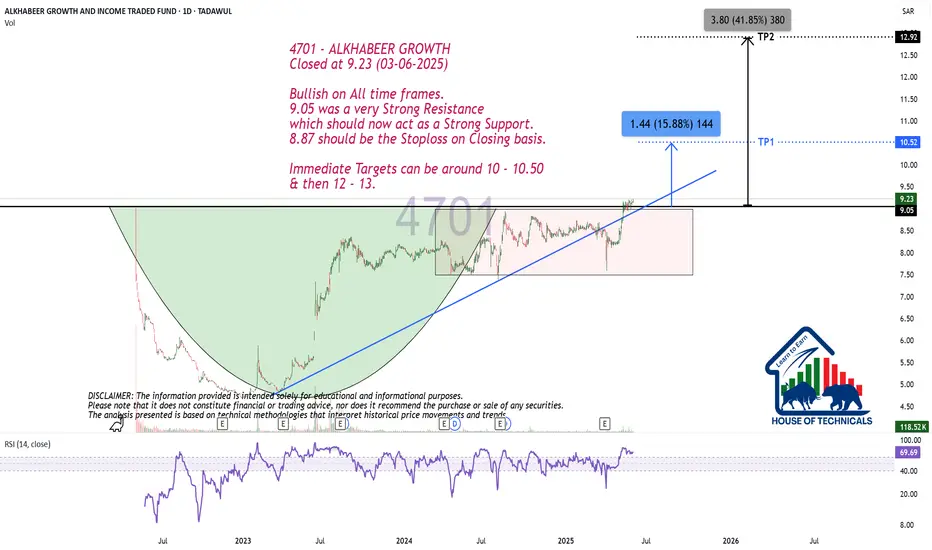
Bullish on All time frames.
Closed at 9.23 (03-06-2025)
Bullish on All time frames.
9.05 was a very Strong Resistance
which should now act as a Strong Support.
8.87 should be the Stoploss on Closing basis.
Immediate Targets can be around 10 - 10.50
& then 12 - 13.
XAUUSD – The Silent but Dangerous Upside Force!Gold is showing a truly silent climb , with price edging higher as the USD slips to its lowest level in five weeks . With markets almost certain that the Fed will cut rates on December 9–10 , capital is gradually shifting toward safe-haven assets. What is interesting here is that gold is rising quietly, as if the market is waiting for one more confirmation before a stronger move.
On the chart, XAUUSD is trading inside a compression pattern , forming higher lows and repeatedly bouncing from the lower rising trendline. Each time price approaches 4,246–4,250, sellers appear, yet the pullbacks remain shallow, showing that selling pressure is weak and buyers are still in control.
Strategy for now:
– Prefer waiting for a pullback toward 4,205–4,210
– Look for a clear bullish reaction
– Short-term target: 4,240–4,250
As long as gold holds above the rising trendline and does not break below 4,200, this remains a phase of accumulation before a potential breakout , rather than a reversal. Gold may not be rising aggressively, but it is rising with intention – and that is often the most important type of trend to pay attention to.

Euro Leads the Wave – Buyers Take the Advantage!If I had to choose a pair that is currently sailing with the wind , EURUSD would be the standout name. The expectation that the Fed will cut interest rates soon is weakening the USD, while improving eurozone data helps the Euro attract capital. The macro backdrop is clearly favoring the buyers more than the sellers.
Looking at the H4 chart, EURUSD is moving smoothly inside the rising channel . Price stays near the lower boundary of the channel, above the Ichimoku cloud and the 1.1640 support zone. This shows the uptrend is still intact and current pullbacks are mostly technical corrections .
My preferred scenario: wait for price to pull back around 1.1640–1.1650 , where price meets the channel + cloud, then look for bullish confirmation to buy with the trend. The near-term target is 1.1700, the resistance zone above. As long as EURUSD holds above 1.1640, every dip is still a chance to join the uptrend rather than trying to sell against it.

ETHUSDT – Big Reversal Zone TriggeredHi fellow traders,
On the 1D ETHUSDT chart, I am applying Elliott Wave principles to outline a potential long setup. Price is reacting strongly after completing a deeper correction, and the current structure suggests continuation to the upside within the larger impulsive sequence.
I am entering at the current price, with a Stop Loss at 2400. My Take Profit is positioned at 5267.34, targeting the next objective within this bullish structure.
If price drops below the stop level, this trade is no longer valid.
Structure first. Noise second.
Good luck and trade safe!

Accumulation trend - gold price around 4200✍️ NOVA hello everyone, Let's comment on gold price next week from 12/08/2025 - 12/12/2025
⭐️GOLDEN INFORMATION:
Gold (XAU/USD) firmed during Friday’s North American session, holding above $4,200 and heading for a flat weekly close as markets await next week’s Fed policy decision. The metal trades near $4,216 after retreating from intraday highs of $4,259.
The week ended with the Fed’s preferred inflation measure—Core PCE for September—showing little change, hovering closer to 3% than the Fed’s 2% target. While the data alone supports a policy hold, signs of a cooling labor market and dovish Fed commentary keep expectations tilted toward a rate cut
⭐️Personal comments NOVA:
Accumulation trend - waiting for bulls to increase price when interest rates decrease. Maintain stable above 4200
🔥 Technically:
Based on the resistance and support areas of the gold price according to the H4 frame, NOVA identifies the important key areas as follows:
Resistance: $4262, $4305
Support: $4185, $4141
🔥 NOTE:
Note: Nova wishes traders to manage their capital well
- take the number of lots that match your capital
- Takeprofit equal to 4-6% of capital account
- Stoplose equal to 2-3% of capital account
- The winner is the one who sticks with the market the longest

XAUUSD – Sideways Ahead of the CPI CatalystGold is currently in a “holding pattern” as the market waits for the U.S. CPI data on December 5. Rising U.S. Treasury yields are putting pressure on prices, but the USD dropping to a 1-month low is helping to cushion the downside. At the same time, labor data remains mixed — initial jobless claims fell sharply , while ADP reported a steep decline in private employment — leaving traders without a clear directional bias. As a result, XAUUSD is stuck in a sideways phase.
On the chart, gold is ranging between 4,200 – 4,280:
4,200 → strong support, aligned with the ascending trendline and Ichimoku cloud base.
4,280–4,300 → strong resistance where sellers consistently appear.
Price action shows buyers holding a slight advantage: candles repeatedly bounce from support, the trendline remains intact, and the Ichimoku cloud supports price like a cushion. However, bullish momentum is still not strong enough to break through 4,280 as the market remains cautious ahead of CPI.
Likely scenario: XAUUSD will continue oscillating within this sideways box — retesting 4,200 then moving back toward 4,280. A clear breakout will depend entirely on the CPI release:
Break above 4,280 → opens the path to 4,300+
Break below 4,200 → signals a deeper correction
For now, the best approach is range trading and waiting for a decisive signal after CPI.

BTC LONG TERM BULLISH Bitcoin will provide us with a simple and easy to understand pattern as when I check it for the last few years months and weeks , it has to fix itself and correct it’s structural highs and price , bitcoin will not fail or drop it will raise instead and carry on with its long term trajectory

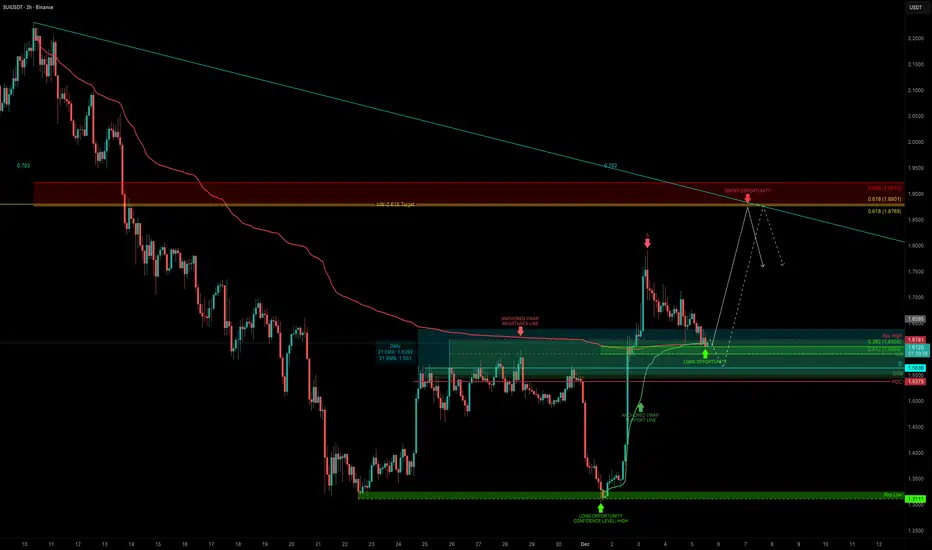
SUI: The Power of ConfluenceSUI just delivered one of the cleanest moves. After sweeping the liquidity low at $1.3111, price launched nearly +40% in under two days, ripping through a full 5-wave impulse and breaking market structure. Now that the fast move is done, the real question is:
Where’s the next high-probability setup?
To answer that, we break down the support/resistance zones, VWAP structure, Fibonacci levels, and market cap confluence that are now forming.
1. The Key Support Cluster at $1.60
To map the next setup, we first look for strong support. And right now, $1.60 is loaded with confluence:
Anchored VWAPs from both the swing low ($1.3039) and swing high ($2.231) meet at roughly $1.60
Fibonacci Retracement
The 0.382 retracement of the entire impulse sits exactly at $1.60. After fast moves, holding the 0.382 is typically what you want to see for bullish continuation.
Dynamic EMAs & SMAs: Daily 21 EMA → $1.64, Daily 21 SMA → $1.55.
These are dynamic tools, so they shift over time, but both are already closing in on the same zone.
Daily level at $1.5636
POC of the previous range at $1.5375.
Both overlap with the daily order block, adding confidence.
Monthly Anchored VWAP.
Currently around $1.5782, giving this area even more weight.
Market Cap Confluence
$1.60 ≈ 6B market cap
$1.87 ≈ 7B market cap
I like using market caps as macro support/resistance, and these levels line up beautifully. All in all, $1.55–$1.60 is shaping up as the main demand zone.
2. Upside Target → the 0.618 Fib
Using the retracement from the downward move
($2.231 → $1.3039), the 0.618 Fib sits at $1.8768.
This also lines up with the 7B market cap and previous resistance structure.
That makes it the main target for the next leg up.
3. Risk Management
An entry between $1.60-$1.55 with an SL below the POC / order block allows for:
R:R between 1:4 and 1:6 (depending on how you ladder)
Clear invalidation
Strong structural backing
Multiple layers of confluence
Summary
SUI swept a major low, completed a sharp impulse, and broke market structure. Now it’s retracing into what looks like a high-confluence long zone around $1.55–$1.60. If this support zone holds, the next target is $1.87, giving a clean and logical long setup with solid R:R.
🔍 Indicators used
Multi Timeframe 8x MA Support Resistance Zones → to identify support and resistance zones such as the daily 21 EMA/SMA.
➡️ Available for free. You can find it on my profile under “Scripts” and apply it directly to your charts for extra confluence when planning your trades.
_________________________________
💬 If you found this helpful, drop a like and comment!
Intermarket Perspective: Gold – Oil – Dollar IndexThree Markets, One Big Picture
If you want to understand where XAUUSD is now — and where it is likely to move next — you cannot look at gold alone.
In today’s market, Intermarket Analysis is essential to reading real money flow.
The three markets you must watch together are:
Gold – Oil – Dollar Index (DXY).
They interact like three gears in the same machine.
Let’s break down how these markets connect — and how professional traders use them to anticipate gold’s next move.
1. Gold – The Safe-Haven and Market Risk Barometer
Gold reflects expectations about:
Interest rates
Inflation
Geopolitical risk
Safe-haven flows
Important Principle:
Lower rates → weaker USD → lower yields → stronger gold.
Gold is extremely sensitive to the DXY and the U.S. 10-year yield.
But looking at USD alone is not enough — that’s where Oil enters the picture.
2. Oil – The Engine of Global Inflation
Oil is not “just a commodity” — it is the foundation of inflation.
When oil rises sharply:
Transportation costs rise
Production costs increase
Inflation spreads across the economy
This forces central banks to maintain or raise interest rates.
→ Higher rate expectations often pressure gold lower
→ And support the Dollar Index
In short:
Oil ↑ → Inflation ↑ → Fed turns hawkish → USD ↑ → Gold ↓
Not always 1:1, but this is the classic money-flow pattern.
3. Dollar Index (DXY) – The Global Money Compass
DXY measures USD strength against major currencies.
When DXY rises, it usually signals:
Higher interest rate expectations
Risk-off sentiment
Growing demand for USD
This typically:
→ Pressures gold downward
→ Impacts oil prices because oil is USD-denominated
Strong DXY = Weak Gold
Weak DXY = Gold has room to rally
4. How These Three Markets Interact
Scenario 1: DXY Up – Oil Up – Gold Down
→ High inflation, hawkish Fed, strong USD
→ Gold faces pressure due to rising yields
→ Oil may rise from supply issues or geopolitical tension
Scenario 2: DXY Down – Gold Up – Oil Flat or Down
→ Rate-cut expectations rise
→ Gold benefits most
→ Oil may lag due to supply-demand dynamics
Scenario 3: Oil Spikes – Gold & DXY Move Mixed
→ Inflation rises
→ DXY may strengthen
→ Gold can rise due to recession fears
This is usually a volatile phase filled with false signals.
5. As a Gold Trader, What Should You Watch?
(1) DXY
If DXY breaks its bullish structure → gold often prepares for a strong move.
(2) Oil
Rising oil pushes inflation up → gold may fall initially but can surge later if economic risks grow.
(3) Macro Data
Fed policy
OPEC decisions
CPI, PCE
Oil inventory data
U.S. employment numbers
These are the lifeblood connecting all three markets.

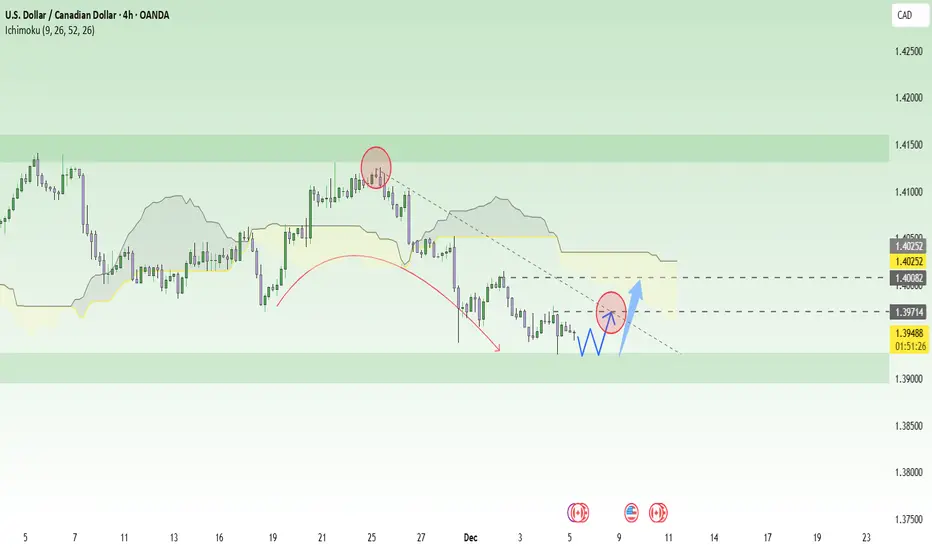
USDCAD – A “Soft Rebound” Forming at Defensive SupportUSDCAD is currently caught between two weak forces . On one side, the USD is losing momentum as markets almost fully expect the Fed to cut rates soon ; on the other side, the CAD isn’t strong either as Canada’s manufacturing data continues to weaken. These opposing forces neutralize each other, preventing a strong trend—but they do create room for a mild technical rebound from the current support zone.
On the H4 chart, USDCAD has slipped out of its upper consolidation range and gradually moved toward the support area around 1.3920, a level where price has reacted strongly multiple times before. The decline is slowing, with candles showing reduced volatility—signs that selling pressure is fading . Above, the zone around 1.3970, aligned with the lower edge of the Ichimoku cloud and the descending trendline, becomes a reasonable upside target for a rebound.
Preferred scenario: USDCAD may continue to test the floor near 1.3920, form a small accumulation pattern, then bounce for a light recovery toward 1.3970, possibly even sweeping slightly higher toward the cloud if USD sentiment stabilizes. However, this remains only a corrective move within a broader weakening structure. Therefore, the optimal approach is to look for short-term buys at support , take profits early at nearby resistance, and maintain strict risk management in a macro environment that remains highly uncertain.
EURUSD – The Dollar Weakens, Uptrend Takes OffIf there is one currency pair currently favored by macro conditions, EURUSD is clearly at the top. The U.S. dollar keeps weakening as recent economic data remains poor, with ADP showing a drop of 32,000 jobs , and expectations for a Fed rate cut next week rising sharply. Meanwhile, political uncertainty surrounding Trump’s plan to appoint a new Fed Chair further pressures the USD. In contrast, the euro is trading near a 7-week high and is on track for its strongest yearly gain since 2017.
On the 2H chart, EURUSD is moving cleanly inside an ascending channel : price is riding the lower boundary and gliding above the Ichimoku cloud — a sign of a strong bullish structure where dips are simply pauses. The area around 1.1640 acts as a key support level, aligning with the channel bottom, the Ichimoku cloud, and a small demand zone previously respected by the market.
The main scenario: price may dip slightly toward 1.1640 to accumulate liquidity, then rebound following the prevailing trend toward the 1.1700–1.1703 target zone, and potentially higher toward the channel top. As long as EURUSD stays above 1.1640 and does not close decisively below the Ichimoku cloud, the dominant direction remains bullish, favoring buy-the-dip strategies rather than counter-trend selling.

Golden Point Emerges – GBPUSD Buyers Take Full Control!As the USD continues to weaken steadily on expectations of a Fed rate cut, GBPUSD is stepping right into the “golden zone” of its bullish trend. The current chart is telling a very clear story: buyers are firmly dominating the market .
Recent data shows strong pressure on the USD: weak ADP numbers, the USD Index falling 0.5%, and the probability of a Fed rate cut rising to 89%. Meanwhile, the UK Services PMI has been revised upward, giving GBP additional support to continue its upward momentum. This is a rare combination — when a weaker USD + stronger GBP appear together, GBPUSD often gains a powerful and sustained bullish push.
On the chart, price is moving cleanly within an ascending channel and has just bounced strongly from the Ichimoku cloud — the perfect confluence zone between the trendline and the 1.3270 support. The recent rally pushed price into the 1.3400 resistance, causing some short-term noise, but the overall bullish structure remains fully intact .
Preferred scenario: wait for a mild pullback toward 1.3270, then look for a continuation of the uptrend targeting 1.3400. This will be a key level for buyers to challenge again if USD weakness persists in the short term.
In summary: fundamentals favor GBP , technicals pave the way for further upside, and GBPUSD is currently in a natural and steady bullish cycle.
For experienced traders, the priority is to buy the pullbacks , not chase the highs.

Bitcoin Weekly: The EMA 50 Test🎯 Why the EMA 50 Matters
The 50-week moving average is a simple trend line that traders watch:
✅ Trend signal – If price stays above it, the trend is up. Below it, the trend is down.
✅ Support/Resistance – It acts like a magnet that price bounces off.
✅ Everyone watches it – When many traders use the same level, it becomes real support.
📈 Scenario 1: REJECT (Price Goes Down)
Bitcoin bounces down from the EMA 50
Price falls back to ~$85–92K
Trend weakens temporarily
What to look for:
Weekly close below $99,553
Lower highs on daily chart
Selling pressure increases
📉 Scenario 2: BREAK (Price Goes Up)
Bitcoin closes above EMA 50 with strength
Price continues toward $120–128K
Trend stays strong
What to look for:
Weekly close above $99,553
Strong volume on the push up
Higher lows forming
🔮 Most Likely Outcome: DOWN FIRST, THEN UP
Probability:
Reject now: ext 1–2 weeks
Eventually breaks higher: ~70% (next 1–2 months)
📌 Simple Trade Plan
If you're bullish:
Buy dips near $85–87K (the blue line)
Stop loss below $83K
Target $120K+

RBA Turns Hawkish, USD Weakens – AUDUSD Surges Without Brakes!If I had to choose one pair that’s “waking up” thanks to the news flow, it would definitely be AUDUSD. The RBA maintains a clearly hawkish tone , Australian inflation remains high, and the economy continues to recover well. Meanwhile, across the Pacific, the market is increasingly expecting the Fed to begin cutting rates soon . The result? A weaker USD , while the Australian dollar attracts more capital — the perfect “tailwind environment” for a bullish trend.
On the 3H chart, AUDUSD is moving smoothly inside an ascending wedge , forming higher highs and higher lows, with price holding firmly above the Ichimoku cloud — a classic structure of a strong bullish market. After a brief shakeout at the lower boundary, buyers stepped in aggressively, engulfing the previous bearish candle and keeping price close to the upper edge of the wedge.
My preferred scenario: price may make a small pullback around 0.6570 to gather momentum, then continue pushing toward the target zone at 0.6630 — aligned with the upper boundary of the wedge and the next resistance area ahead. As long as the fundamental backdrop continues to favor AUD and the USD fails to regain strength, the most reasonable strategy is to buy with the trend , taking advantage of shallow pullbacks rather than trying to fight the rising wave of AUDUSD.

EURUSD Breaks Supply Zone – Looking for Long EntriesEURUSD has broken above a key 15-minute supply/resistance zone, showing strong bullish momentum. Price pushed through the blue resistance block with an impulsive breakout candle, indicating buyers are currently in control.
After the breakout, the market is expected to pull back into the broken zone for a retest, which now acts as new support. If bullish rejection appears on the retest, it can signal continuation to the upside.
🔹 Key Points
Price broke above a major consolidation resistance area
Breakout shows strength and confirms bullish market structure
A retest of the highlighted zone may provide a safer entry
As long as price stays above the retest zone, bullish continuation remains likely
🎯 Target
The next clean liquidity level / resistance area sits above the breakout, which acts as the first take-profit zone.
🛡 Invalidation
If price falls back below the zone and closes beneath it, the breakout becomes invalid and the bias shifts neutral.

GBPJPY – Buyers Stepping In at Critical LevelPrice has pulled back into a key higher-timeframe resistance-turned-support zone (highlighted in yellow). This area has acted as a major pivot level in the past, and current price action shows slowing bearish momentum as price consolidates inside the zone.
The recent candles (blue-circled area) show rejection wicks and compression, indicating potential exhaustion from sellers and early signs of buyer interest.
🔍 Market Structure
Overall short-term structure has been bearish, but price is now testing a major support zone.
If buyers step in and break above the minor intraday swing high, a bullish reversal structure could begin forming.
A clean break and retest above the local liquidity area would strengthen the probability of upside continuation.
🎯 Bullish Scenario (Preferred)
Hold above the yellow support zone.
Break above the first intraday high → confirmation of reversal.
Next target region around 206.50 – 207.00, aligning with the drawn projection.
⚠️ Bearish Invalidations
A strong breakdown below the support zone would invalidate the bullish setup and open the door for deeper downside continuation.

BTCUSDT – Bullish Reversal Setup at Key SupportBitcoin has made a sharp impulsive drop into a key higher-timeframe support zone (highlighted in yellow). This area has previously acted as strong demand, producing a significant bounce on Nov 27.
Price has now tapped back into this zone with a long lower wick, showing early signs of buyer absorption. If the support continues to hold, this area offers a potential long (buy) entry, as marked on the chart.
🔹 Key Points
Support Zone: 86,800 – 87,400
Entry Area: After confirmation within support (marked “ENTER”)
Market Reaction: Strong sell-off into support followed by initial rejection (blue circle)
Bias: Bullish as long as support holds
🎯 Target
Upside continuation toward 90,500 – 92,000 (target zone on chart)
⚠️ Invalidation
A clean break and candle close below the support zone would invalidate the long setup.

Is the Bullish Wave Returning – EURUSD Heating Up?With the U.S. dollar becoming “exhausted” amid expectations that the Fed may cut rates soon, EURUSD is acting like an athlete who has just had the weights removed — lighter, faster, and ready to accelerate. The news backdrop is very clear: weak U.S. data, markets almost certain the Fed will ease, and Eurozone inflation ticking up to 2.2%, giving the ECB little reason to cut rates early. A weak USD combined with a supported EUR creates the perfect combo for a bullish EURUSD trend.
On the H4 chart, price is moving smoothly inside an ascending channel, forming higher lows one after another. EURUSD has just broken above the Ichimoku cloud and is approaching the upper resistance zone, showing that buyers are still in control. The area around 1.1650 is acting as the new support: if price pulls back here, I see it as a healthy breath of accumulation, not a reversal signal.
Preferred scenario: wait for a light retest around 1.1650, watch for a rejection candle, and then look for buys following the main uptrend, targeting 1.1720 — the resistance zone indicated on your chart. As long as EURUSD stays above 1.1650 and no major USD-boosting news appears, my primary outlook remains: buy with the trend, buy on dips, and avoid chasing green candles at the top.
