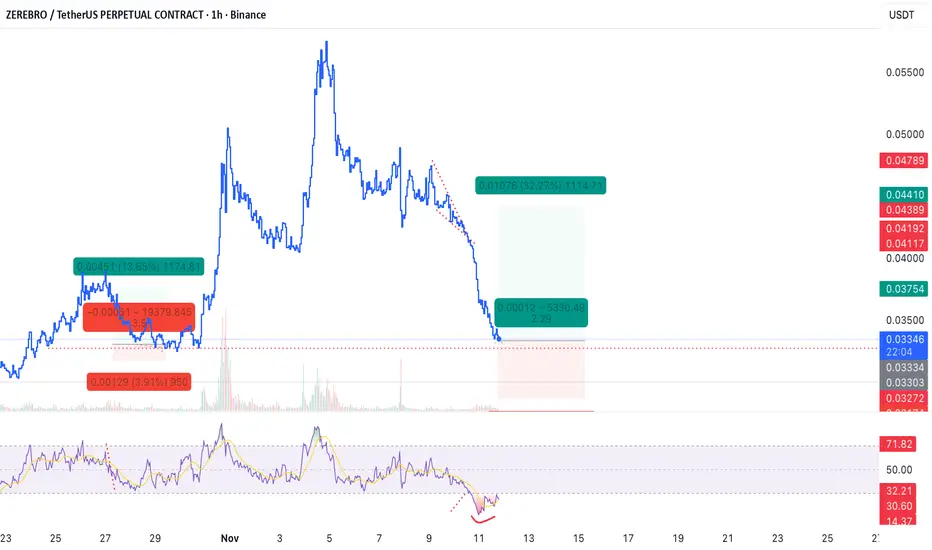
Scalp Long – ZEREBRO📈 Scalp Long – ZEREBRO
Extreme oversold conditions on the 15-minute timeframe, with RSI dropping as low as 10. A strong bullish divergence is forming, signaling high potential for a sharp rebound. This is one of those setups I simply can’t ignore.
🎯 Trade Setup:
Take Profit (TP): 0.04410
Stop Loss (SL): 0.02875
Risk/Reward Ratio (RR): 1 : 2.11
A high-conviction long setup backed by deep oversold signals and a clear bullish divergence.
Longsetup
Scalp Long – MMT📈 Scalp Long – MMT
Price is holding at a strong support zone after completing a clean breakout and successful retest. Consecutive bullish divergences have appeared, signaling potential upward momentum.
🎯 Trade Setup:
Take Profit (TP): 0.491
Stop Loss (SL): 0.4074
Risk/Reward Ratio (RR): 1 : 2.7
A solid long setup supported by multiple bullish signals, confirmed breakout structure, and strong reaction at key support.

Scalp Long – MANA📈 Scalp Long – MANA
Price is holding firmly above a strong support zone. Buying pressure has reappeared on the 5m and 15m timeframes, signaling potential upward momentum. A short-term move to retest the local high is likely.
🎯 Trade Setup:
Take Profit (TP): 0.2328
Stop Loss (SL): 0.2184
Risk/Reward Ratio (RR): 1 : 2.2
A clean long setup supported by solid demand and renewed bullish momentum — ideal for a precise scalp

The 3 Pillars of Dow Theory – Break One and the Trend FailsMost traders hear about Dow Theory but don’t truly understand that:
A trend only truly exists when all three pillars agree.
Break just one pillar, and the “trend” you see on the chart may be nothing more than an illusion.
Here are the three “holy pillars” that determine every trend:
1. First Pillar: Price Trend – Price Action as the Foundation
Dow made it very clear:
“The market discounts everything.”
Meaning every piece of news, expectation, fear, and sentiment is already reflected in price action.
To identify the trend:
Uptrend when: Higher Highs – Higher Lows (HH–HL)
Downtrend when: Lower Highs – Lower Lows (LH–LL)
If there’s no HH–HL or LH–LL?
→ No trend exists.
→ Any buy/sell decision is basically guessing.
2. Second Pillar: Volume – The Confirmation of a “Real” Trend
A rising trend with weak volume → fake rally, pushed by “echoes,” not real money.
A falling trend with exhausted volume → high risk of an aggressive reversal.
Volume is the fingerprint of real capital flow.
Strong uptrend → volume must rise
Strong downtrend → volume must expand
Weak trend → volume gradually decreases → early reversal warning
If price moves one way but volume moves another → One of them is lying. And price usually ends up turning around.
3. Third Pillar: Inter-Market Confirmation – “No Market Moves Alone”
This is the part most traders ignore.
Dow believed:
A trend is only valid when confirmed from multiple perspectives.
In Dow’s era, this meant:
– Transportation Index
– Industrial Index
Today, we interpret it more broadly:
BTC rising? → Midcap altcoins or on-chain metrics must confirm.
SP500 rising? → Nasdaq or the Dow Jones should move in the same direction.
XAUUSD rising? → DXY or yields must show weakness.
If one index rises while its “siblings” stay flat or move opposite →The trend is unreliable.
WHY ALL 3 PILLARS MUST ALIGN
Think of a trend as a house:
- Price Action → the foundation
- Volume → the steel structure
- Cross-index confirmation → the supporting walls
Missing 1 element → the house stands, but very weakly.
Missing 2 → it collapses for sure.
Have all 3 → the trend becomes strong, durable, and hard to break.

XAUUSD: Bulls Are Ready to Break Out!Gold is showing a powerful comeback as both fundamentals and price action are shifting in favor of the bulls. Global investors are betting that the reopening of the U.S. government and the full release of economic data will pave the way for the Fed to cut interest rates next month. In an environment of economic uncertainty and rising expectations of monetary easing, gold naturally becomes a highly attractive safe haven.
On the chart, the uptrend remains clear as XAUUSD continues to trade steadily within its ascending channel. Recent pullbacks have been purely technical, not signs of a reversal. The nearby support around 4,090 is acting as a crucial launching zone. As long as price stays above this area, the bulls remain firmly in control.
In the short term, the next key target is 4,240, where the market will likely test the true strength of bullish momentum before deciding the next leg.
If you're waiting for a clear trend signal, gold is showing exactly that: the bullish pressure hasn’t stopped—every dip is simply creating another opportunity for buyers to step in.

Ares - Long Strong Uptrend Structure
Even after the recent pullback, ARES is still maintaining a higher-lows structure, which is a sign that buyers are defending the price.
The stock bounced from a demand zone and is now pushing upward again — a sign of renewed momentum.
Volume Profile Support
A large amount of volume has traded around the $150–154 zone, which creates what's called a high-volume node.
This acts as a support area because many investors established positions there — buyers defend these levels.
Fundamentals
Ares is one of the largest global private equity and asset management firms, benefiting from:
Higher interest rates → increased demand for alternative financing.
Strong asset inflows → recurring management fees (stable revenue).
Asset managers historically perform well in bullish market cycles.
ARES shows:
Uptrend structure
Volume support at current price
Potential breakout setup
Good risk/reward setup, especially if price holds above $152.

Scalp Long – BTC📈 Scalp Long – BTC
RSI has printed two strong bullish divergences on the 15m timeframe, signaling clear momentum reversal. Higher timeframes are also deeply oversold, suggesting selling pressure is exhausted. If this isn’t a buy zone, it’s hard to imagine a better one. A recovery bounce is highly probable as liquidity rotates back into the market.
🎯 Trade Setup:
Take Profit (TP): 103,490
Stop Loss (SL): 92,945
Risk/Reward Ratio (RR): 1 : 3.39
A disciplined long setup based on multi-timeframe oversold conditions and repeated bullish divergence

GBP/USD Set to Plunge: Rate Cut Pressure and Weak Data!Currently, the GBP/USD pair is under strong selling pressure following macroeconomic news from the UK. Weak GDP data of only 0.1% in Q3/2025 , along with the government's cancellation of the planned income tax hikes, has raised concerns about the financial stability of the UK economy. This has fueled expectations that the Bank of England (BoE) may be forced to cut interest rates soon, further pressuring the British Pound.
From a technical perspective, GBP/USD is still heavily influenced by the descending trendline. The pair has failed to break the strong resistance at 1.3200, indicating that the downward trend remains intact. The nearest support level is 1.3100, and if this is broken, 1.3020 will be the next target.
In conclusion, with the pressure from macroeconomic factors and technical signals, the likelihood of GBP/USD continuing its decline in the near future is very high. Traders may consider opening a SELL position when the price approaches the resistance zone.

USD/JPY – Strong Upside Potential After a Steady RecoveryThe USD/JPY pair is continuing its strong upward trend, with 154.000 acting as a key support level. Data from Japan and the U.S. show that the USD remains strong , while the Japanese Yen is weak due to the Bank of Japan's loose monetary policy.
Looking at the chart, USD/JPY is trading in a clear ascending channel , with 153.400 serving as strong support. The pair is approaching a strong resistance at 155.500 and could continue towards this level if the current bullish momentum is maintained. However, if the price adjusts slightly to 154.400, it will present an opportunity to increase long positions.
Conclusion: With the strong bullish trend and solid support at 153.400, USD/JPY is likely to continue rising in the short term. If the 155.500 resistance is broken, the next target will be 156.000. The pair has enough momentum to reach higher levels in the upcoming trading sessions.
Recommendation: Open a BUY position if the price adjusts to 154.400 and monitor for a breakout of the strong resistance at 155.500.

Gold price continues to recover, accumulating above 4200⭐️GOLDEN INFORMATION:
Gold (XAU/USD) trades higher near $4,185 in early Asian hours on Friday, supported by expectations that the reopening of the US government will resume economic data releases and strengthen bets on additional Fed rate cuts.
The longest shutdown in US history ended on Thursday after President Trump signed a funding bill, which passed the House in a 222–209 vote with broad Republican support and a few Democratic votes. Investors now expect upcoming post-shutdown data to show labor market softness, potentially pressuring the US Dollar (USD) and providing near-term support for the USD-priced metal.
⭐️Personal comments NOVA:
Gold price is still in an uptrend, recovering above 4200. Liquidity scan of H1 breakout price zone 4147 completed and recovered.
⭐️SET UP GOLD PRICE:
🔥SELL GOLD zone: 4288 - 4286 SL 4293
TP1: $4270
TP2: $4255
TP3: $4240
🔥BUY GOLD zone: 4100 - 4102 SL 4095
TP1: $4115
TP2: $4130
TP3: $4145
⭐️Technical analysis:
Based on technical indicators EMA 34, EMA89 and support resistance areas to set up a reasonable BUY order.
⭐️NOTE:
Note: Nova wishes traders to manage their capital well
- take the number of lots that match your capital
- Takeprofit equal to 4-6% of capital account
- Stoplose equal to 2-3% of capital account

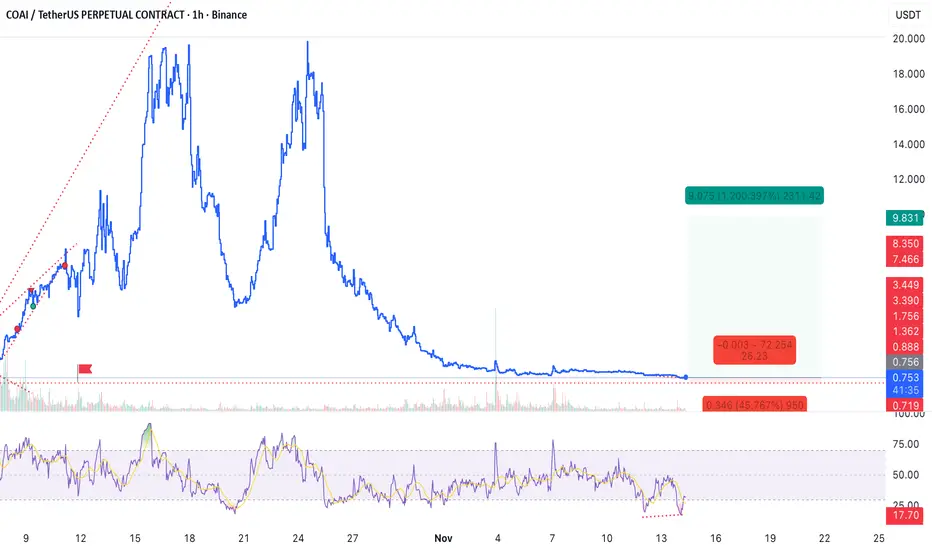
HIgh risk - High reward – COAI📈 HIgh risk - High reward – COAI
RSI is heavily oversold on both the 1h and 4h timeframes, with a clear bullish divergence forming on the 15m. Price has experienced a deep and extended decline from the local high, signaling exhaustion of selling pressure. A recovery bounce from this zone is highly probable. This is a high-risk, high-reward setup, requiring strict adherence to the stop-loss.
🎯 Trade Setup:
Take Profit (TP): 9.831
Stop Loss (SL): 0.438
Risk/Reward Ratio (RR): 1 : 26.23
A disciplined long entry targeting a strong rebound driven by extreme oversold conditions and bullish divergence.
EURUSD – Why the Bulls Will Explode in the Coming DaysLooking at the market right now, there’s no denying that EURUSD is in a "heating up" phase. After a series of macroeconomic news that caused the USD to lose momentum, the euro has seized the opportunity to shine and break out powerfully. The Fed scaling back its interest rate hike expectations, along with weakening signals from the U.S. economy, has created a pivotal turning point for EURUSD, opening up a huge opportunity for the bulls.
Looking at the chart:
EURUSD has decisively broken through the important resistance level at 1.1600, with no signs of slowing down. The 1.1560 support level now acts as a solid launchpad for the price to continue its upward journey. The strong "higher lows" structure is gradually forming, showing that the bulls are in full control, and each current pullback is simply an opportunity for traders to enter.
What lies ahead?
The 1.1650 level will be the next key point to watch, where a strong resistance test is likely. If EURUSD continues to maintain this upward momentum, the path towards 1.1700 is very much achievable.

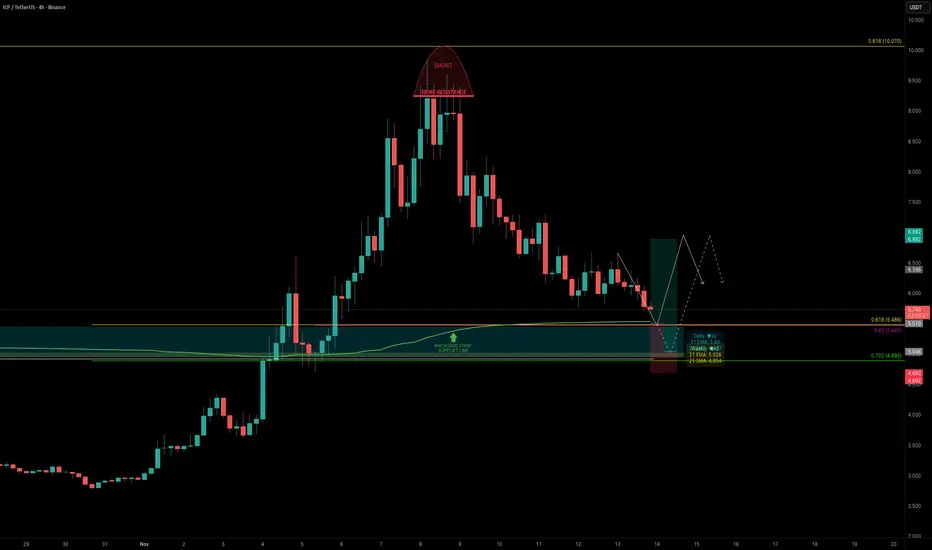
ICP — Identifying the Next High-Probability Long OpportunityICP had a great start to November, rallying over +250% in just 8 days before topping out just below the 0.618 Fibonacci retracement (~$10), right at the $3B MC resistance.
Over the past 5 days, ICP has retraced -42% from the high. The key question now: where is the next high-probability long opportunity?
Key Confluences around the $5.5 Zone
One level that stands out strongly is the $5.5 zone, where several major supports align:
0.618 Fib retracement of the entire +250% rally
0.85 Fib retracement of the smaller internal wave aligns right with the major 0.618 level
Anchored VWAP (280 day) clustering right around $5.5, adding volume-weighted support
Quarterly VWAP currently sits near $5.62
Daily 21 EMA at $5.45
Weekly 21 EMA/SMA both at around $5
$5.5 = $3B market cap
Point of Control (POC) of the past ~280 days sits around $4.9, marking it as the final major support layer below
🟢 Trade Setup Plan
Entry Zone: $5.6 – $5.0
Stop-Loss: Below POC
Targets:
TP1: $6.0
TP2: $6.9 (VWAP resistance / 0.382 Fib)
TP3: 0.618 FR
Risk/Reward: 1:2+, depending on entry precision
🔍 Indicators used
Multi Timeframe 8x MA Support Resistance Zones → to identify support and resistance zones such as the daily/weekly 21 EMA/SMA.
➡️ Available for free. You can find it on my profile under “Scripts” and apply it directly to your charts for extra confluence when planning your trades.
_________________________________
💬 If you found this helpful, drop a like and comment!
Crane - Long Strong Bounce from Demand Zone
Price touched a major demand zone around $184–186 (visible on the volume profile where the biggest pink blocks are).
Buyers defended that level multiple times — this shows institutional accumulation, not selling.
Volume Profile Support
The largest volume cluster is below the current price, meaning:
“Most market participants are already positioned below — the path of least resistance is upward.”
Sideways Accumulation = Energy Build-Up
The price has been moving sideways in a tight range (consolidation).
This usually happens before a breakout.
Consolidation at the top of a move is bullish; it's not distribution.
Trend Shift
After months of lower highs, CR broke structure and formed a higher high, then pulled back into the volume support and held.
That's a textbook trend reversal pattern.
Earnings already priced in
No heavy sell-off after earnings → market sees results as stable/neutral.
Market didn’t dump the stock — bullish signal.

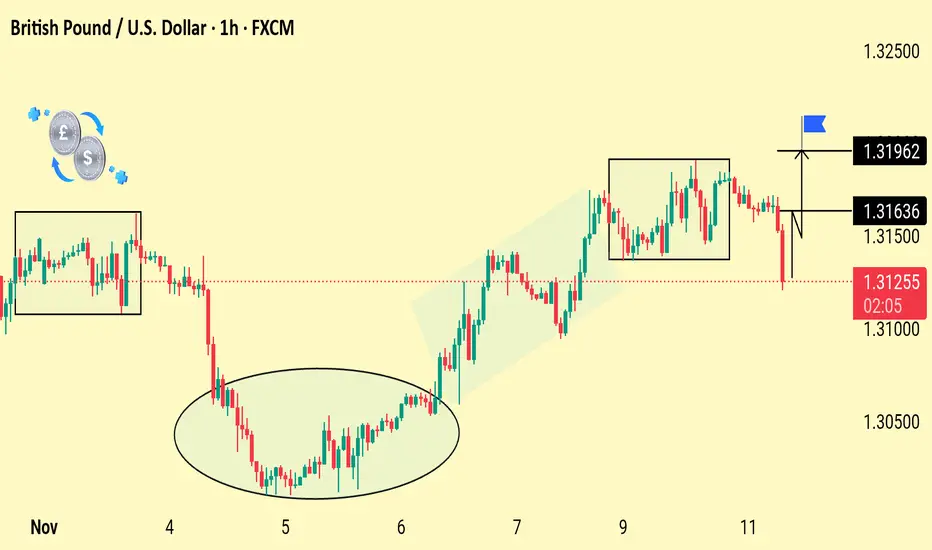
GBP/USD Breakout Watch: Key Levels in FocusGBP/USD is trading inside a consolidation zone after a sharp recovery. A breakout above 1.31636–1.31962 may signal bullish continuation, while failure to hold support increases downside risk.
Price dropped out of the recent consolidation box and is now trading below 1.31636 support. This breakdown shows short-term bearish pressure. If the pair stays below this zone, it may retest lower levels toward the recent lows. Bulls need a quick recovery back above 1.31636 to regain control.
Gbpusd long setupFPMARKETS:GBPUSD looks bullish for wave 5, as the correction wave is completed. Price has broken the previous high 1.31647 & after a retrace till 1.30842, which is also in a OB and near fino level, high possibility of price to change the trend toward bullish. Please watch the chart carefully, below is the buying zone , with proper risk management one can take entry.

Gold price recovers to 4250, nearest target⭐️GOLDEN INFORMATION:
Gold (XAU/USD) extends its rally to around $4,195 during the early Asian session on Thursday, marking its highest level since October 21. The metal gains ground as investors await a crucial US House vote to end the record-long government shutdown, which could bring economic clarity and shape the Federal Reserve’s (Fed) next policy steps. Later in the day, Fed officials Neel Kashkari, Alberto Musalem, and Beth Hammack are scheduled to speak.
The House of Representatives is expected to vote on the Senate-approved funding bill, backed by Democrats, to reopen the government and restore federal operations through January 30.
⭐️Personal comments NOVA:
Bulls are positive, expecting the final cut in December. Gold prices return to the above 4200 price zone.
⭐️SET UP GOLD PRICE:
🔥SELL GOLD zone: 4252 - 4250 SL 4257
TP1: $4240
TP2: $4220
TP3: $4200
🔥BUY GOLD zone: 4148 - 4146 SL 4141
TP1: $4160
TP2: $4175
TP3: $4190
⭐️Technical analysis:
Based on technical indicators EMA 34, EMA89 and support resistance areas to set up a reasonable BUY order.
⭐️NOTE:
Note: Nova wishes traders to manage their capital well
- take the number of lots that match your capital
- Takeprofit equal to 4-6% of capital account
- Stoplose equal to 2-3% of capital account

Scalp Long – SQD📈 Scalp Long – SQD
Price is holding firmly at a key support zone, with price action signaling a potential move to retest the local high. On lower timeframes, strong buying volume has appeared, and RSI has broken out into the bullish zone — indicating growing momentum.
🎯 Trade Setup:
Take Profit (TP): 0.08338
Stop Loss (SL): 0.06964
Risk/Reward Ratio (RR): 1 : 3.46
A high-RR long setup supported by strong buying pressure, bullish RSI breakout, and clear reaction at major support.

GBPUSD About to Collapse? The Final Pullback Before the Drop!The British Pound (GBP) is under significant pressure after recent data showed that wage growth in the UK has slowed , increasing the likelihood that the Bank of England (BoE) will cut interest rates in its upcoming meeting. Meanwhile, the U.S. dollar (USD) has seen a mild rebound as optimism grows over the U.S. government ending its longest shutdown in history . Market sentiment is shifting in favor of the greenback, causing GBP/USD to continue weakening .
On the H2 timeframe, the pair remains in a clear downtrend , restrained by the long-term descending trendline and the Ichimoku cloud. Each time the price approaches the 1.3160 resistance zone, strong selling pressure emerges, confirming that bears are still in control .
Currently, GBP/USD is consolidating just below resistance , and the pattern suggests a possible retest of 1.3160 before resuming its decline. If the price fails to break above this level, the next downside target will be 1.3060, aligning with the previous low and a short-term support area.
In summary, the primary trend remains bearish , and every pullback should be viewed as an opportunity to sell with the trend. Bears maintain the upper hand unless the price decisively breaks above 1.3160.

Gold Regains Its Shine as Buyers Take Control of the Market!Hello traders,
After days of consolidation, gold surged sharply during the Asian session , reclaiming the key psychological level of $4,000/oz. The weakness of the U.S. dollar, combined with expectations that the Federal Reserve may cut interest rates in December , has reignited investor optimism. Meanwhile, efforts by the U.S. Congress to end the government shutdown have further strengthened gold’s position as a safe-haven asset.
On the chart, gold is showing a strong rebound from the $4,000 support zone , where buyers previously stepped in with significant volume. The potential scenario suggests that price may pull back slightly toward $4,000 before continuing its climb toward the $4,200 resistance area, which aligns with the previous swing high and a key supply zone.
If price breaks above $4,200, the bullish momentum could extend further , targeting the $4,300 area in the medium term. Market sentiment remains firmly in favor of the bulls, and gold appears ready for a fresh breakout this week .
Wishing you all successful trades!

CHN ready to runCHN has demonstrated encouraging developments after emerging from a descending wedge pattern, bolstered by a bullish RSI divergence and the formation of a bull flag on the hourly chart. Furthermore, the daily chart reveals hidden bullish divergence, complemented by support from a trendline established in July and a .05 Fibonacci retracement level. A decisive move above $2 would serve as a strong indicator of a structural shift, potentially paving the way for a more substantial upward trend. Good luck and happy trading! 🍀

There might be sudden pump in $LKQ If we can stay above $31,10 we are about to go toward $34. Lets see how this will play out. Good luck for you all

Gold price recovered around 4100⭐️GOLDEN INFORMATION:
Gold (XAU/USD) holds near a three-week high during the Asian session on Wednesday, with bulls eyeing a breakout above the $4,150–4,155 resistance zone for further upside. Market sentiment remains supported by expectations that delayed US economic data will reveal weakness amid the ongoing government shutdown, reinforcing bets on another Federal Reserve (Fed) rate cut in December. This dovish outlook keeps the US Dollar (USD) near a two-week low, providing additional support for the non-yielding metal.
⭐️Personal comments NOVA:
Gold price recovers, accumulates around 4100. Buying force is forming wave 4 according to Elliott.
⭐️SET UP GOLD PRICE:
🔥SELL GOLD zone: 4198 - 4200 SL 4205
TP1: $4190
TP2: $4175
TP3: $4160
🔥BUY GOLD zone: 4090 - 4092 SL 4085
TP1: $4105
TP2: $4120
TP3: $4135
⭐️Technical analysis:
Based on technical indicators EMA 34, EMA89 and support resistance areas to set up a reasonable BUY order.
⭐️NOTE:
Note: Nova wishes traders to manage their capital well
- take the number of lots that match your capital
- Takeprofit equal to 4-6% of capital account
- Stoplose equal to 2-3% of capital account
