EURUSD – Bears Remain in Control Despite Temporary USD WeaknessAlthough U.S. consumer confidence data showed a slight decline in October, which may lead to a short-term correction for the USD, the overall trend of EURUSD remains bearish.
On the chart, price has broken below the short-term ascending channel and is forming a series of lower highs — a clear signal that buying momentum is weakening. The 1.1645 zone serves as the nearest resistance, aligning with the descending trendline . Price may see a minor rebound toward this area before continuing its decline.
The 1.1608 level is a short-term support to watch — a decisive break below it could open the door for further downside toward the 1.1570 – 1.1550 zones.
While there are expectations that the Fed may cut rates by 0.25% , given that the U.S. economy remains relatively stable, any USD pullback is likely to be technical rather than a shift in the broader trend.
Longsetup

AUD/USD: Buy Opportunity, Forecast for Continued Rise!The AUD/USD pair has shown strong signs of upward movement in recent days. This is especially true in the context of strong economic data from Australia, particularly core inflation, and the expectation that the RBA will not cut interest rates in the short term, which has strengthened the AUD. Additionally, the market continues to maintain confidence in Australia's monetary policies.
The 4-hour chart shows that the AUD/USD pair is in a clear uptrend, breaking through previous resistance levels and staying above the rising trendline. The pair is now approaching the resistance at 0.66500; if this level is broken, the price could continue to rise towards 0.66800 or higher in the short term. The nearest support level is 0.65800, where the price is creating a new bottom and maintaining the upward trend.
Conclusion: With strong economic data and support from solid resistance levels, AUD/USD is likely to continue rising in the short term. Traders can consider buying near the 0.65800 support zone with a target towards 0.66500.

Scalp Long – COOKIE💎 Scalp Long – COOKIE
Price is recovering and preparing to break out of the short-term downtrend, signaling a potential shift in momentum.
🎯 Plan:
→ Enter after confirmation of breakout and retest.
→ TP: 0.1216 | SL: 0.086 | RR: 1 : 5.25
Momentum favors the long side.
Keep entries precise, trail SL as price advances.
Patience is key — only engage once the setup fully confirms.

GBPCAD Weekly 50SMA testPrevious idea failed at the 200SMA which is why tight SL was key. Now testing a stronger support at the weekly 50SMA and a daily support level dating back to early August. Tight SL for this kind of play. Fundamentally, BoC rate cut today should play a factor in the long hypothesis but the conference after the rate decision leaned towards a hawkish stance.

USDCHF Bullish Flag Pattern most of bullish flag patterns gets their targets they are called bullish patterns but dont forget to put STOPLOSS .

Scalp Long – EVVA💎 Scalp Long – EVVA
RSI is oversold on both 15m and 1h timeframes, showing seller exhaustion.
Price is holding above strong support, while buying volume is surging again — signaling a potential rebound.
🎯 Plan:
→ Enter after confirmation of bullish reversal.
→ TP: 12.317 | SL: 8.685 | RR: 1 : 2.24
Market structure supports a recovery move.
Keep entries precise, trail SL as momentum builds.
Stay disciplined — act only on a confirmed setup.

Scalp Long – COOKIE💎 Scalp Long – COOKIE
RSI has completed its correction and is now in the strong buy zone.
Buying volume is surging, showing renewed market strength.
Price is moving to retest the previous local high, signaling bullish continuation.
🎯 Plan:
→ Enter after confirmation of momentum continuation.
→ TP: 0.1251 | SL: 0.0911 | RR: 1 : 2.49
Market structure favors the long side.
Keep entries clean, trail SL as price climbs.
Stay focused — only engage when the setup confirms.

Ethereum is deciding where it wants to live.This is not a trade idea, this is a long term concept, most of my portfolio is swing when bull market comes (monthly/yearly) not trade (daily/weekly).
This is a solid question that will have to be played out in the upcoming years, Ethereum keeps changing its monetary policy and right now has less supply increase than BTC (due to burning mechanisms), will that stay forever? What will happen in the future to the policy? What it will mean for price?
Right now we can clearly see this is a bull case for future months.

XAU/USD Strong Rally: Will Gold Continue Its Upward Trend?XAU/USD has experienced a strong recovery , bouncing back from the key support zone around 3,950,000. This short-term rebound is driven by a combination of factors, especially the positive market sentiment following expectations that the Federal Reserve (Fed) may cut interest rates. Hopes for economic stimulus measures have increased demand for gold as a safe-haven asset, particularly in the context of economic and geopolitical instability .
Looking at the chart, we can see that the price of gold is respecting an upward trendline, creating higher lows. This indicates that the bullish momentum remains intact after recent pullbacks. The price is currently hovering around 4,018,210, near a short-term resistance zone.
Support Zone: The most recent low near 3,950,000 has held strong, acting as a key support level.
Resistance Zone: The short-term resistance lies around 4,080,000, which is a critical level to watch if the upward momentum continues. A break above this level could lead to further upward movement.
The next market move will depend on whether the price can maintain the 4,000,000 level. Traders should monitor price action around these key levels to confirm a breakout or a correction.

Gold price recovers - resistance zone 4000⭐️GOLDEN INFORMATION:
Gold (XAU/USD) bounces from an Asian session low near $3,916, edging away from a three-week trough hit on Monday. The metal’s pullback from record highs appears to pause, though gains remain limited as traders await the Fed’s policy decision, with a rate cut widely expected on Wednesday.
⭐️Personal comments NOVA:
Gold prices are recovering, as the market is looking forward to today's FED interest rate cut, regaining the 4000 mark.
⭐️SET UP GOLD PRICE:
🔥SELL GOLD zone: 4050 - 4052 SL 4057
TP1: $4040
TP2: $4030
TP3: $4020
🔥BUY GOLD zone: 3886 - 3884 SL 3879
TP1: $3900
TP2: $3910
TP3: $3925
⭐️Technical analysis:
Based on technical indicators EMA 34, EMA89 and support resistance areas to set up a reasonable BUY order.
⭐️NOTE:
Note: Nova wishes traders to manage their capital well
- take the number of lots that match your capital
- Takeprofit equal to 4-6% of capital account
- Stoplose equal to 2-3% of capital account

GBPUSD – Weak Rebound Before Returning to the Downtrend?After a brief technical recovery, the British pound is losing momentum as recent data shows inflationary pressure in the UK continues to cool. The UK Shop Price Index fell for the first time since March, while food prices recorded their sharpest decline in nearly five years — clear signs that inflation is easing faster than expected.
This increases the likelihood that the Bank of England (BoE) will soon loosen its monetary policy, leading to a slight weakening of GBP against the USD.
On the H4 chart, GBPUSD is trading within a descending channel that has extended since early October. The recent swing highs continue to form lower, reflecting strong control by the bears.
Currently, price is retracing toward the 1.3400 zone, where the descending trendline, the EMA34, and a previous static resistance converge. This area is seen as a key barrier — if the price fails to break above it, GBPUSD is likely to turn lower toward 1.3300, possibly retesting 1.3250 in the short term.
Overall, the main trend remains mildly bearish , with the USD maintaining strength while the GBP remains weighed down by rate-cut expectations.

XAUUSD – Bearish Pressure After Historical HighsGold prices continue to experience significant downward pressure as profit-taking surges after a strong rally. From the historical peak of nearly 4,400 USD/ounce, gold has lost nearly 12 million VND per tael , and is at risk of falling further if the 4,000 USD/ounce level cannot hold.
On the H4 chart, XAUUSD is forming a bearish trend with a clear price structure. Gold is facing a downward trendline , and each recovery from the lows encounters strong selling pressure . Currently, the price is hovering around 3,935 USD, near the support zone at 3,990 USD, and could drop further to 3,750 USD if this level fails to hold.
Key factors affecting the price:
USD recovery: The strengthening of the US dollar and rising US Treasury yields have reduced gold's appeal, as it does not yield interest.
Increased risk appetite: Progress in US-China trade talks is drawing funds towards equities and industrial commodities.
Trading Strategy: Sell gold around 4,000 USD, with a target of 3,750 USD, and stop loss above 4,050 USD.
Conclusion: XAUUSD remains in a mild bearish trend, with further downside potential if the 4,000 USD level is broken.

Scalp Long – OG💎 Scalp Long – OG
RSI indicates strong oversold conditions, forming a double-bottom pattern that suggests a potential reversal.
Price is consolidating, while buying volume is gradually increasing, showing signs of a recovery setup.
🎯 Plan:
→ Enter after confirmation of bullish breakout from the accumulation zone.
→ TP: 13.63 | SL: 10.38 | RR: 1 : 5.98
Market structure favors a rebound.
Keep positions lean, trail SL as price gains momentum.
Stay patient — only enter once the setup confirms clearly.

Scalp Long – BAT💎 Scalp Long – BAT
Buying pressure is strengthening, and price is preparing to break out of the short-term downtrend to retest the previous local high.
RSI has already broken its prior bearish structure, confirming bullish momentum.
🎯 Plan:
→ Enter after breakout confirmation and retest.
→ TP: 0.1806 | SL: 0.1632 | RR: 1 : 2.78
Momentum favors the long side.
Keep entries clean, trail SL as price advances.
Stay patient — only engage when the setup fully confirms.

NHPCi Observed these Levels based on Price Action and Demand & Supply which is my own Concept "PENDAM CONCEPTS"... Please don't take any trades based on this chart/post... Because this chart is for educational purpose only not for Buy or Sell Recommendation... Thank Q

Gold Compresses Before the Fed Storm– Sideways or a Sudden Drop?Good day, fellow traders,
Looking at the current XAUUSD chart, this is truly a highly sensitive phase. After last week’s sharp decline, gold has been narrowing its range within a contracting triangle pattern on the 4-hour timeframe, with lower highs and higher lows — a clear sign that the market is “building pressure” before a potential breakout.
At the moment, price is hovering around 4,070 USD/oz, just below the EMA34 and EMA89 lines — indicating that sellers still hold a slight upper hand. The key support zone lies around 4,040, while the strong resistance level sits near 4,220, where a bearish reaction could occur if price retests that zone.
Combining this with the latest news — the USD continues to strengthen while the market awaits the upcoming FOMC meeting — I lean toward a sideways-to-slightly-bearish scenario over the next 24 hours. Price could fluctuate between 4,060–4,100, then drift lower to retest 4,040 or even 3,950, unless the Fed delivers an unexpectedly dovish tone.
In summary, XAUUSD is in a compression phase , awaiting a major catalyst. Without fresh bullish factors, the short-term trend remains sideways-bearish, with mild downside risk before any potential technical rebound.

EURUSD – When the Green Light Begins to ShineHello traders,
On the 4-hour chart, EURUSD is showing signs of shifting from a consolidation phase to a clearer mild uptrend . The price has found a solid base near the 1.1595–1.1600 area, rebounding from the ascending trendline and now aiming for resistance around 1.1710 — a level where a stronger breakout could occur if buying momentum strengthens.
Not just technically, but also fundamentally, recent Eurozone economic data such as PMI and consumer confidence beating expectations , combined with a softer USD as markets await the Federal Open Market Committee (FOMC) decision, are creating a favorable backdrop for the euro to attract capital inflows.
Thus, the most likely short-term scenario is that EURUSD might dip slightly toward ~1.1600 for momentum , then bounce up toward ~1.1710. If this move is confirmed by a clean breakout above resistance, it could mark the start of a more sustainable bullish trend.
In short, traders should wait for technical confirmation from support and a breakout above resistance before stepping in. It may not be a dramatic surge, but it’s a steady and promising bullish opportunity — the “golden bull” of EURUSD looks ready to move.

BULLISH ON GBP/CADGBP/CAD has completed its pullback to a nice demand/support zone and is now showing bullish presence.
I will be buying GBP/CAD looking to make 100-200 pips to the previous swing high.

GBPJPY's Reversal BaseHi Traders!
When looking at GJ, the chart seemed messy as it was in a range for a long time. After finally breaking out of the 200s, priced reach a Weekly OB area in the 203s.
Over the past weeks or so, GJ created a counter trend dipping back into the high 200s area with what it appears to be a reversal base. If this reversal is true, I would be planning swinging this trade into the next resistance areas around 206-207. That will bring price to a previous Monthly Bearish OB.
Despite of how the chart has looked, the trend remained bullish. Therefore, IMO, GJ seems to want to keep its bullish momentum.
Good luck to everyone!
*DISCLAIMER: I am not a financial advisor. The ideas and trades I take on my page are for educational and entertainment purposes only. I'm just showing you guys how I trade. Remember, trading of any kind involves risk. Your investments are solely your responsibility and not mine.*

IDOL - Scalping Long
💎 Scalp Long – IDOL
The buying zone has been re-confirmed, and the recovery trend is clear.
Price is backtesting the previous high — a sign of accumulation before a potential breakout.
Buying volume is surging, showing that capital is flowing back in.
🎯 Plan:
→ Enter after a candle confirms support hold.
→ TP: 0.0373 | SL: 0.02909 | RR: 1 : 3
Short-term structure favors the long side.
Keep the position light; trail SL as price moves higher.
Stay patient — don’t chase, only act when the setup is complete.

Scalp Long – WCT💎 Scalp Long – WCT
RSI is in the buying zone, and price is holding firmly above key support.
Buying volume is returning, indicating renewed bullish momentum.
The market is testing the local high, showing signs of strength.
🎯 Plan:
→ Enter after confirmation of support hold.
→ TP: 0.1848 | SL: 0.1696 | RR: 1 : 3.14
Structure supports the long bias.
Keep the position lean, trail SL as price climbs.
Stay disciplined — enter only when the setup confirms.

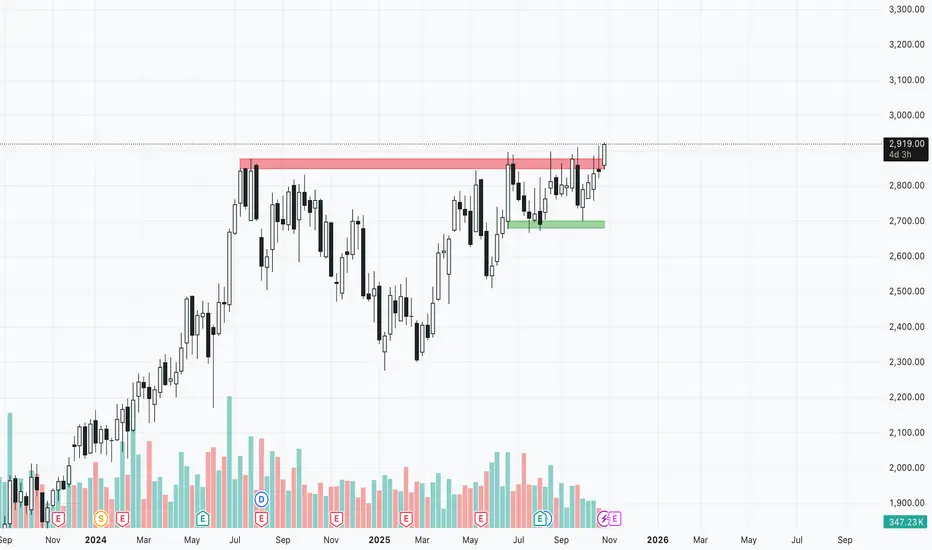
GRASIM - Weekly Breakout?Chart Analysis :
Price sustaining and breaking out above its major resistance of 2895-2910 zone. Price made a long consolidation of 67 weeks/ 15months and now breaking out.
Daily close above 2910-2920 will confirm breakout and can be considered for long.
Key Levels:
Entry level : Above 2920
Targets : 3000 psychologically imp level can move more if breaks out above 3000 (Trailing with day low SL post breakout is the suggested strategy)
StopLoss : Day close below 2820
Disclaimer:
I am not SEBI registered. This analysis is for educational purposes only and not investment advice. Please do your own research before trading or investing.
Scalp Long – ZEREBRO💎 Scalp Long – ZEREBRO
RSI has broken out of the corrective trend, signaling renewed momentum.
Price is holding above strong support, with buying volume surging.
The market continues its path toward testing the local high.
🎯 Plan:
→ Enter after confirmation of support strength.
→ TP: 0.04164 | SL: 0.03586 | RR: 1 : 3.5
Momentum aligns with the long side.
Keep the position tight, trail SL as price advances.
Stay patient — only execute when the setup confirms.
