EURUSD – Pressure Returns, Bears Take ControlThe Euro is facing renewed pressure after the Bank of Italy lowered its 2026 growth forecast to just 0.7%, citing the impact of U.S. tariffs. This has raised concerns that the Eurozone’s overall growth may slow further, potentially forcing the ECB to consider policy easing sooner, which in turn could weaken the EUR against the USD.
On the H4 chart, price remains below the main descending trendline, confirming that the downtrend is still dominant. After a weak rebound toward 1.1700, selling pressure quickly returned. If price fails to break above this resistance zone, EURUSD is likely to continue falling toward the 1.1570 support area, where previous lows and a key demand zone align.
Trading plan:
Sell on pullback around 1.1680 – 1.1700
Stop loss: above 1.1730
Take profit: near 1.1580 – 1.1570
The bearish momentum remains strong, and with Europe’s economic outlook turning increasingly gloomy, sellers have every reason to stay in control.
Longsetup

GBP/USD: Bearish Pressure Ahead of UK BudgetThe British Pound is currently under bearish pressure amid unfavorable economic factors in the UK. The forecast for UK CPI inflation in September is only 3.9%, lower than the central bank's expectations. This could lead to more dovish expectations for monetary policy, putting pressure on GBP.
Additionally, the UK's budget announcement on November 26 will be another crucial factor. Until clear information from the budget is released, the British Pound is likely to remain in a "frozen" state with limited upward movement.
Technically, GBP/USD has reached resistance at 1.34500 and is experiencing a significant pullback. If the price fails to hold support at 1.32500, the likelihood of further decline to 1.32000 is high.
In conclusion, with weak fundamental factors and a bearish technical trend, the probability of GBP/USD continuing to decline is quite high in the near future.

USDJPY Long #confluence country #trade the stacks. OANDA:USDJPY
Fundamental: Bullish (5)
Technical: Bullish (6/7) — actionable threshold met (≥6)
20-word summary: Dollar-yen supported by rate differentials; EMAs aligned; momentum constructive; watch 152 zone and intervention risk while trend persists this week.
Actionable Trade (Long): ATR 1.181 → SL distance 1.79512; Stop 150.08088; TP 156.54331 (2.6R).

USDJPY: Waiting for a pullback signal on the lower timeframe
* Trend: assessed using at least three trend indicators, with market structure as the primary guide.
** Weak or Reversal Signals: Assessed based on one of our criteria for trend reversal signals.
*** Support/Resistance: Selected from multiple factors – static (Swing High, Swing Low, etc.), dynamic (EMA, MA, etc.), psychological (Fibonacci, RSI, etc.) – and determined based on the trader’s discretion.
**** Our advice takes into account all factors, including both fundamental and technical analysis. It is not intended as a profit target. We hope it can serve as a reference to help you trade more effectively. This advice is for informational purposes only and we assume no responsibility for any trading results based on it.
George Vann @ ZuperView

GBPJPY – Recovery signals within the descending channelThe GBPJPY pair is showing clear signs of technical recovery after a strong downtrend. Recent fundamental developments are also supporting a short-term bullish outlook, mainly due to the weakening of the Japanese yen driven by political expectations and monetary policy stance in Japan.
1. Fundamental Outlook
The yen is under downward pressure as Sanae Takaichi, known for her pro-stimulus and dovish stance, is widely expected to become Japan’s next Prime Minister. In addition, BOJ Governor Ueda indicated that the central bank is not in a hurry to raise interest rates, which further reduces the appeal of holding JPY.
=>Impact: A weaker JPY, supporting an upside move in GBPJPY.
Meanwhile, in the UK, the British pound remains stable as recent fiscal reports show that the national budget remains under control, easing concerns about fiscal risk and giving GBP additional support.
2. Technical Perspective
On the 1-hour chart, GBPJPY continues to trade within a descending parallel channel, but the price has rebounded from the 201.5 support zone, which aligns with the lower boundary of the channel.
The EMA34 and EMA89 are narrowing, indicating that the bearish momentum is fading.
The price could recover toward the 203.0 area, which coincides with the upper boundary of the channel. If buying pressure strengthens and price breaks above this level, the bullish extension toward 204.2 – 205.0 would become a realistic scenario.

XAUUSD – Bullish Trend Remains DominantHello everyone,
Gold has made an impressive breakout, doubling in value over the past two years, and is now approaching the 4,400 USD/ounce level. However, this also raises concerns about the potential formation of a speculative bubble, which could lead to a market collapse similar to previous gold investment frenzies.
Nevertheless, the current uptrend is still supported by strong macroeconomic factors. Expectations for continued US rate cuts and the demand for gold as a safe-haven asset amid political instability in the US continue to push gold prices higher.
Additionally, on October 20th, gold surged due to the instability created by the US government shutdown, prompting investors to turn to gold as a value-preserving asset while awaiting US-China trade negotiations and upcoming inflation data from the US.
Technical Analysis
XAUUSD is moving strongly within an ascending channel, currently trading around 4,345 USD, near the previous highs.
The key support is at 4,240 USD – if the price adjusts back to this level and holds, the uptrend will likely continue.
Short-term targets: 4,430 USD (TP1) and 4,500 USD (TP2).
RSI indicates strong bullish momentum with no signs of reversal.
Conclusion
With favorable macroeconomic conditions and strong technical trends, gold maintains its bullish trajectory. Minor pullbacks may provide buying opportunities with a target at the 4,500 USD region.

Bulls continue to pressure new ATH⭐️GOLDEN INFORMATION:
Gold (XAU/USD) retreats slightly from record highs in Tuesday’s Asian session, though a deeper pullback remains limited by a supportive fundamental outlook. The US Dollar’s three-day rebound weighs on the metal, while upbeat equity sentiment further restricts its safe-haven appeal.
⭐️Personal comments NOVA:
forming a bullish DOW structure on the H1 frame, gold price returns to the old ATH 4380
⭐️SET UP GOLD PRICE:
🔥SELL GOLD zone: 4450 - 4452 SL 4457
TP1: $4430
TP2: $4410
TP3: $4390
🔥BUY GOLD zone: $4279-$4277 SL $4272
TP1: $4290
TP2: $4315
TP3: $4330
⭐️Technical analysis:
Based on technical indicators EMA 34, EMA89 and support resistance areas to set up a reasonable BUY order.
⭐️NOTE:
Note: Nova wishes traders to manage their capital well
- take the number of lots that match your capital
- Takeprofit equal to 4-6% of capital account
- Stoplose equal to 2-3% of capital account

XAUUSD: Shakeout Before the Next Takeoff?Gold dropped more than 2% on October 17 after hitting a record high above $4,340/oz . The main reason came from a strong rebound in the U.S. dollar and President Donald Trump’s more dovish remarks . He stated that a “comprehensive” tariff on China would be unsustainable and confirmed plans to meet with the Chinese President — a move that helped ease trade tensions and cooled down safe-haven demand.
On the H4 timeframe, gold remains within a steady ascending channel, though currently undergoing a short-term correction after touching the upper resistance boundary. The EMA34 around $4,187 serves as temporary support, while the $4,130 zone — aligned with the main ascending trendline — acts as stronger support. The technical structure suggests a likely pullback before the uptrend resumes.
The preferred scenario is that gold will dip toward $4,130, where buyers may step back in. If this level holds and forms a higher low pattern, price could rebound toward $4,350, a key resistance zone overlapping the previous high.
The overall trend remains bullish, but a technical correction is needed to build momentum for the next rally.
Trading Plan: Wait to buy around $4,130 – $4,140, set SL below $4,090, and take profit at $4,280 – $4,350.
This pullback looks only temporary — the bulls are still in control. Let’s see how gold reacts around $4,130 before its next upward leg.

SOLUSDT – Short-Term Bearish BiasHello traders,
In my view, SOLUSDT is likely to lean toward a slightly bearish trend in the coming sessions. The preferred strategy is to sell the rally when price approaches the confluence zone around 196–199. Currently, Solana is testing the descending trendline that has been in place since early October — a level that has previously formed multiple tops and faced strong rejections.
News Overview:
The recent listing of the Solana ETF in Hong Kong is a positive sign for the medium term. However, the broader crypto market remains under pressure due to uncertainty in the United States , as ETF approvals are delayed by the government shutdown and the unclear regulatory stance from the SEC. This has limited short-term speculative capital and created a cautious sentiment across the market.
In addition, rumors claiming that a Solana ETF was approved in the U.S . have been refuted by Reuters and Bloomberg, indicating that the market may have overreacted to unverified information. This kind of overhype often leads to short-term corrections following technical rebounds.
Technical Analysis:
On the 4H timeframe, SOL is clearly moving within a downtrend structure, forming a series of lower highs and lower lows.
The 196–199 zone aligns with the descending trendline, the EMA89, and a key dynamic resistance level.
Price is showing weak reaction in this area, suggesting that buying momentum is fading.
If a rejection candle pattern or SFP (swing failure pattern) appears near 197, it could be a good opportunity to enter short positions.
The near-term target lies around 182–175, a strong support zone where price previously bounced. If 175 breaks, the decline could extend further toward 170–168.

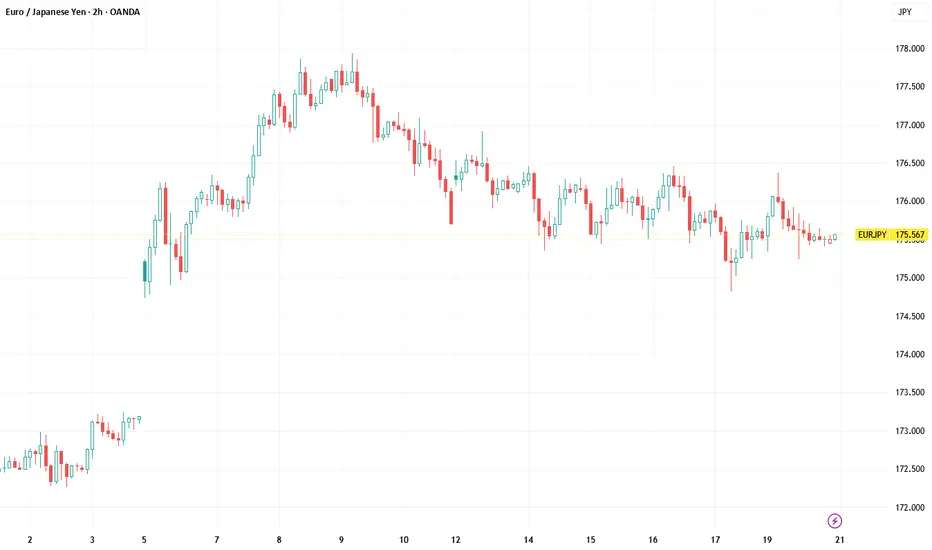
EURJPY Long We stack confluence and exercise patients.
OANDA:EURJPY
Fundamental: Bullish (5/5) — supportive Euro with persistently soft yen; carry friendly.
Technical: Bullish (6/7) — Actionable — 3 EMA bull, RSI > 50, MACD > 0; ADX 22.92 confirms trend. Stop 1.5215 | TP 3.9560.
20-word view: Fundamentals and technicals align higher with rising trend strength. Favor pullback longs toward EMA cluster while ADX stays firm and positive DI leads.
Accumulation → Manipulation → Bullish Distribution PhaseInitially, price entered an accumulation phase, where smart money quietly built long positions after a downtrend.
This was followed by a manipulation phase, marked by sideways movement and false breakouts.
During this stage, liquidity was grabbed both above and below key levels — typical of a "spring" or shakeout.
Retail traders likely got trapped as price faked moves in both directions.
This consolidation allowed large players to accumulate more positions at optimal prices.
Now, price is breaking structure to the upside, showing signs of strength and momentum building.
Volume is starting to support the bullish move, and candles are closing higher with conviction.
This behavior indicates price is entering a distribution to the upside, where smart money offloads into strength.
We are likely to see a continuation of the move higher in the short to mid term.
Upside targets could be defined based on previous resistance or Fibonacci levels.
Invalidation would be a clean break below the manipulation zone low.
Until then, the structure remains bullish.
Look for bullish continuation patterns or retests as potential entry opportunities.
Patience and proper risk management are key in this phase.

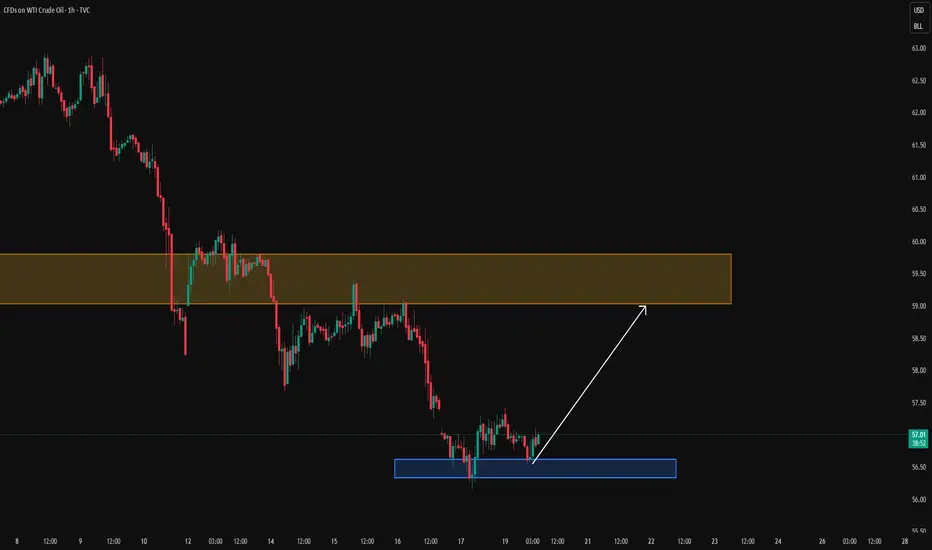
USOIL: Buy setups during higher-timeframe correctionOIL PRICE WEEKLY OUTLOOK
(Week of Oct 20-24, 2025)
Key Drivers & Risks
Updates in Supply, Demand, and Geopolitical News
EIA (week ending Oct 10): Crude inventories +3.5 million bbl; distillates −4.5 million bbl.
IEA OMR (Oct 2025): Upgraded global supply forecast: +3.0 mb/d in 2025 and +2.4 mb/d in 2026, while demand grows only ~0.7 mb/d per year ⇒ signaling a large surplus risk and downward pressure on prices.
OPEC (Oct 2025): Maintains demand growth outlook of +1.3 mb/d for 2025, but acknowledges a smaller deficit in 2026 as OPEC+ output rises; September production increased by ~630 kb/d.
Maritime risk in the Red Sea / Gulf of Aden: Over the weekend, a gas carrier reportedly caught fire following a possible attack off Yemen’s coast, leading to higher shipping risk premiums, though no major disruption to trade flows has been reported yet.
Watchlist for the Week Ahead
EIA Weekly Report (Oct 22): Focus on crude and distillate inventories, and any signs of policy or flow adjustments.
Maritime security updates in the Red Sea / Gulf of Aden / Strait of Hormuz — monitor frequency and severity of incidents.
China data: imports, refinery runs, and inventories — potential signals of stockpiling at lower price levels.
Any notable demand-side surprises (if any emerge).
Overall View
Oil prices are expected to gradually decline within a relatively narrow range of $70–$50 through mid-2026.
Short-term rebounds may occur due to low price levels and heightened transport risk headlines.
China’s potential restocking activity could provide limited demand-side support.
* Trend: assessed using at least three trend indicators, with market structure as the primary guide.
** Weak or Reversal Signals: Assessed based on one of our criteria for trend reversal signals.
*** Support/Resistance: Selected from multiple factors – static (Swing High, Swing Low, etc.), dynamic (EMA, MA, etc.), psychological (Fibonacci, RSI, etc.) – and determined based on the trader’s discretion.
**** Our advice takes into account all factors, including both fundamental and technical analysis. It is not intended as a profit target. We hope it can serve as a reference to help you trade more effectively. This advice is for informational purposes only and we assume no responsibility for any trading results based on it.
George Vann @ ZuperView
EURJPY Long Confluence between fundamental & TechnicalOANDA:EURJPY
Fundamentals: Bullish — 5 Stacks
Technicals: Diamond Vault Bullish — 7 Stacks
Summary: Strongest dual confirmation; macro and momentum align perfectly. Carry advantage, ECB tone, and ADX strength sustain powerful uptrend.
This pair is ready to jet higher.
Good luck.

Bullish
Bullish Divergence on Daily tf.
Immediate resistance is around 83 - 83.50
Very important to cross & sustain 86 - 87
for further upside.
However, should not breakk 65.50 , otherwise
we may witness further selling pressure.

Bounce Or Breakdown? Eur/Usd at Critical Support Price is currently testing a strong support zone around the 1.1650 level, where it has previously shown buying interest. The market has been in a downtrend, but we’re now seeing signs of potential reversal as price reacts to this key demand area.
Key Levels:
Support: 1.1645 – 1.1655 (highlighted in blue)
Resistance/Target Zone: 1.1715 – 1.1730 (highlighted in green)
Trade Idea:
If price holds above the support zone and shows bullish confirmation (e.g. bullish engulfing, break of minor structure), we could see a potential bounce toward the target resistance zone, offering a favorable risk-to-reward setup.

Litecoin Long-term Pump! Are you ready for this ?Hey Guys !
Are you ready for the LTC big pump ? It seems to me that we 're about to witness a big volatility in Altcoins very soon... As you know Bitcoin has been pumping for few months now and we haven't really seen any significant change in almost all the allcoins which might be confusing but if you look closely to the Litecoin 3 months chart you can see exactly why.
Whales has been accumulating for the last few months and as soon as the Bitcoin crashes (inevitable) all allcoins should crash even more and we should witness an all time low for most altcoins especially LTC which might reach the ALL TIME LOW line!
Bollinger Bands for the 3 months chart shows that we are getting rejected by mid band for months and its only logical that we fall to the lower band which is around 30$ and this price can be the ultimate entry price for long term investment!
Try to catch the train from the start and hodl untill the big pump news comes out wether its a Walmart announcement or whatever BS they say its gonna pump super hard !
Let me know what do you guys think about this and I'm looking forward for your comments.

Indicator Trading vs Price Action TradingIn the world of trading, most people start with Indicator Trading , but only those who truly understand the market eventually evolve into Price Action Trading.
These two approaches aren’t enemies — they’re actually two stages in the mindset evolution of a professional trader.
1. Indicator Trading – When You Trade the “Consequences” of Price
Indicators are tools built from historical data.
They measure strength, momentum, and direction of price movements.
For example:
RSI tells you whether the market is overbought or oversold. EMA reflects the average trend. MACD shows the momentum behind the move.
However, the core weakness of indicators lies in their lag.
By the time you see a buy signal, the price has already moved.
If you rely solely on indicators, you’ll always be reacting to the market instead of leading it.
💡 Indicator trading gives you structure and discipline — but sometimes that same structure makes you miss the real rhythm of the market.
2. Price Action Trading – When You Trade the “Story” Behind Price
Price Action requires no indicators.
It teaches you to read the emotions of the market through every candle, every price zone, and every false break.
Here, the market is no longer a series of numbers — it’s a story between buyers and sellers.
When you start to understand:
Why price forms higher lows — showing buyers gaining control.
Why a long wick appears — showing weaker players trying to fight back.
Why a “liquidity grab” happens — showing how smart money traps retail traders.
That’s when you no longer need signals — because you’ve learned to speak the language of price itself.
Price Action teaches you not just to trade with your eyes, but with your mind.
3. The True Essence – It’s Not About Choosing a Side, But Choosing a Perspective
A professional trader doesn’t “hate” indicators nor “worship” price action.
They understand one simple truth:
Indicators are the map — Price Action is the terrain.
A map gives you direction.
But if you only stare at the map without observing the terrain, you’ll fall off a cliff.
And if you only look at the ground without knowing where you’re headed, you’ll get lost.

Bitcoin Under Fire: Bears Take Full Control Below $110KHello traders,
Today, let’s take a look at the overall picture of BTCUSD – where the market is gradually losing its recovery momentum and shifting into a defensive phase. After a series of negative headlines recently, Bitcoin remains under strong selling pressure, and the downtrend is now clearer than ever.
📰 Key News Highlights
Over the past week, several macro factors have weighed heavily on investor sentiment:
- U.S.–China trade tensions have escalated after the U.S. announced expanded tariffs on Chinese tech products, triggering capital outflows from risk assets — including crypto.
- The G20 and FSB issued warnings about “significant gaps” in global crypto regulations, sparking fears of tighter oversight ahead.
- The Federal Reserve struck a more hawkish tone as Vice Chair Michael Barr warned of financial stability risks posed by stablecoins, adding further psychological pressure to the crypto market.
➡️ Combined, these factors have pushed Bitcoin down nearly 15% since the start of the month, reaching around $109,000 with no clear signs of reversal yet.
📉 Technical Analysis
The chart shows that BTC continues to move within a downward-sloping channel, with the EMA34 and EMA89 acting as dynamic resistances — a clear reflection of short-term weakness.
The $110,000 level is a key resistance zone, aligning with both the descending trendline and EMA34. Failure to break above this area could send BTC lower toward $103,000, or even $100,000 if selling pressure expands.
Only a confirmed H4 close above $112,500 would signal a temporary technical rebound.
💡 Trading Advice
The market is weak — don’t try to catch the bottom. Prioritize capital preservation and wait for clear signals before taking action.
Short-term traders: Look to sell on rallies around $110,000–$111,000.
Long-term investors: Watch for price action in the $103,000–$105,000 range, where a potential mid-term technical bottom could form.

LONG ON EUR/USDEU has given us a nice bullish push from a demand zone.
I will be buying EUR/USD looking to catch 50-80 pips.

XAUUSD – The uptrend is still on fireGold set a record for the fourth straight session, breaking above $4,300/oz as haven flows surged amid lingering U.S.–China trade tensions, the U.S. government shutdown risk, and rate-cut expectations. The “safety + lower rates” narrative is clearly fueling the uptrend.
On H1, price is moving within an ascending channel and trading above the EMA34/89, indicating bullish momentum. 4,310 is the nearest support; below that is 4,270–4,290 (EMA34 + demand zone).
Base-case path: hold above 4,310, form a shallow consolidation, then break 4,36x–4,38x toward 4,440. If price dips to 4,270–4,290 and reacts well, the uptrend remains intact.
Risk note: an H1 close below 4,260 would signal short-term weakening and call for a wait-and-reaccumulate approach. Overall, macro + technicals align for the next leg higher toward 4,440.

USDJPY – Strong Downtrend, Opportunity for Further DeclineHello traders,
USDJPY is currently in a strong downtrend, influenced by macroeconomic factors, particularly the weakening of the USD and concerns about the global financial situation. The JPY has strengthened above the 150 JPY/USD level for the first time since early October, driven by safe-haven flows, alongside Rakuten's bond issuance with high interest rates, attracting additional capital into the yen.
Technical Analysis
The H1 chart shows USDJPY moving within a clear downward channel. Currently, EMA34 and EMA89 are acting as strong resistances, preventing the price from recovering to higher levels. The 150.30 level is the nearest resistance, and if the price fails to break through this, USDJPY may continue to drop towards 148.80 in the near future.
Trading Strategy
Sell on a rally near 150.30, as it is a strong resistance level.
If the price fails to hold above 150.00, there is a high probability of further decline towards 148.80, and potentially to 148.00.

Maintain gold buying pressure above 4400⭐️GOLDEN INFORMATION:
Gold (XAU/USD) rebounds toward record highs after an earlier dip to the $4,280 zone, poised to close its ninth straight week in positive territory. Persistent geopolitical risks, renewed US-China trade tensions, and the prolonged US government shutdown keep investors cautious, driving safe-haven demand. Meanwhile, dovish Federal Reserve expectations—with markets pricing in two more rate cuts this year—continue to weigh on the US Dollar and bolster the yellow metal. Despite overbought conditions, steady dip-buying suggests the path of least resistance for Gold remains to the upside.
⭐️Personal comments NOVA:
Gold price has almost no significant selling pressure, huge fomo market for strong uptrend above 4400
⭐️SET UP GOLD PRICE:
🔥SELL GOLD zone: 4436 - 4438 SL 4443
TP1: $4425
TP2: $4412
TP3: $4400
🔥BUY GOLD zone: $4278-$4276 SL $4271
TP1: $4285
TP2: $4298
TP3: $4310
⭐️Technical analysis:
Based on technical indicators EMA 34, EMA89 and support resistance areas to set up a reasonable BUY order.
⭐️NOTE:
Note: Nova wishes traders to manage their capital well
- take the number of lots that match your capital
- Takeprofit equal to 4-6% of capital account
- Stoplose equal to 2-3% of capital account

