Xauusd - Bullish Setup From SupportPrice is currently consolidating above the support zone (3900 area) after rejecting lower levels. The highlighted entry zone shows potential bullish accumulation, suggesting that buyers are defending this level.
• Support: 3900 zone
• Entry: Around 3903 (support retest)
• Bias: Bullish as long as price holds above support
• Target: Previous weak high around 3920+
Scenario:
If price continues to respect the support area, we can expect a bullish push towards the weak high. A clean break and close above intraday highs will confirm bullish momentum. However, a breakdown below support may invalidate the setup and shift bias bearish.
Longsetup

FET ANALYSIS📊#FET Analysis
✅There is a formation of Descending triangle pattern on daily chart🧐
Pattern signals potential bullish movement incoming after the breakout of the pattern
👀Current Price: $0.600
🚀 Target Price: $0.700
⚡️What to do ?
👀Keep an eye on #FET price action and volume. We can trade according to the chart and make some profits⚡️⚡️
#FET #Cryptocurrency #TechnicalAnalysis #DYOR


S&P 500: Rising Wedge signals movement before NFP📈 BLUEBERRY:SP500 | Rising Wedge + Non-Farm Payrolls: Which breakout scenario is more likely?
A Rising Wedge pattern is forming on the 30-minute chart of US SPX 500, with price approaching the convergence point of two trendlines. This pattern typically signals weakening bullish momentum but doesn’t rule out a breakout to the upside 🚀.
🔍 Technical Analysis:
• Price is consolidating within a narrowing channel, forming a Rising Wedge 🔺.
• Key support lies between 6717 - 6734 (lower blue zone) 🛡️.
• Target zone on a breakout to the upside is 6767 - 6775 (upper blue zone) 🎯.
• The pattern signals an imminent breakout, but confirmation with a candle close beyond the wedge is needed 🕒.
📊 Non-Farm Payrolls Impact:
• If NFP comes in below expectations, the market may react positively (break up) on hopes of Fed easing monetary policy 💵👍.
• Conversely, a higher-than-expected NFP could increase downside pressure (break down from the wedge) 📉⚠️.
💡 Trade Setup:
• Enter a BUY position once price breaks above 6733 with confirming high volume 🔥.
• Place stop loss below support at 6716 to manage risk 🚧.
• Target area between 6770 - 6775 🎯.
📝 Summary:
The Rising Wedge on SPX 500 points to a breakout soon, with the NFP report acting as a key catalyst. Wait for confirmation and manage your risk carefully ✅.
Please like and comment below to support our traders. Your reactions will motivate us to do more analysis in the future 🙏✨
Harry Andrew @ ZuperView

GBP/USD - Bearish Liquidity Grab Before Bullish Reversal Price is currently trading around 1.3432 after multiple rejections from the resistance zone above. On the 15m timeframe, we can observe the following structure:
• Change of Character (ChoCH) and Break of Structure (BOS) confirm short-term bearish momentum.
• Price has broken below minor support, indicating potential continuation to the downside.
• There is a strong Order Block (OB) demand zone marked in red, which could act as the next liquidity grab area.
Expected Move:
• Price may push down into the OB zone to mitigate orders and collect liquidity.
• From there, a bullish reversal is anticipated with a target back above 1.3450, aligning with the liquidity sweep and resistance re-test.
Bias:
• Short-term bearish → looking for buy setups at OB demand zone.
• Target: retest of resistance / liquidity sweep above.

Is it time for gold price to adjust? down⭐️GOLDEN INFORMATION:
Gold (XAU/USD) fails to extend its rebound from $3,820 and faces renewed selling pressure in Friday’s Asian session. A resilient risk appetite, despite the ongoing US government shutdown, along with a firmer US Dollar, weighs on the safe-haven metal and limits its upside.
⭐️Personal comments NOVA:
Gold prices are fluctuating quite a bit around the price range of 3800 - 3900. The context of the US government shutdown.
⭐️SET UP GOLD PRICE:
🔥SELL GOLD zone: 3914- 3916 SL 3921
TP1: $3900
TP2: $3890
TP3: $3880
🔥BUY GOLD zone: $3794-$3792 SL $3787
TP1: $3802
TP2: $3815
TP3: $3830
⭐️Technical analysis:
Based on technical indicators EMA 34, EMA89 and support resistance areas to set up a reasonable BUY order.
⭐️NOTE:
Note: Nova wishes traders to manage their capital well
- take the number of lots that match your capital
- Takeprofit equal to 4-6% of capital account
- Stoplose equal to 2-3% of capital account
Xau/Usd - Bullish Breakout Setup Towards 4000Price is currently showing bullish momentum after rejecting the support zone. We have a clear break in structure, and the market is approaching a key resistance/imbalance zone.
Plan:
• Wait for a candle close above the marked zone to confirm bullish strength.
• Once confirmed, look for a retest of the breakout level to enter long positions.
• First target: previous strong high around 3870 – 3900.
• Continuation possible towards 4000 psychological level if momentum sustains.
Invalidation:
• If price fails to close above the zone and rejects back downward, bullish bias is invalidated and we may revisit the support area.
Always manage risk with proper stop-loss and position sizing.

Sugar SB Futures: Extreme COT Divergence – Short Squeeze Ahead?
ICEUS:SB1!
🔎 Market Situation
The latest COT report shows one of the most extreme positioning imbalances in 18 years for Sugar #11:
• Commercials: Net Long 128,130 contracts → 2nd highest since 2007 (only surpassed in Sep/Oct 2020 with ~160k).
• Non-Commercials (Funds): Net Short –125,628 contracts, almost a mirror image.
• COT Index: above 80% since July, peaking at 100% → continuous accumulation by Commercials.
• Open Interest: very high → massive market participation.
• On-Balance Volume (OBV): still negative → typical for final shakeouts before reversals.
📈 Historical Parallels
Looking back at the 5 biggest Commercial Long positions (2011, 2015, 2018, 2020, 2025):
2020: +55% rally within 3–6 months after record Commercial longs.
2015: +30% rally within 90 days.
Other cases: Average performance +10% (T+30), +21% (T+60), +31% (T+90).
👉 Every major COT extreme in Sugar was followed by a double-digit rally.
🟢 Trading Idea (Setup)
Bias: Bullish (expecting potential short squeeze / fund covering).
Entry Trigger: Breakout above key moving averages (e.g. 50-day SMA).
Stop: ATR-based or below recent swing lows.
🎯 Targets
TP1 = partial profit at +1.5R.
TP2 = trend-following → historically, rallies extended 20–30% within 2–3 months.
📅 Seasonality: Q4–Q1 tends to be bullish for Sugar (ethanol demand, Brazil harvest).
⚖️ Risk/Reward
Historical CRV of similar setups: 1:3 to 1:5.
Best rallies occurred when Commercials held positions >100k for several weeks while funds stayed heavily short.
📌 Conclusion
Sugar is showing one of the rarest COT setups of the past two decades.
Commercials are heavily long, funds massively short, and open interest is extreme.
The last time this happened (2020), Sugar rallied more than 50%.
📈 History suggests we could see another powerful move higher.
⚠️ Reminder: Next WASDE report → 09 Oct 2025

BXP Stock Going UP, Bullish Momentum ConfirmedHello,
Ayrfolio trade ideas are based on weekly charts and momentum, so remember to be patient! No day trades here unless the stock soars up intraday. Today we’re covering:
COMPANY: BXP Inc
STOCK SYMBOL: BXP
POSITION: Long
TP1 Risk-Reward Ratio: 1.45
TP2 Risk-Reward Ratio: 2.89
Stop Loss: must wait AFTER daily candle closes to exit trade (regular candle, NOT Heiken Ashi)
Ultimate Stop Loss: can exit IMMEDIATELY if price reaches this level during any trading hours
EXPLANATION: Weekly momentum increased and confirmed on Tuesday 9/2/25 at 76.83/share. Although the stop losses are listed on the chart, if momentum has been lost then we can exit before the price reaches the stop loss.
DISCLAIMER: Please do your own due diligence before making any decisions. I am not an investment advisor, and I do not personally trade these stocks. These posts are stock trade ideas that follow my same weekly momentum strategy. Past results are not indicative of future performance.
P.S. - Stocks can soar. YOU can soar. Soaring is possible!
-Ayrfolio

Plan XAUUSD day: 02-oct-2025 📍Related Information:!!!
✨ Meanwhile, the Institute for Supply Management’s (ISM) Purchasing Managers’ Index (PMI) came in slightly above consensus estimates, improving from 48.7 to 49.1 in September. This helped the U.S. dollar recover from a one-week low reached on Wednesday. However, the momentum quickly faded amid dovish expectations for the Federal Reserve, which continue to support the non-yielding yellow metal.
✨ According to the Wall Street Journal (WSJ), the United States will provide intelligence to Ukraine to support long-range missile strikes on Russia’s energy infrastructure. Trump approved the move, and U.S. officials are urging NATO allies to do the same. This keeps geopolitical risks in play and should help limit any corrective downside in the safe-haven precious metal, warranting some caution for bearish traders.
📍personal opinion:!!!
📉Gold price is heading toward 3900 (ATH) and then moving sideways 3860-3890.
📍Important price zone to consider : !!!
📉Resistance zone point: 3860 zone

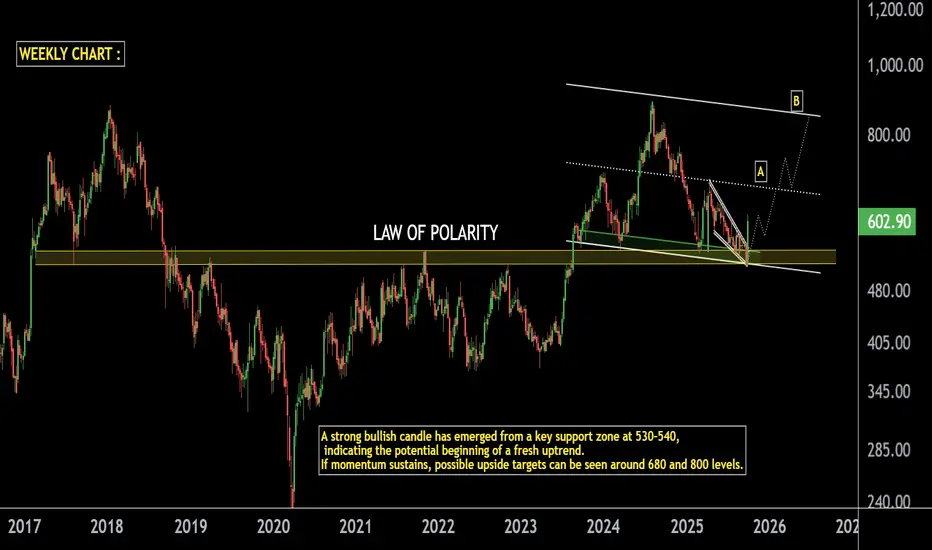
SUN TV on Fire: Explosive Move from Strong Support Zone.SUN TV Weekly Analysis
Support Zone: Stock is respecting the long-term LOP with strong support in the 520–530 range.
Bullish Candle: A powerful bullish candle has formed at this support zone, signaling strength.
Momentum Outlook: If momentum continues, a minor correction could act as a healthy pause before the next rally.
Resistance Levels:
First resistance / rally stop point near 680.
If 680 breaks, next resistance is positioned around 850.
Trend View: As long as the 520–530 support zone sustains, SUN TV may continue its rally in the coming sessions.
Thank You !!
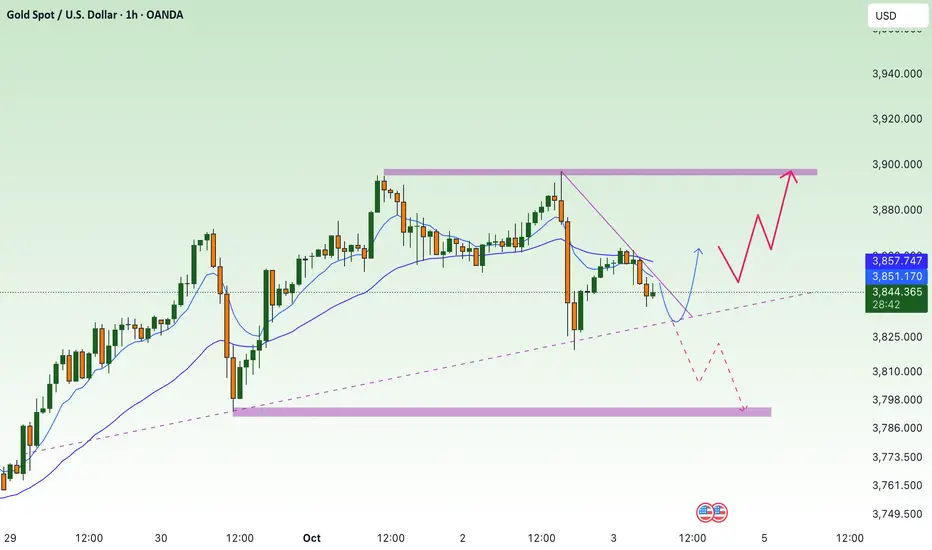
slight decrease, long term uptrend 3910⭐️GOLDEN INFORMATION:
Gold (XAU/USD) recovered from a brief dip to the $3,853 zone on Thursday, holding close to its record high from the prior session. A positive equity tone and overbought conditions cap upside momentum, yet expectations of Fed easing and lingering geopolitical risks keep the metal supported, making a decisive top uncertain.
⭐️Personal comments NOVA:
Gold prices continuously set new peaks, short-term adjustments and continued the upward trend.
⭐️SET UP GOLD PRICE:
🔥SELL GOLD zone: 3908- 3910 SL 3915
TP1: $3900
TP2: $3890
TP3: $3880
🔥BUY GOLD zone: $3833-$3831 SL $3826
TP1: $3845
TP2: $3860
TP3: $3870
⭐️Technical analysis:
Based on technical indicators EMA 34, EMA89 and support resistance areas to set up a reasonable BUY order.
⭐️NOTE:
Note: Nova wishes traders to manage their capital well
- take the number of lots that match your capital
- Takeprofit equal to 4-6% of capital account
- Stoplose equal to 2-3% of capital account

Gbp/Usd - SMC Setup, Demand Zone Reaction Loading Price is currently pulling back after a strong bullish impulse, showing signs of a potential continuation to the upside.
Key Observations:
BOS (Break of Structure): Multiple bullish BOS confirm market structure shift.
Support Zone: Price is approaching a key demand area that previously led to a strong rally.
Liquidity Target: A weak high is identified above, likely to be taken out in the next bullish leg.
Projected Price Action: Expecting a deeper pullback into support before a bullish reversal targeting the weak high and beyond.
Trade Idea:
Wait for confirmation inside the support zone (e.g., bullish engulfing or break of short-term lower high).
Entry: Upon confirmation in the support zone.
Target: Above 1.35200 – targeting liquidity and weak high.
Stop Loss: Below the support zone (low of the demand area).

Xau/Usd - 15 Min Bullish Reversal In PlayTrendline Breakout:
A descending trendline has been broken to the upside, indicating a potential shift from bearish to bullish momentum.
Support Zone:
Price found support around the gray demand zone, suggesting buying interest.
Key Labels:
BOS (Break of Structure): Indicates previous bearish pressure.
CHoCH (Change of Character): Signifies a potential trend reversal.
ENTRY Point: Marked at the breakout of the trendline, suggesting a long position was taken there.
Target: 3900
A clear bullish target based on the chart's structure.
Aimed at the next liquidity area (marked "Weak High").
:
Bullish Bias due to:
Breakout of trendline.
CHoCH confirmation.
Bounce from support.
Strategy:
Entry on breakout
Target at 3900 (psychological level and previous high).
Likely stop-loss just below the support zone.

KHC 1H Long Swing Aggressive CounterTrend TradeAggressive CounterTrend Trade
- short impulse
+ volumed T1 / TE level
+ support level
+ biggest volume 2Sp-
+ 5M volume distribution long
+ weak test
+ first bullish bar close entry
Calculated affordable virtual stop loss
1 to 2 R/R take profit
1D CounterTrend
"- short impulse
+ support level
+ volumed T1 level
+ volumed interaction"
1M CounterTrend
"- short impulse
+biggest volume T1
+ support level
+ volumed interaction"
1Y no context

GBPUSDPrice action on GBPUSD is showing signs of strength after forming a clear series of higher lows, marked by the ascending trendline. The market has successfully respected this rising structure multiple times, confirming buyer interest.
Currently, price is breaking above the key resistance zone (1.3460 – 1.3480) which previously acted as supply. A successful retest of this zone as support could trigger a continuation move higher.
🔑 Key Points:
Strong uptrend structure with higher lows.
Dynamic support from the 50 EMA (blue line).
Price approaching breakout above resistance.
Potential target lies around 1.3550 – 1.3580 if momentum holds.
📈 Bias: Bullish
A clean breakout and retest above 1.3480 can open the door for further upside. Watch for rejection signals around this level for confirmation.

EURUSD BullishGoing for Long Trade with Limit Order in Discount Zone with Proper Risk Management, let's see what Price do next.

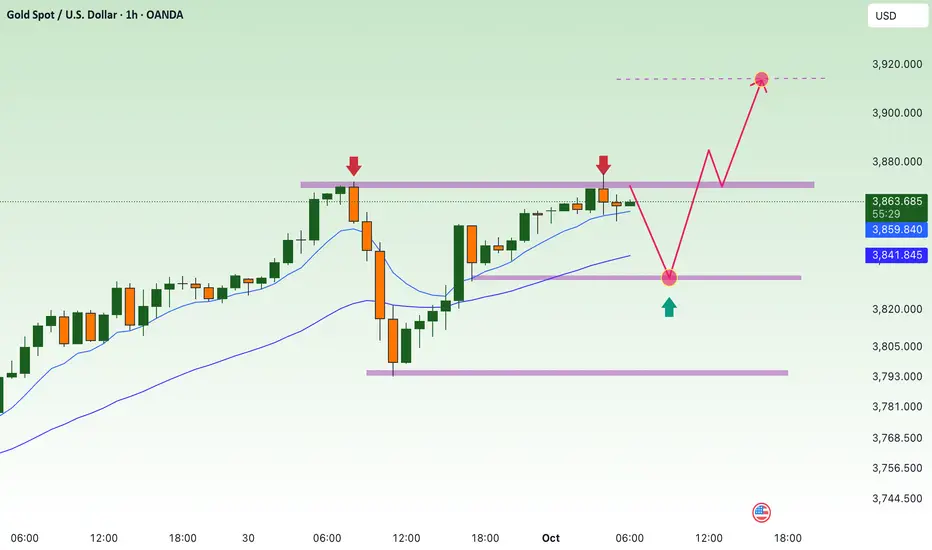
Bulls continue to increase prices, waiting for ATH 3915⭐️GOLDEN INFORMATION:
Markets, via the CME FedWatch Tool, now price in a 97% chance of a Fed rate cut in October and a 76% probability of another in December. Growing bets on easing pressured the US Dollar, making Gold more attractive to overseas buyers. Bullion also drew support from fears of a potential US government shutdown, with Washington gridlocked over funding and the Labor Department warning it would halt key data releases, including Friday’s jobs report, if a shutdown occurs.
⭐️Personal comments NOVA:
Gold price returns, continues to create new ATH 3875 in Asian session. Maintain buying power and continue the uptrend
⭐️SET UP GOLD PRICE:
🔥SELL GOLD zone: 3915- 3917 SL 3922
TP1: $3905
TP2: $3890
TP3: $3880
🔥BUY GOLD zone: $3833-$3831 SL $3826
TP1: $3845
TP2: $3860
TP3: $3870
⭐️Technical analysis:
Based on technical indicators EMA 34, EMA89 and support resistance areas to set up a reasonable BUY order.
⭐️NOTE:
Note: Nova wishes traders to manage their capital well
- take the number of lots that match your capital
- Takeprofit equal to 4-6% of capital account
- Stoplose equal to 2-3% of capital account
Usd/Chf - Buy From Liquidity To The Target Current Market Situation:
Current Price: 0.79579
Location: Just above the support zone and below the Order Block (OB).
Recent action: Price rejected strongly from support, showing bullish candles.
Structure: Forming a potential higher low (HL) after a BOS.
How Price Could Reach the Target From Here:
Minor Pullback Expected (Optional):
Price may first dip slightly to retest the immediate support area around 0.79530–0.79500.
This would allow for a higher low (HL) formation and trap early sellers.
Bullish Momentum Kicks In:
After the HL forms, we expect bullish continuation.
Price could form a bullish internal CHoCH or BOS (on 1m–5m TF), signaling aggressive buying from smart money.
This move would target the imbalance / inefficiency left above, which aligns with the OB zone.
Target Hit at OB / Liquidity Zone:
The projected target zone is around 0.79700–0.79750, just beneath the resistance.
This area holds liquidity above recent swing highs, making it attractive for a liquidity sweep or partial mitigation of the OB.
This is also where trapped sellers’ stop-losses might be sitting — a common smart money target.
Exit / Reversal Likely After Target:
Once price hits the OB / Target zone, it may:
Reverse (if this was just a retracement in a larger bearish trend), or
Consolidate before making a decision (continuation vs rejection).
Why It Can Reach the Target from Here:
Price has already shown a bullish reaction from the demand zone.
The structure has shifted bullish (BOS + HL forming).
There's clear inefficiency above — price often seeks to fill that imbalance.
Liquidity pool above the recent highs is a magnet for price.
In Short:
From the current level (0.79579), price is expected to:
Either dip briefly into the support (~0.79500–0.79530) or push directly,
Gain bullish momentum,
Break above short-term highs,
Tap into the target zone (~0.79700–0.79750), completing the planned move.

Long Opportunity From Bullish OrderBlockMarket Structure:
Recent Break of Structure (BOS) confirms bearish intent.
Change of Character (CHoCH) signals a possible shift in trend to the upside.
Price retraced into premium levels near resistance (supply zone), forming a weak high.
Order Block (OB) Zone:
Marked in red — this is a potential bullish order block (demand zone) where institutions may step in.
Entry anticipated near 1.34277, within the OB for a potential long trade.
Trade Setup:
Entry: Around 1.34277 (within OB)
Stop Loss: Just below OB, near 1.34108 (strong low)
Target: Previous resistance zone near 1.34585 — aiming to break the weak high
Bias: Bullish (Long Setup)
Expecting price to mitigate the OB and push up toward the weak high.
This setup follows Smart Money Principles: Liquidity grab + OB mitigation + BOS confirmation.
Watch For:
Clean reaction from the OB.
Break of weak high will validate continuation.
Avoid early entries; wait for confirmation or bullish PA in OB zone.

BRX Stock Going UP, Bullish Momentum ConfirmedHello,
Ayrfolio trade ideas are based on weekly charts and momentum, so remember to be patient! No day trades here unless the stock soars up intraday. Today we’re covering:
COMPANY: Brixmor Property Group, Inc.
STOCK SYMBOL: BRX
POSITION: Long
TP1 Risk-Reward Ratio: 1.54
TP2 Risk-Reward Ratio: 3.09
Stop Loss: must wait AFTER daily candle closes to exit trade (regular candle, NOT Heiken Ashi)
Ultimate Stop Loss: can exit IMMEDIATELY if price reaches this level during any trading hours
EXPLANATION: Weekly momentum increased and confirmed on Tuesday 9/2/25 at $28.20/share. Although the stop losses are listed on the chart, if momentum has been lost then we can exit before the price reaches the stop loss.
DISCLAIMER: Please do your own due diligence before making any decisions. I am not an investment advisor, and I do not personally trade these stocks. These posts are stock trade ideas that follow my same weekly momentum strategy. Past results are not indicative of future performance.
P.S. - Stocks can soar. YOU can soar. Soaring is possible!
-Ayrfolio

BROS RALLY IMMINENTIncreasingly 'high likelihood' of return opportunity is upon us. BROS is very oversold and prime for a bounce, fundamentally it's prime for a run back to all time highs, but let us take baby steps here and first target a relief rally before a larger run.
Short interest has been high for this stock for the month of September.
The rally may not come at the next market open, and it may even move EVEN lower first, but this rally will be fast and strong. Institutions are still buying by the millions, consumer spending is coming in better than expected, and BROS continues to be a disruptor in their market.
Always manage your risk... good luck all!

SUI — Critical $3 ZoneSince completing its 5-wave impulse on July 28, SUI has been in a corrective phase for the past two months. The structure remains clean, with invalidation zones well-defined.
Looking ahead, there’s potential for an ascending triangle formation but for that to play out, it’s crucial that SUI holds the $3 psychological level.
Support Zone ($3.11–$2.93)
0.618 Fib retracement: $3.115
0.702 Fib retracement: $2.934
60 Weekly EMA $2.93 / SMA $3.036
Potential ascending triangle lower support line
📌 This is the last key support zone for bullish momentum. Losing it would break structure, holding it keeps the bullish case alive.
Resistance Zone ($4.12–$4.59)
Yearly Open (yOpen): $4.122 → key level bulls must reclaim
Swing Highs: $4–$4.5
0.786 Fib retracement: $4.59
15B Market Cap: $4.2
This area is loaded with resistance confluence and will act as the major target zone for longs.
🟢 Long Setup
Entry Zone: Between current price and $2.9 → ladder down into support
Stop-Loss: Below 0.702 Fib retracement
Take Profits: TP1 → $3.49, TP2 → $3.89, TP3 → $4.12 (yOpen)
R:R: ~1:4+
Potential Gain: +35%
This is a make-or-break zone for SUI. The $3 level is stacked with support confluences and must hold to keep the bullish structure intact. If bulls reclaim the yearly open at $4.122, momentum could carry toward $4.6.
🔍 Indicators used
DriftLine — Pivot Open Zones → For identifying key yearly/monthly/weekly/daily opens that act as major S/R reference points
Multi Timeframe 8x MA Support Resistance Zones → to identify support and resistance zones such as the weekly 60 EMA/SMA.
Fair Value Trend Model → Calculates a regression-based fair value curve
➡️ Available for free. You can find it on my profile under “Scripts” and apply it directly to your charts for extra confluence when planning your trades.
_________________________________
💬 If you found this helpful, drop a like and comment!
