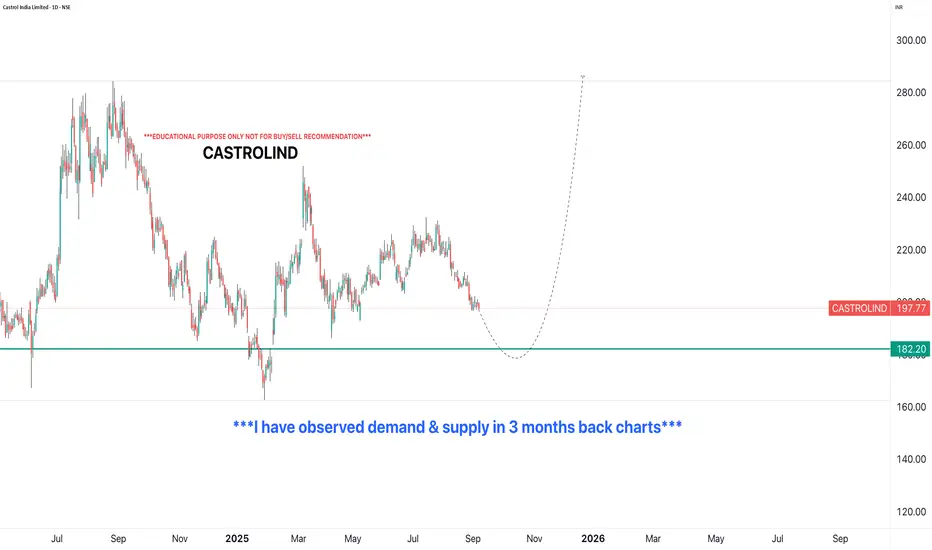
CASTROLINDi Observed these Levels based on Price Action and Demand & Supply which is my own Concept "PENDAM CONCEPTS"... Please don't take any trades based on this chart/post... Because this chart is for educational purpose only not for Buy or Sell Recommendation... Thank Q
Longsetup
USD/CAD – Sideways Accumulation, Preparing for a Mild UpsideThe August Nonfarm Payrolls report came in at only 22K, far below expectations of 75K and the previous 79K, causing the USD to weaken. However, Canadian labor data was also underwhelming, leaving the CAD too weak to drag the pair significantly lower. As a result, USD/CAD has maintained balance and is moving within a narrow range.
On the H4 chart, the price is fluctuating around 1.38280, closely tracking the long-term descending trendline. The EMA34 and EMA89 are moving sideways, reflecting an accumulation phase. If support at 1.3787 holds, USD/CAD could rebound and push up towards 1.3833 before confirming the next trend direction.

EUR/USD – Sustaining the Uptrend After Weak U.S. Jobs ReportIn the latest session, EUR/USD reached the target from the previous analysis , breaking above 1.17 and maintaining a steady upward momentum. The main driver was the August Nonfarm Payrolls , which came in at only 22K, far below the expected 75K and the prior 79K. This significant weakness in the U.S. labor market pushed the USD lower, while also reinforcing expectations that the Fed may soon ease monetary policy. As a result, the euro gained strong support, fueling the pair’s rally.
From a technical perspective, on the H4 chart, EUR/USD remains in a clear uptrend with a structure of higher lows. The 1.1660 level is acting as immediate support , while 1.1770 stands as the next resistance to be tested. Both EMA34 and EMA89 are sloping upward, confirming that buyers are in control. Any pullback toward support zones continues to be viewed as a buying opportunity.
Conclusion: With the combination of weak U.S. fundamentals and bullish technical structure, the EUR/USD uptrend is likely to continue , aiming toward 1.1770 and potentially higher if that resistance is broken.

Nonfarm Disappoints, Gold Surges Strongly!Hello traders. Yesterday, gold staged an impressive breakout, climbing more than 400 pips . This was a clear market reaction to weak U.S. economic data, putting pressure on the dollar and driving strong safe-haven flows into gold.
The Nonfarm Employment Change report showed only 22K new jobs, compared to a forecast of 75K and a previous reading of 79K . This figure, far below expectations, immediately weighed on the U.S. dollar.
In addition, the unemployment rate rose from 4.2% to 4.3% , further strengthening expectations that the Federal Reserve will be forced to cut interest rates sooner. With a weaker USD and growing prospects of monetary easing, gold – as a safe-haven asset – quickly benefited , becoming the preferred choice for investors.
From a technical perspective, the daily chart continues to hold within a clear ascending channel. Price has already moved above the immediate support at 3,536 and is now heading toward the psychological resistance at 3,700 . Both EMA34 and EMA89 are pointing upward, confirming that the primary trend remains bullish. Recent pullbacks appear to be mere pauses rather than any structural break in the uptrend.
All in all, with disappointing U.S. labor data and monetary policy leaning toward easing , gold has likely entered a new bullish wave.

keep growing, new ATH 3648✍️ NOVA hello everyone, Let's comment on gold price next week from 09/08/2025 - 09/12/2025
⭐️GOLDEN INFORMATION:
Gold (XAU/USD) surged to a record high of $3,600 on Friday after weak US Nonfarm Payrolls data fueled speculation of aggressive Fed rate cuts. The metal trades at $3,594, up 1.30%, as soft labor data drove Treasury yields and the Dollar lower. The 2-year yield, most sensitive to Fed policy shifts, slid over 11 basis points to 3.48%, reinforcing expectations of imminent easing.
⭐️Personal comments NOVA:
Gold price hits new ATH 3600 and still maintains uptrend, bullish momentum thanks to interest rate cut in September
🔥 Technically:
Based on the resistance and support areas of the gold price according to the H4 frame, NOVA identifies the important key areas as follows:
Resistance: $3648
Support: $3508, $3465
🔥 NOTE:
Note: Nova wishes traders to manage their capital well
- take the number of lots that match your capital
- Takeprofit equal to 4-6% of capital account
- Stoplose equal to 2-3% of capital account
- The winner is the one who sticks with the market the longest

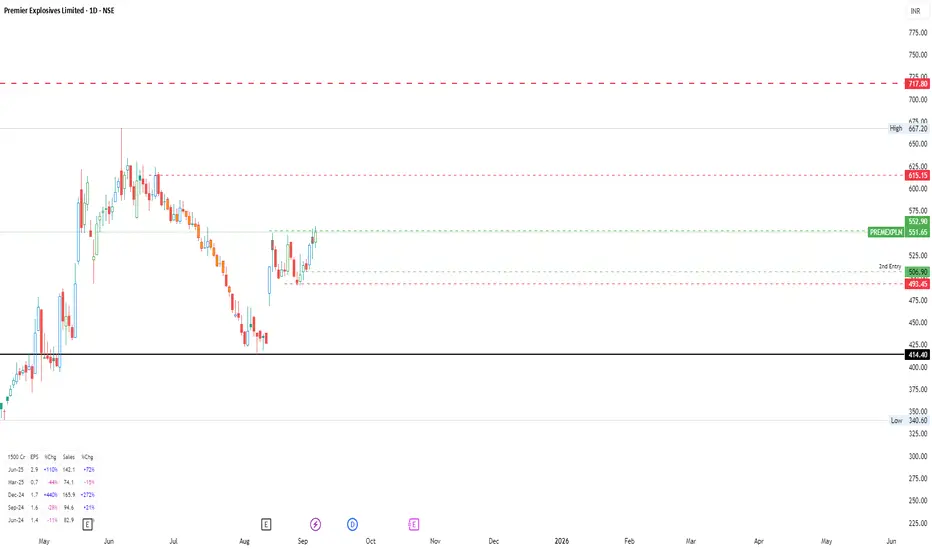
Premier Explosive - Explode from herePremier Explosive post Qtr announcement has seen the downtrend and now it is ready for the explosion. On Bottom Left Quarter earnings are provided for review. Fundamentally is good stock and technical break out is being seen.
Order Pipeline:
Active participation in ~INR 700 crore RFPs, especially in emergency procurement (missiles, ammunition).
Management maintains FY26 revenue guidance at INR 600 crore; order inflow guidance not specified due to industry uncertainties and long lead times (5-6 months for order finalization even in emergency procurement).
Margins:
Defense segment is higher margin than Explosives.
Margin drop in Q1 attributed to timing of defense product dispatches (many in stock, valued at cost/market value, whichever is lower); expected to improve in Q2.
Chaffs & flares order completion will support margin uptick post-March 2026.
Management Tone and Challenges
Confidence:
Management is optimistic, citing strong order book, robust pipeline, and government policy tailwinds (Atmanirbhar Bharat, import substitution).
Headwinds:
Regulatory delays (plant clearance post-incident), long gestation for defense order finalization, and reverse auction pricing pressure in mining explosives.
Incident-related financial impacts are mitigated by insurance.
Summary
PEL is strategically positioned in the defense and space segment, with a strong order book, significant export opportunities, and ongoing capex for capacity expansion. The company is leveraging its unique technical capabilities (countermeasures, rocket motors, energetic materials) and is actively participating in high-value defense procurement. Near-term challenges (incident impact, regulatory clearances, margin volatility) are being managed, with management maintaining a positive outlook on growth, margin improvement, and operational resilience.
The Power of Price Action: Reading the Market Without IndicatorsIn the trading world, many traders get caught up in countless technical indicators such as RSI, MACD, and Stochastic… However, at the core of every price movement lies Price Action – the art of reading the market purely through price and volume, without relying heavily on indicators.
1. What is Price Action?
Price Action is the art of analyzing and making trading decisions based on pure price movement. Traders focus on price patterns, market structure, support and resistance levels, and especially candlestick signals, instead of depending on formula-based indicators.
2. Why is Price Action Important?
Primal nature: Price is the most direct information from the market, not lagging like indicators.
Flexibility: Applicable across all markets (Forex, Gold, Stocks, Crypto…).
Simplicity & effectiveness: Helps traders cut out the “noise” from overly complex tools.
3. Core Elements of Price Action
Support and Resistance Zones: Where supply and demand meet, shaping trends.
Market Structure: Uptrend, downtrend, consolidation, or breakout.
Reversal & Continuation Candlestick Patterns: Offering signals for entries and exits.
4. Key Candlestick Patterns
Doji: Reflects indecision, signaling a possible reversal or continuation.
Pin Bar (Long-tailed candlestick): A long wick shows strong rejection, a reliable reversal signal.
Engulfing: A candle that fully engulfs the previous one, demonstrating dominance from buyers or sellers.

EURUSD – Short-Term Uptrend ResumesRecent news shows that U.S. economic data has weakened (JOLTS and Factory Orders came in below expectations), increasing market expectations that the Fed may cut interest rates soon. This has weakened the USD, providing upward momentum for EURUSD.
On the 4H chart, the pair is maintaining its bullish structure with trendline support and the EMA 34–89 cluster around 1.1657 – 1.1662. The nearest support is at 1.1640, and if it holds, the price could rebound higher.
Short-term scenario: EURUSD is expected to move toward the resistance zone at 1.1740. The bullish outlook would only be invalidated if the price breaks decisively below 1.1640.

XRP — $2.5 Liquidity Zone Could Trigger the Next RallyAfter hitting a new all-time high (ATH) on 18th July, XRP failed to hold the previous ATH ($3.40) as support. This breakdown led to a –25% drop, finding support at the 0.5 Fib retracement of the $1.90 → $3.66 move, followed by a solid +24% bounce back to the pATH (200B MC at $3.36) and 0.702 Fib retracement → an ideal short opportunity.
Now XRP has been trending in a descending triangle pattern for 50 days, with $3 acting as the key resistance. This level is the Point of Control (POC) of the last 75-day trading range, adding weight to its importance. On top of that, the anchored VWAP (~$3.035) is currently reinforcing $3 as additional resistance.
🧩 Confluence Support Zone ($2.665–$2.45)
Liquidity cluster: many stop-losses reside here
Anchored VWAP (support): ~$2.62
Yearly anchored VWAP: $2.59 → strong support level
Golden Pocket (0.618–0.666): $2.5777–$2.4936
21 EMA ($2.665) / 21 SMA ($2.576) (weekly): dynamic HTF support
233 EMA ($2.44) / 233 SMA ($2.53) (daily): strong moving average cluster
Market Cap Support: $2.52 aligns with the $150B level
1.0 Trend-Based Fib Extension: $2.4498 → aligning perfectly with the $2.5 support zone as a reversal point
This creates a high-probability long entry zone between $2.665–$2.45, with multiple overlapping technical factors.
🟢 Long Trade Setup
Entry Zone: $2.665–$2.45
Stop-Loss: Below $2.25 for now, to be adjusted once price action confirms a reversal.
Potential Gain: up to +60% depending on execution
Technical Insight
After 50 days of correction, XRP is approaching a major liquidity and confluence zone.
The golden pocket, VWAP, EMA/SMA clusters, market cap support, and 1.0 Fib extension all stack together at around $2.5, making it a powerful reversal point.
Meanwhile, $3 remains the key resistance, reinforced by the POC of the last 75-day range and the anchored VWAP (~$3.035). Bulls must reclaim this level to confirm bullish continuation.
Key Levels to Watch
Support: $2.665–$2.45 (reversal zone)
Resistance: $3.00
🔍 Indicators used
Multi Timeframe 8x MA Support Resistance Zones → to identify support and resistance zones such as the weekly 21 EMA/SMA.
➡️ Available for free. You can find it on my profile under “Scripts” and apply it directly to your charts for extra confluence when planning your trades.
_________________________________
💬 If you found this helpful, drop a like and comment!

Gold Shines Amid USD Pressure?Gold is maintaining its bullish momentum as the market finds little additional support for the USD from the latest data. Average hourly earnings rose 0.3%, exactly in line with forecasts, creating no surprises.
Nonfarm Payrolls came in at 75k, slightly higher than the previous 73k but still matching expectations, suggesting the U.S. labor market is not particularly strong. More importantly, the unemployment rate climbed from 4.2% to 4.3%, a negative signal for the USD as it increases the likelihood of a more dovish Fed, thereby supporting gold prices.
On the H1 chart, gold is trading around $3,550, with key support at $3,500 (aligned with the EMA34 and EMA89). The nearest resistance stands at $3,590, which is also the next upside target if the current trend holds. Overall, as long as gold remains above $3,500, the scenario of testing $3,590 in the coming sessions remains the primary outlook.

TGKA 1H Swing Conservative Trend TradeConservative Trend Trade
+ long impulse
+ expanding T2 level
+ support level
+ 1/2 correction
+ biggest volume Sp
Calculated affordable virtual stop loss
1 to 2 R/R take profit
Day Trend
"+ long impulse
+ T2 level
+ biggest volume 2Sp-
+ support level
+ 1/2 correction"
Monthly Trend
"+ long impulse
- below 1/2 correction
+ expanding T2 level
+ support level"
No context on Year

BTC/USDT – Short-Term Bearish, Medium-Term Recovery PotentialThe market is under pressure as Bitcoin lost the key $110K level, raising concerns of further selling. However, with major institutions continuing to hold over 1 million BTC, long-term confidence remains intact.
On the 12H chart:
Current price: 111,265 USDT
Near resistance: 112,300 USDT (aligned with EMA34 – 111,794 and EMA89 – 113,283)
Key support: 108,000 USDT, a level likely to provide buying interest
Main scenario:
In the short term, BTC may continue to face selling pressure, testing the 108,000 USDT support before stabilizing.
In the medium term, if this level holds, the price could rebound back toward 112,300 USDT, and potentially break out of the descending channel to the upside.
👉 Overall outlook: Short-term bearish → Neutral → Slightly bullish in the future.

GBP/JPY – Uptrend within Sideway RangeIn the recent context, both GBP and JPY have been under pressure: the British pound faces risks from fiscal concerns, while the Japanese yen weakens due to political instability in Japan. Combined, GBP still holds the upper hand thanks to UK gilt yields remaining elevated, helping the pair maintain a slight bullish bias.
On the H2 chart, GBP/JPY is moving sideways within a wide range. The EMA34 and EMA89 are converging around the current price area, indicating that buyers remain in control. The key support at 198.400 has held firm multiple times, while short-term resistance lies at 199.700.
Overall, the main trend remains bullish within the sideway channel. As long as price holds above 198.400, GBP/JPY has the potential to rebound and continue testing the 199.700 zone, and possibly push above the 200.000 mark.

Gold prices are still supporting price increases⭐️GOLDEN INFORMATION:
Gold (XAU/USD) inches higher in Friday’s Asian session, extending its rebound from the $3,500 level and staying close to this week’s record highs. Expectations of at least two Fed rate cuts this year, starting in September, keep the US Dollar subdued and support the safe-haven metal, while trade tensions add to its appeal. However, upbeat risk sentiment and overbought conditions could cap gains as traders await the US Nonfarm Payrolls report later today for fresh cues on Fed policy.
⭐️Personal comments NOVA:
The market is expecting continued good news for gold, rate cuts and gold hitting above 3600.
⭐️SET UP GOLD PRICE:
🔥SELL GOLD zone: 3600- 3598 SL 3605
TP1: $3585
TP2: $3568
TP3: $3552
🔥BUY GOLD zone: $3482-$3484 SL $3477
TP1: $3490
TP2: $3500
TP3: $3510
⭐️Technical analysis:
Based on technical indicators EMA 34, EMA89 and support resistance areas to set up a reasonable BUY order.
⭐️NOTE:
Note: Nova wishes traders to manage their capital well
- take the number of lots that match your capital
- Takeprofit equal to 4-6% of capital account
- Stoplose equal to 2-3% of capital account

USDJPY – Buyers in Control Within Sideways RangeOn the 4H chart, USDJPY continues to trade within a sideways range, with strong support around 147.9 and immediate resistance near 149.4. These are the two key levels that will determine the next move for the pair.
Currently, after a short pullback, price has rebounded from the EMA 34 and EMA 89, indicating that the bullish structure remains intact. Consecutive lower-wick candles around the support zone further reinforce its role as a solid base. Meanwhile, the short-term upward trendline is still being respected, keeping buyers in control.
That said, the bullish momentum is not particularly strong — it leans more toward a “gradual climb” within the sideways range. This means each push toward 149.4 is likely to face profit-taking pressure, but as long as price holds above 147.9, the recovery still has room to continue.

BTCUSDT- 250905 - LONG - Binance - Algo Target - 1WTake Profit: $134,000 - $137,000
Likely Market Cycle Top

SOLUSDT- 250905 - LONG - Binance - Algo Target - 1WSOLUSDT- 250905 - LONG - Binance - Algo Target - 1W

FLNG Bullish Stock Confirmed Going UPHello,
Ayrfolio trade ideas are based on weekly charts and momentum, so remember to be patient! No day trades here unless the stock soars up intraday. Today we’re covering:
COMPANY: FLEX LNG Ltd.
STOCK SYMBOL: FLNG
POSITION: Long
TP1 Risk-Reward Ratio: 1.41
TP2 Risk-Reward Ratio: 2.82
Stop Loss: must wait AFTER daily candle closes to exit trade (regular candle, NOT Heiken Ashi)
Ultimate Stop Loss: can exit IMMEDIATELY if price reaches this level during any trading hours
EXPLANATION: Weekly momentum increased and confirmed on Monday 8/25/25 at $27.25/share. Although the stop losses are listed on the chart, if momentum has been lost then we can exit before the price reaches the stop loss.
DISCLAIMER: Please do your own due diligence before making any decisions. I do not personally trade these stocks, but these stocks follow my same weekly momentum strategy. Past results do not indicate future performance.
P.S. - Stocks can soar. YOU can soar. Soaring is possible!
-Ayrfolio

ZEC ANALYSIS📊 #ZEC Analysis
✅There is a formation of Falling Wedge Pattern on daily chart with a breakout and currently pullback around its major support zone🧐
Pattern signals potential bullish movement incoming after sustain above the major support zone.
👀Current Price: $40.36
🚀 Target Price: $54.41
⚡️What to do ?
👀Keep an eye on #ZEC price action and volume. We can trade according to the chart and make some profits⚡️⚡️
#ZEC #Cryptocurrency #TechnicalAnalysis #DYOR

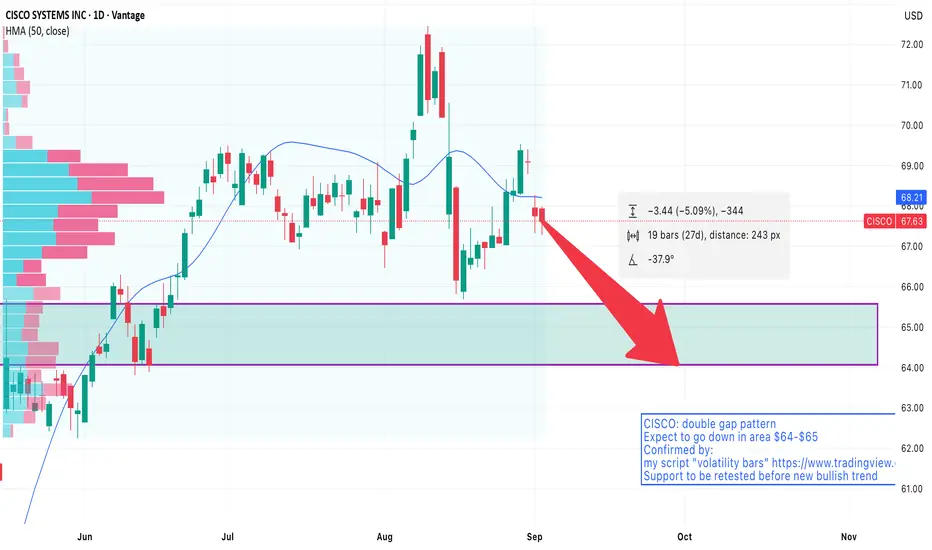
CISCO: bearish pattern foundCisco (CSCO) Forecast:
Double gap pattern spotted for Cisco (CSCO), with expectations for the price to decline to the $64-$65 range in the next days.
Confirmation
This forecast is supported by my script, "Volatility Bars".
Additional Insights
I expect that the price will retest support area $64-$65 before initiating a new bullish trend.
Keep an eye on market conditions and any news that may impact Cisco's performance.
Trading Ideas
Short Position:
Entry: Current market price
Take Profit (TP): Set at 5%-6% below the current price.
Long Position:
Entry: Wait for a retracement to the $64-$65 area to buy.
Feel free to share your thoughts or any additional insights!
Bullish Divergence on Weekly TF.2020 Closed at 108.80 (17-06-2025)
Bullish Divergence on Weekly TF.
Double Bullish Divergence on Daily TF.
105 - 108 can be a Good Support leve.
Upside Targets can be around 119 - 120
initially.
It should not break 95 now.

Gold Hits Resistance – USD Strikes Back!Gold rallied strongly toward $3,575/oz, but heavy selling pressure emerged right at this key resistance. The pressure came after fresh U.S. economic data: the ISM Services PMI came in at 50.9, beating expectations of 50.1, signaling that the services sector – the backbone of the U.S. economy – remains solid. This strengthened the USD and weighed on gold, preventing it from holding its bullish momentum.
From a technical perspective, gold printed a strong rejection candle at the $3,575 resistance, confirming sellers’ dominance. After an extended rally, price is now stretched far above the EMA 34 and 89, often a signal of a likely pullback to equilibrium.
The nearest support lies at $3,473; if broken, the decline could extend further toward $3,423 . In the short term, the main scenario favors gold staying below $3,575 and correcting down toward $3,473. On the other hand, if an H4 candle surprisingly closes above $3,575 , the bullish trend could resume – but this is less likely while the USD remains supported by positive economic data.
What do you think about this trend?

GBPUSD – Short-Term Downside Pressure ReturnsOn the 1H chart, GBPUSD failed to break above the 1.3460 resistance and quickly reversed lower. The EMA 34 & 89 are positioned just above price, acting as additional barriers reinforcing the bearish bias. The nearest support sits at 1.3390 – if broken, the market could extend its decline toward lower ranges.
Recent news: The British pound remains under pressure as UK economic data continues to disappoint, while the US dollar gains strength on the back of a stronger-than-expected ISM Services PMI report. This combination makes it difficult for GBPUSD to sustain any rebound.
Trading idea:
Favor shorts below 1.3460
Short-term target: 1.3390
A decisive break below 1.3390 could open the door for deeper downside moves.
Bottom line: GBPUSD is leaning toward a bearish scenario, with both technicals and fundamentals currently favoring the US dollar.
