Goatseus Maximus Hooves the Dust. Ready to Buck Up Soon!Goatseus Maximus looks like an entry win here. Check out that long accumulation period. Bullish, or should I say, "GOATish"? Additionally, I have a signal to buy from my proprietary indicator. I will be a bit more aggressive on this one with a 1:4 rrr, targeting around .16 cents and stopping out at around .07. On this one, I may sell half a little earlier. Once we reach that ascending trendline, I will be watching price action closely. Keep an eye on my trade tracker for more.
Longsetup

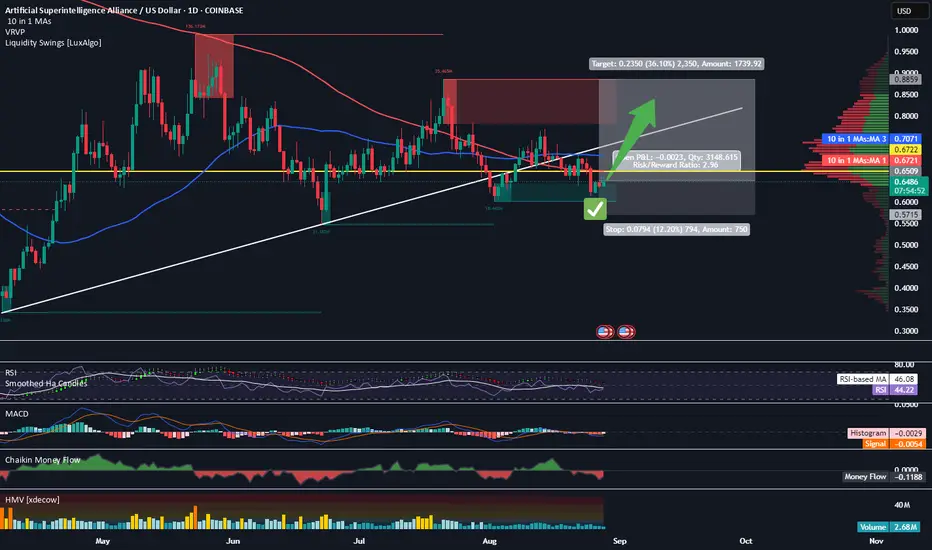
Long Signal Given on Fetch AIFetch AI runs hot when it goes. Recently, I received a BUY alert from my indicator letting me know that we’re getting close to another run soon. I have entered here and will have a fairly conservative target of .88. My SL is .57, giving me a fairly modest 1:3 rrr. My plan is to sell half at the target and let the rest ride. Of course, that could always change with time, so keep an eye on my trade tracker.
GBPAUD: Continued Downward PressureBased on the recent GBPAUD chart, the market shows signs of a short-term downtrend after failing to break through the resistance levels around 2.0820. Currently, the price is testing key support levels, and if it continues to stay below this resistance, a decline towards 2.0670 could occur.
Technical Analysis: GBPAUD is currently trading near the 2.0725 area. The key resistance remains at 2.0820. If the price remains below this level, a downtrend towards 2.0670 is possible. The support levels at 2.0725 and 2.0670 will be crucial to watch for confirming the downward trend.
Market Factors: Strong economic data from the U.S., particularly higher GDP growth and lower-than-expected unemployment claims, have strengthened the USD, negatively impacting GBP. This may continue to put pressure on GBP, causing GBPAUD to decline.

XAUUSD: Short-Term Decline Awaiting a Correction?XAUUSD is currently in a short-term downtrend, and the chart suggests that the price could continue to decrease if resistance levels are not broken. The short-term target is 3,362.30.
Technical Analysis: XAUUSD is trading below the resistance level at 3,403.70. If it remains below this level, the next targets will be 3,362.30.
Fundamental Analysis: Strong economic data from the U.S., particularly the preliminary quarterly GDP, lower-than-expected jobless claims, and a higher-than-expected core PCE index, all support the U.S. dollar. As the USD strengthens, the demand for gold decreases, pushing the price of gold lower.
Trading Strategy: Open a sell order when the price remains below 3,403.70, with targets at 3,362.30. Place a stop-loss above the 3,403.70 resistance level to protect the trade.
With both technical and fundamental factors supporting the bearish trend, XAUUSD may continue its short-term decline.

GBPUSD: Strong Uptrend – Heading Toward New LevelsGBPUSD is in an uptrend after breaking through key resistance levels. The chart shows that if the price continues to hold above 1.33870, the pair could target 1.34990 in the short term.
Technical Analysis: GBPUSD is currently trading near the support level at 1.33870. If the price holds above this level and does not break it, the likelihood of further upside is high, with the next target at 1.34990.
Fundamental Analysis: Following negative news from the USD, particularly President Donald Trump’s statement about firing a Federal Reserve board member, the USD weakened. This has created an opportunity for GBP to strengthen.
Trading Strategy: Open a buy order when the price holds above 1.33870, targeting 1.34990. Set a stop-loss below 1.33870 to protect the trade.

EURUSD: Strong Uptrend – Ready to Break Key LevelsEURUSD is currently in a stable uptrend, breaking through key resistance levels. The chart shows that the pair could continue to rise as the price breaks above 1.16040 and targets 1.16670 and 1.17020 in the short term.
Technical Analysis: The price is currently trading near important support levels at 1.16040. If EURUSD holds above this level, the pair could continue to move higher, with targets at 1.16670 and 1.17020.
Fundamental Analysis: The USD has weakened following President Donald Trump's statement about firing a Federal Reserve board member. Additionally, weak economic data from the US, including a decline in durable goods orders, has increased expectations that the Fed will cut interest rates. This has provided momentum for EURUSD to rise.
Trading Strategy: Open a buy order when the price breaks above 1.16040, with targets at 1.16670 and 1.17020. Place a stop-loss below the support level at 1.16040 to protect the trade.

Bullish Setup for XAU/USDHello traders , the gold market is currently in a sensitive phase, still influenced by Fed Chair Jerome Powell’s remarks at Jackson Hole, signaling that monetary tightening could ease if the labor market weakens. This has pushed U.S. bond yields lower and weakened the dollar, allowing gold to remain elevated.
Adding to this , rising geopolitical tensions are fueling bullish momentum for gold, providing a solid foundation for recovery if global risks persist.
On the chart , gold is trading around $3,370, after bouncing strongly from the $3,321 support. This zone is becoming a “launchpad” for the next leg higher, especially as gold holds above key EMA levels.
The price structure outlines a bullish scenario with resistance targets:
$3,400 (psychological level – short-term take profit zone)
$3,433 (extended target – next strong resistance)
If the Fed maintains its dovish tone and the dollar stays weak , gold could sustain its upward momentum in the short term, opening the door to higher levels into September.

AUDUSD: Uptrend SupportedCurrently, AUDUSD is showing a steady uptrend, with the price staying above important support levels and gradually moving towards the next resistance levels. The chart shows a break of the 0.64700 resistance, which opens up further growth potential. The nearest target for this pair is 0.65600, and if the trend continues, AUDUSD may push further upwards.
Fundamental Analysis: After Fed Chairman Jerome Powell's remarks, the weakening of the USD has given more strength to the AUD. If the core PCE index on August 29 comes in lower than expected, this could result in a less aggressive rate hike, weakening the USD, while both gold and AUD continue to rise.
Trading Strategy: If the price of AUDUSD breaks through the 0.64700 resistance zone, consider opening a buy position with a target at 0.65600. To protect the trade, set a stop-loss below the 0.64700 support level. In case of a price correction, the 0.64700 level remains an important point to monitor for a continuation of the uptrend.
With supporting technical and fundamental factors, the uptrend of AUDUSD is likely to continue in the near future. Keep an eye on economic news and adjust strategies accordingly to take advantage of this upward momentum.

Gold Continues Strong Rise – Will the PCE Decide the Trend?XAUUSD is currently in a strong uptrend, breaking through key resistance levels and staying above the EMA (34) and EMA (89), with support at 3,363 USD. The next resistance levels for gold are at 3,400 USD , with TP1 at 3,408 USD and TP2 at 3,435 USD. If gold stays above these support levels and breaks through 3,400 USD, the uptrend will continue, targeting higher levels.
From a fundamental perspective, a few days ago, Fed Chairman Jerome Powell's remarks indicated expectations to maintain a tightening policy if economic data continues to support it. The core PCE index on August 29 will be the deciding factor for gold's trend. If the PCE index is higher than expected (0.3%), the USD could strengthen, putting downward pressure on gold. On the other hand, if the index is lower than expected, the USD will weaken, and gold could continue its strong uptrend.
In conclusion, if gold stays above 3,361 USD and breaks through the 3,400 USD resistance level, the uptrend will continue, with targets of 3,408 USD (TP1) and 3,435 USD (TP2). However, the upcoming PCE index results will be the deciding factor for whether gold can continue its rise. Stay tuned and keep an eye on the market!

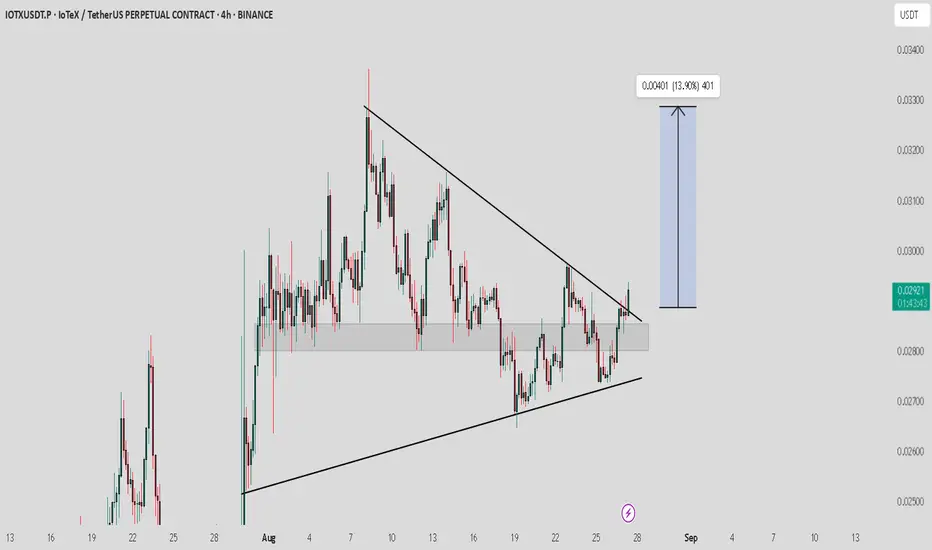
IOTX / USDT : Breaking out from symmetrical triangleIOTX/USDT has broken out from the symmetrical triangle. The key now is confirmation — a retest of the breakout zone may occur before continuation. If this level holds, price could rally toward the $0.0315 – $0.033 zone (+13–15%).
Trade Setup:
Entry: On successful retest hold / bullish confirmation candle above $0.030
Targets: $0.0315 – $0.033
Stop-Loss: Below $0.028 (breakout zone invalidation)
Best strategy: Wait for retest confirmation to avoid getting trapped in a false breakout.
BTC is correcting down, accumulating around 110k💎 MID-WEEK BTC PLAN UPDATE (27/08)
📌 BTC Plan Update
BTC has followed the expected scenario:
We successfully shorted at the 117K resistance zone – where the Fibonacci 0.236 level aligned with a strong previous resistance area.
After that, price dropped sharply to the key support zone at 108K, where we successfully longed thanks to the confluence of Fibonacci 0.618 – EMA200 – and the demand zone.
Currently, price is reacting around the 111K – 112K range. Although it hasn’t broken out clearly yet, this is a signal that the market may gradually start accumulating again.
➡️ The important thing now is to hold positions and patiently wait for stronger bullish signals at the next resistance zones (114K – 117K) to confirm a recovery trend.
XAUUSD📈 XAUUSD – 1H Timeframe
🟢 Long Call/ Bullish Candle
🔹 Gold is forming HH & HL (Higher Highs & Higher Lows) on the 1H chart → Uptrend structure intact.
🔹 Fib Retracement Setup → Perfect dip-buy opportunity from CMP (Current Market Price).
💡 Plan:
👉 Buy from CMP 🎯
👉 Book partial profits on resistance levels 🪙
👉 SL below Fib retracement 🔒
🌍 Weekly Fundamental Drivers:
1️⃣ Fed remains cautious on rate cuts, supporting safe-haven demand 🏦
2️⃣ Geopolitical uncertainty & central bank gold buying continue to give long-term bullish momentum 🌐
⚠️ Risk Management: Stay disciplined — let structure + fundamentals guide your trade.

Gold price in uptrend, up to 3405⭐️GOLDEN INFORMATION:
Gold (XAU/USD) slips during Wednesday’s Asian session, retreating from a two-week high near $3,395 amid profit-taking and a modest US Dollar rebound. However, downside risks remain limited by concerns over Fed independence after President Trump intensified efforts to remove a Fed governor, reinforcing Gold’s safe-haven appeal.
Markets now focus on the Russia-Ukraine situation and Friday’s US PCE inflation data. A hotter-than-expected reading could temper Fed rate-cut hopes, while geopolitical tensions may continue to support the yellow metal
⭐️Personal comments NOVA:
Gold price continues to increase in price according to stable trend line. Price range 3352 - 3405
⭐️SET UP GOLD PRICE:
🔥SELL GOLD zone: 3404- 3406 SL 3411
TP1: $3395
TP2: $3383
TP3: $3370
🔥BUY GOLD zone: $3350-$3352 SL $3345
TP1: $3360
TP2: $3370
TP3: $3380
⭐️Technical analysis:
Based on technical indicators EMA 34, EMA89 and support resistance areas to set up a reasonable BUY order.
⭐️NOTE:
Note: Nova wishes traders to manage their capital well
- take the number of lots that match your capital
- Takeprofit equal to 4-6% of capital account
- Stoplose equal to 2-3% of capital account

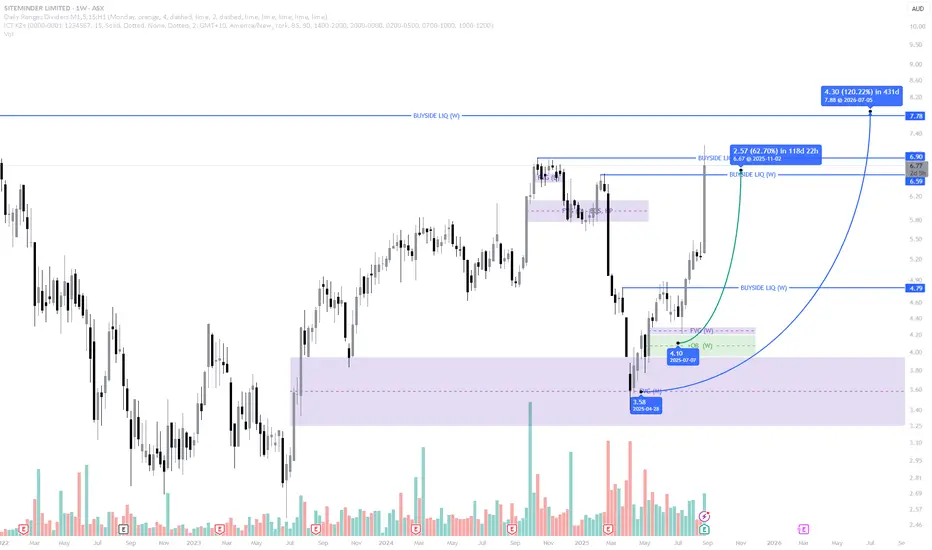
SDR – Textbook Respect of PD Arrays Leading to Explosive UpsideExplanation
The move we anticipated on SDR has now unfolded exactly as outlined, with price reacting strongly from the higher-timeframe PD arrays.
Fair Value Gap (FVG): Price tapped perfectly into the monthly/weekly FVG and used it as a springboard for accumulation. This zone served as the rebalancing point for inefficient pricing.
Order Block (OB): The bullish OB inside the FVG held as expected, providing the structural base for buyers to step in and defend.
Liquidity Dynamics: Prior to the move, sell-side liquidity was swept, clearing weak longs and fuelling the drive higher. Once liquidity was taken, momentum shifted sharply to the upside.
Buyside Targets: Price has now begun its run into the weekly buyside liquidity levels at 6.90 and beyond, with the higher target around 7.78 still in play.
This reaction is a textbook ICT move: sweep → rebalance via FVG → respect of OB → expansion toward buyside.
✅ Key Takeaway: The predictive model played out exactly, proving once again that respecting PD arrays across HTFs provides a high-probability roadmap for price action.
USD/JPY: Downtrend Continues with Weak SupportCurrent Situation:
USD/JPY is trading around 147.60, down from its recent high of 148.700. The pair has broken through the key support level at 147.800, opening the possibility for further downside.
Downward Target:
If USD/JPY maintains below 147.800, the downtrend could continue, with the next support levels at 146.800 and 146.300.
Trading Strategy:
Prioritize selling on any bounce towards 147.500–147.800. Set the target at 146.800 and 146.300, with a stop loss above 148.00 for risk management.
Supporting News:
Fed Chair Jerome Powell, speaking at Jackson Hole, signaled that the Fed may ease tightening sooner if the labor market weakens. This has led to a decline in U.S. bond yields and a weaker USD, providing favorable conditions for JPY to strengthen.

Bitcoin: Is the Uptrend Gaining Strength?Bitcoin (BTC) is currently trading around $110,280, after a drop from a recent peak of $116,700. Despite the correction, BTC remains above important support levels, consolidating its uptrend.
Supporting News:
Fed Chair Jerome Powell's remarks at Jackson Hole signal that the Fed may ease tightening measures if the labor market weakens. This has led to a decline in U.S. bond yields and a weaker USD, providing favorable conditions for BTC to maintain its upward momentum.
Technical Analysis:
BTC has broken through the resistance at $116,700 and is now consolidating above support at $108,900. If it stays above this level, BTC could continue targeting $116,700 and possibly even $120,000.
Conclusion:
With the support of Fed policies and a positive market trend, BTC has strong potential for further short-term gains.

BYD Bullish Stock Going UP and ConfirmedHello,
Ayrfolio trade ideas are based on weekly charts and momentum, so remember to be patient! No day trades here unless the stock soars up intraday. Today we’re covering:
COMPANY: Boyd Gaming Corporation
STOCK SYMBOL: BYD
POSITION: Long
TP1 Risk-Reward Ratio: 1.94
TP2 Risk-Reward Ratio: 3.87
Stop Loss: must wait AFTER daily candle closes to exit trade (regular candle, NOT Heiken Ashi)
Ultimate Stop Loss: can exit IMMEDIATELY if price reaches this level during any trading hours
EXPLANATION: Weekly momentum increased and confirmed on Monday 7/28/25 at $85.94/share. Although the stop losses are listed on the chart, if momentum has been lost then we can exit before the price reaches the stop loss.
DISCLAIMER: Please do your own due diligence before making any decisions.
P.S. - Stocks can soar. YOU can soar. Soaring is possible!
-Ayrfolio

Uptrend, gold price back above 3400⭐️GOLDEN INFORMATION:
Gold (XAU/USD) finds renewed buying interest around $3,375 during Tuesday’s Asian session, supported by concerns over the Federal Reserve’s independence following reports that US President Donald Trump plans to remove Fed Governor Lisa Cook. Adding to the upside, growing expectations that the Fed will resume its rate-cutting cycle are providing further support, as lower interest rates reduce the opportunity cost of holding the non-yielding metal.
⭐️Personal comments NOVA:
Gold prices show sustained buying power, along with President Trump's moves to pressure the FED to lower interest rates immediately. Heading towards over 3400 new long-term price increases
⭐️SET UP GOLD PRICE:
🔥SELL GOLD zone: 3429- 3431 SL 3436
TP1: $3420
TP2: $3410
TP3: $3400
🔥BUY GOLD zone: $3350-$3352 SL $3345
TP1: $3360
TP2: $3370
TP3: $3380
⭐️Technical analysis:
Based on technical indicators EMA 34, EMA89 and support resistance areas to set up a reasonable BUY order.
⭐️NOTE:
Note: Nova wishes traders to manage their capital well
- take the number of lots that match your capital
- Takeprofit equal to 4-6% of capital account
- Stoplose equal to 2-3% of capital account

EUR/USD – Is the Uptrend Coming Back?EUR/USD is trading around 1.162–1.163, after a slight rebound from the support zone near 1.16100. The uptrend is reinforced as the pair holds above key EMAs and maintains a clear technical structure.
The nearest upside target is the resistance area around 1.16500, followed by the July high near 1.17000 if momentum remains strong.
Suggested strategy: Favor Buy on dip around 1.1600–1.1610. Target 1.1650 first, then 1.1700+. Stop-loss below 1.1580.
Supporting news: At Jackson Hole, Powell signaled that the Fed could ease policy if the labor market weakens, pushing the USD lower and boosting EUR/USD. The pair sustains its recovery as key support holds, aiming for a breakout above higher resistance.

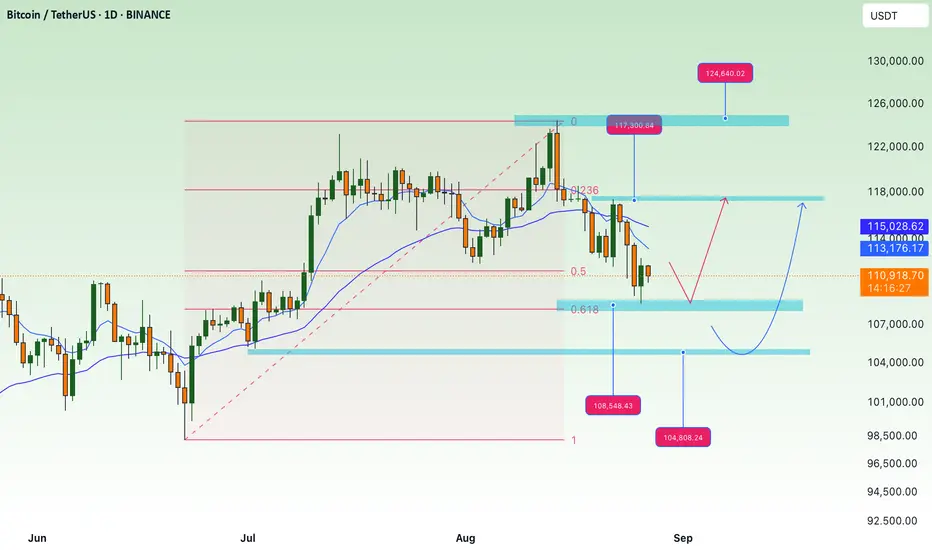
BTC/USDT: Breakout, Heading for a Bullish WaveBTC/USDT staged a strong breakout following dovish signals from the Fed at Jackson Hole, which drove capital back into risk assets, with Bitcoin among the biggest beneficiaries. At the same time, Tether’s move to increase transparency by appointing a former White House crypto adviser has further strengthened market confidence, supporting the medium-term bullish outlook.
On the chart, price is seeing a mild correction around 111,000–112,000 but remains within the long-term ascending channel. The 107,800 zone acts as key support; if it holds, BTC could rebound toward the next resistance area near 123,600. Conversely, a break below 107,800 would put the bullish structure at risk.
With favorable news and a strong technical setup, BTC/USDT continues to lean toward an upside scenario, making buy-the-dip strategies attractive.

AUD/USD: Recovery After a Sharp DeclineAUD/USD fell sharply to a two-month low around 0.6410 after the USD strengthened significantly, driven by reduced market expectations of a Fed rate cut in September, while the RBA kept interest rates unchanged, providing no additional support for the Aussie. However, following the heavy selling pressure, the pair staged a technical rebound toward 0.6490, mainly supported by USD profit-taking, though this is not yet a signal of a sustainable bullish trend.
On the chart, the 0.6480 support level is still holding, and price is now moving toward the 0.6520 resistance zone. A breakout above this level could reinforce short-term bullish momentum and extend the recovery. Conversely, failure to break higher may lead to a pullback toward 0.6445, or even a retest of the 0.6414 low.
In the current context, this is viewed as an important technical rebound after a steep drop, but not yet enough to confirm a long-term uptrend. Traders should carefully watch the market’s reaction around the 0.6520 resistance before deciding on their next strategy.

USD/JPY: Increasing Downside PressureUSD/JPY is currently trading around the 147 level after a technical rebound, but the overall trend still leans to the downside. Recent news shows that the Fed has adopted a dovish stance, weakening the USD, while strong Japanese economic data has reinforced expectations that the BoJ may tighten policy further, lending greater support to the yen. Major institutions such as Nomura have even forecast that USD/JPY could fall toward the 142 area in the coming months.
From a technical perspective, the 148.2 resistance zone is acting as a strong barrier, where price is unlikely to break through given the current news backdrop does not favor USD strength. On the contrary, failure at this level could trigger a reversal, with USD/JPY likely to retest support at 146.2 and potentially extend lower toward the 145 region – a key area that could determine a deeper decline.
Thus, despite short-term fluctuations caused by profit-taking and temporary balance, the medium-term outlook continues to favor a bearish trend, in line with both fundamental drivers and the current technical structure.

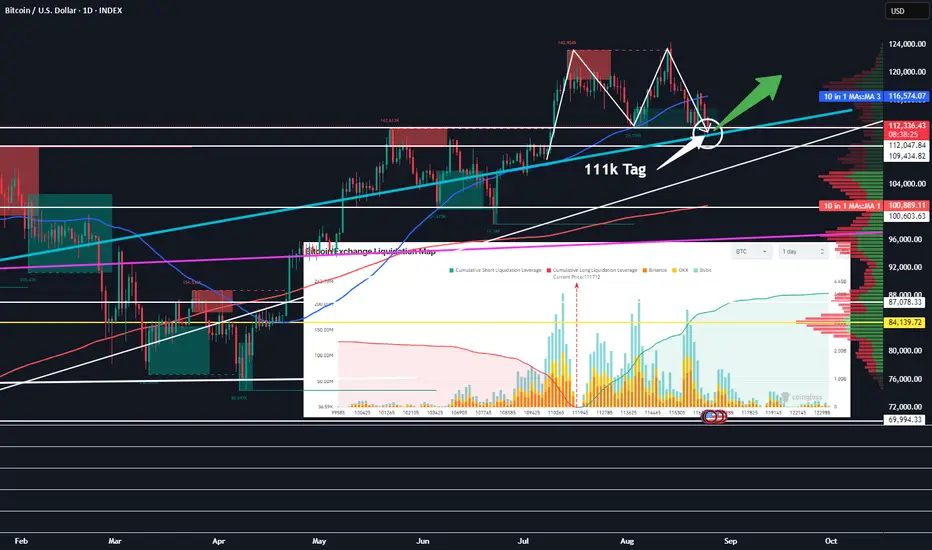
Bitcoin Technically Perfect With 111k Tag!Good Morning Traders,
I have been expecting a retest of our 111k support for some time now. Yesterday and today, we have tagged this support with our daily candle wicks. I expect our 111k support to hold strong. It represents strong support and the completion of an "M Pattern". Though we could wick down quickly to 109k to free up another 100 million+ in leveraged longs, this move would likely be very quick, and I am not certain the market makers and manipulators would even deem it a worthwhile endeavor. However, just to be certain, if you are going long here, I would certainly place any stops somewhere below 109k pending risk tolerance. By the end of this week, I am expecting Bitcoin to start moving up again.
✌️Stew