Gold price increase - towards 3825⭐️GOLDEN INFORMATION:
Gold (XAU/USD) hovers near $3,800 in Monday’s Asian session, supported by in-line US inflation data that reinforced expectations of further Fed rate cuts this year. Geopolitical uncertainty also underpins safe-haven demand, though upcoming remarks from several Fed officials could sway the Dollar and limit gains for bullion.
⭐️Personal comments NOVA:
continue to rise - above 3790 and hit 3825 resistance today
⭐️SET UP GOLD PRICE:
🔥SELL GOLD zone: 3825- 3827 SL 3832
TP1: $3817
TP2: $3808
TP3: $3792
🔥BUY GOLD zone: $3759-$3757 SL $3752
TP1: $3770
TP2: $3780
TP3: $3790
⭐️Technical analysis:
Based on technical indicators EMA 34, EMA89 and support resistance areas to set up a reasonable BUY order.
⭐️NOTE:
Note: Nova wishes traders to manage their capital well
- take the number of lots that match your capital
- Takeprofit equal to 4-6% of capital account
- Stoplose equal to 2-3% of capital account
Longsignal

LONG ON BITCON BTC/USDBitcoin has started its (New Downtrend) after it completed a change of character on the Daily on Aug 25th.
I am looking to catch the pullback to the next key level of supply before turning around and selling bitcoin to the next swing low.
On this buy trade I will be looking to make 5000 points.

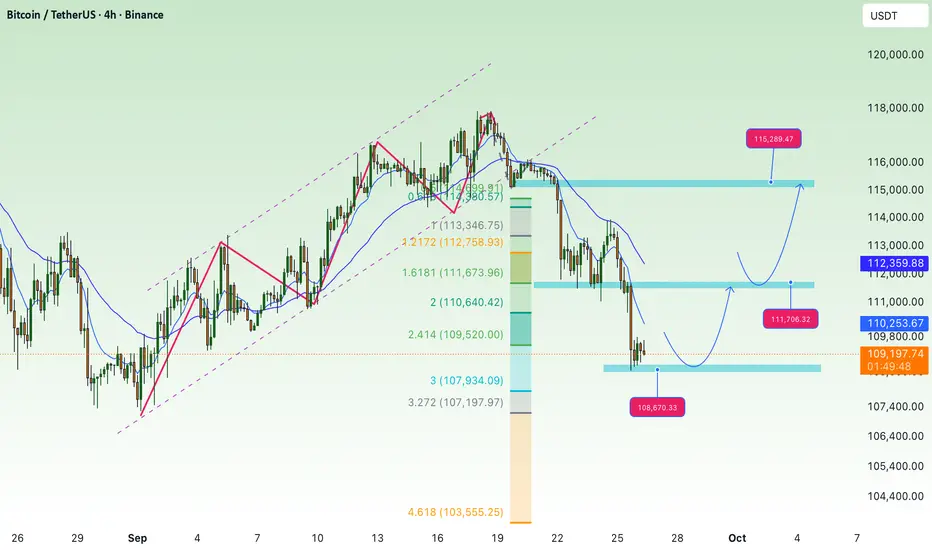
waiting for BTC to recover, accumulate above 107KBTC Technical Analysis (4H Chart):
After breaking down from the rising channel, BTC has confirmed a bearish structure, forming lower highs and lower lows.
Price recently bounced from the 108,800–109,000 support zone, which aligns with the 2.618 Fibonacci extension. This is a key short-term support area to watch.
If buyers can hold this support, BTC may retest the 111,600–111,700 resistance zone. A breakout above could open the path toward the higher resistance at 115,300–115,400.
On the downside, if the 109,000 zone fails, the next bearish targets lie at 105,900 and deeper Fibonacci projections around 104,200–103,100.
Trend Outlook:
Short-term: Possible recovery toward 111,600 or even 115,300 if demand holds above 109,000.
Medium-term: Still bearish-biased as long as price stays under the 200 EMA (~114,000).
Key Levels to Note:
Resistance: 111,600 – 111,700, 115,300 – 115,400
Support: 109,000, 105,900, 104,200 – 103,100
DRIFT LONgWith the chart it has, we can get a good growth from it. Everything is clear and supported by the price and I expect growth this week. Finally with leverage 2

continue to increase in price - bulls 3784⭐️GOLDEN INFORMATION:
Gold (XAU/USD) eases slightly after setting a fresh record high near $3,760 in Tuesday’s Asian session, as bulls take a breather amid overbought conditions and firm risk appetite in equities. Still, expectations of further Fed rate cuts following last week’s policy easing, along with persistent geopolitical tensions, keep the downside limited and underpin demand ahead of Fed Chair Powell’s speech later today.
⭐️Personal comments NOVA:
Gold price has huge buying power, continuing the upward trend to create new peaks.
⭐️SET UP GOLD PRICE:
🔥SELL GOLD zone: 3783- 3785 SL 3790
TP1: $3772
TP2: $3760
TP3: $3750
🔥BUY GOLD zone: $3697-$3695 SL $3690
TP1: $3708
TP2: $3720
TP3: $3730
⭐️Technical analysis:
Based on technical indicators EMA 34, EMA89 and support resistance areas to set up a reasonable BUY order.
⭐️NOTE:
Note: Nova wishes traders to manage their capital well
- take the number of lots that match your capital
- Takeprofit equal to 4-6% of capital account
- Stoplose equal to 2-3% of capital account

continued price increase, buying power GOLD⭐️GOLDEN INFORMATION:
Gold (XAU/USD) holds modest gains near $3,685 in early Asian trading on Monday, supported by the Fed’s 25 bps rate cut at its September meeting—the first of 2025. The move, driven by a cooling labor market and rising employment risks despite sticky inflation, lowers the opportunity cost of holding bullion. Traders now await fresh cues from Fed officials later in the day.
⭐️Personal comments NOVA:
Gold price continues to increase after short-term correction, approaching ATH 3700 price zone
⭐️SET UP GOLD PRICE:
🔥SELL GOLD zone: 3717- 3719 SL 3724
TP1: $3710
TP2: $3700
TP3: $3690
🔥BUY GOLD zone: $3658-$3660 SL $3653
TP1: $3670
TP2: $3680
TP3: $3690
⭐️Technical analysis:
Based on technical indicators EMA 34, EMA89 and support resistance areas to set up a reasonable BUY order.
⭐️NOTE:
Note: Nova wishes traders to manage their capital well
- take the number of lots that match your capital
- Takeprofit equal to 4-6% of capital account
- Stoplose equal to 2-3% of capital account

ETH ANALYSIS🔴 #ETH Analysis : ❓❓
🔮There is a formation of "Bullish Pennant Pattern" in #ETH in 4HR time frame. We can expect around $4850 bullish move if the price break the pattern.📈
⚡️What to do ?
👀Keep an eye on #ETH price action. We can trade according to the chart and make some profits. ⚡️⚡️
#ETH #Cryptocurrency #Breakout #DYOR

BB ANALYSIS🔆#BB Analysis : Channel Following ⛔️⛔️
As we can see that #BB is following ascending channel on daily time frame. We can see a bullish formation here. And if it trade with good volume then we can see a proper bullish move in #BB 📈📈
Also there is an instant resistance zone and if it breaks with good volume when we would see a huge movement
🔖 Current Price: $0.1714
⏳ Target Price: $0.2323
⁉️ What to do?
- Keep your eyes on the chart, observe trading volume and stay accustom to market moves.🚀💸
#BB #Cryptocurrency #ChartPattern #DYOR

BULLISH ON GBP/NZDGBP/NZD has reached a nice demand zone and has created a beautiful inverse head and shoulders pattern.
Price is just now giving us a CHOC (Change of Character) to the upside breaking a previous strong high to the left.
I am waiting for price to pullback into that same demand area before buying, also watch out for the sweep below the (Head) of the Head and Shoulders.
Looking to catch 300-400 pips.

Interest rate cut, can gold reach 3700?✍️ NOVA hello everyone, Let's comment on gold price next week from 09/15/2025 - 09/19/2025
⭐️GOLDEN INFORMATION:
Gold (XAU/USD) climbed 0.44% in Friday’s North American session, trading near $3,649 after rebounding from $3,630, as weak US labor and sentiment data strengthened expectations of a Fed rate cut next week. Softer University of Michigan Consumer Sentiment, rising jobless claims, and a steep payrolls revision overshadowed this week’s inflation figures, reinforcing the view that the labor market is cooling. Markets now widely anticipate the first rate cut at the September 17 FOMC meeting, following Chair Powell’s signal at Jackson Hole that policy adjustments may be needed.
⭐️Personal comments NOVA:
Financial markets await the outcome of interest rate cuts next week. Gold prices are expected to continue rising, reaching 3700.
🔥 Technically:
Based on the resistance and support areas of the gold price according to the H4 frame, NOVA identifies the important key areas as follows:
Resistance: $3674, $3700
Support: $3612, $3578
🔥 NOTE:
Note: Nova wishes traders to manage their capital well
- take the number of lots that match your capital
- Takeprofit equal to 4-6% of capital account
- Stoplose equal to 2-3% of capital account
- The winner is the one who sticks with the market the longest

Gold price accumulates in uptrend above 3574⭐️GOLDEN INFORMATION:
Gold (XAU/USD) extends Thursday’s rebound, climbing past $3,650 in Friday’s Asian trade and staying close to this week’s record high. Weaker US jobs data overshadowed hotter inflation, reinforcing Fed rate-cut bets, pressuring the Dollar to its lowest since late July and lifting demand for the metal. Political unrest in France and Japan, persistent trade frictions, and rising geopolitical risks further support safe-haven flows. Despite overbought conditions and a risk-on mood in equities, Gold remains on track for a fourth straight weekly gain, with momentum favoring the upside.
⭐️Personal comments NOVA:
Gold prices continue to recover, accumulating in an uptrend. The market is still very excited because of the interest rate cut on September 17.
⭐️SET UP GOLD PRICE:
🔥SELL GOLD zone: 3674- 3676 SL 3681
TP1: $3666
TP2: $3650
TP3: $3640
🔥BUY GOLD zone: $3573-$3575 SL $3568
TP1: $3588
TP2: $3600
TP3: $3610
⭐️Technical analysis:
Based on technical indicators EMA 34, EMA89 and support resistance areas to set up a reasonable BUY order.
⭐️NOTE:
Note: Nova wishes traders to manage their capital well
- take the number of lots that match your capital
- Takeprofit equal to 4-6% of capital account
- Stoplose equal to 2-3% of capital account

continue to maintain long-term uptrend⭐️GOLDEN INFORMATION:
Gold (XAU/USD) extends its intraday climb on Tuesday, holding near record highs as weak US jobs data reinforces expectations of aggressive Fed rate cuts. The softer labor outlook limits the Dollar’s rebound and supports renewed demand for the safe-haven metal after Monday’s brief pullback.
⭐️Personal comments NOVA:
Gold prices continue to maintain an upward trend, with strong buying power ahead of the interest rate cut. The market is still very excited.
⭐️SET UP GOLD PRICE:
🔥SELL GOLD zone: 3684- 3686 SL 3691
TP1: $3675
TP2: $3662
TP3: $3650
🔥BUY GOLD zone: $3596-$3598 SL $3591
TP1: $3608
TP2: $3620
TP3: $3633
⭐️Technical analysis:
Based on technical indicators EMA 34, EMA89 and support resistance areas to set up a reasonable BUY order.
⭐️NOTE:
Note: Nova wishes traders to manage their capital well
- take the number of lots that match your capital
- Takeprofit equal to 4-6% of capital account
- Stoplose equal to 2-3% of capital account

TIA ANALYSIS🚀#TIA Analysis : What Next ??💲💲
✅As we can see that there was a formation of Descending Triangle Pattern in #TIA and given a breakout. We are expecting around more than 30% bullish move in coming weeks 📈📈
🔰Current Price: $1.815
🎯 Target Price: $2.081
⚡️What to do ?
👀Keep an eye on #TIA price action. We can trade according to the chart and make some profits. Stay tuned for further analysis and stay updated with market sentiments and news.⚡️⚡️
#TIA #Cryptocurrency #TechnicalAnalysis #DYOR

LONG ON ETHEREUMEthereum is coming from a major demand area after sweeping liquidity.
I am taking a buy limit order on ETH looking to catch price rising to the previous highs. Over 500-600 points.

short correction, continue to create new ATH⭐️GOLDEN INFORMATION:
Gold (XAU/USD) consolidates near record highs just below $3,600 on Monday, pausing after Friday’s surge. A modest US Dollar rebound and upbeat equity sentiment cap gains, though expectations of aggressive Fed rate cuts and continued central bank buying underpin the metal. Overbought conditions may limit fresh upside ahead of key US inflation data later this week.
⭐️Personal comments NOVA:
Selling pressure, short-term profit taking at ATH 3600. Gold price adjusted down to accumulate for the upcoming big uptrend.
⭐️SET UP GOLD PRICE:
🔥SELL GOLD zone: 3612- 3614 SL 3619
TP1: $3600
TP2: $3590
TP3: $3580
🔥BUY GOLD zone: $3563-$3561 SL $3556
TP1: $3570
TP2: $3580
TP3: $3590
⭐️Technical analysis:
Based on technical indicators EMA 34, EMA89 and support resistance areas to set up a reasonable BUY order.
⭐️NOTE:
Note: Nova wishes traders to manage their capital well
- take the number of lots that match your capital
- Takeprofit equal to 4-6% of capital account
- Stoplose equal to 2-3% of capital account
keep growing, new ATH 3648✍️ NOVA hello everyone, Let's comment on gold price next week from 09/08/2025 - 09/12/2025
⭐️GOLDEN INFORMATION:
Gold (XAU/USD) surged to a record high of $3,600 on Friday after weak US Nonfarm Payrolls data fueled speculation of aggressive Fed rate cuts. The metal trades at $3,594, up 1.30%, as soft labor data drove Treasury yields and the Dollar lower. The 2-year yield, most sensitive to Fed policy shifts, slid over 11 basis points to 3.48%, reinforcing expectations of imminent easing.
⭐️Personal comments NOVA:
Gold price hits new ATH 3600 and still maintains uptrend, bullish momentum thanks to interest rate cut in September
🔥 Technically:
Based on the resistance and support areas of the gold price according to the H4 frame, NOVA identifies the important key areas as follows:
Resistance: $3648
Support: $3508, $3465
🔥 NOTE:
Note: Nova wishes traders to manage their capital well
- take the number of lots that match your capital
- Takeprofit equal to 4-6% of capital account
- Stoplose equal to 2-3% of capital account
- The winner is the one who sticks with the market the longest

BTC ANALYSIS📊 #BTC Analysis
✅There is a formation of Descending Channel Pattern in daily time frame in #BTC .
Also there is a perfect breakout and retest. There is an instant major resistance and major support zone and if #BTC breaks the resistance zone then we would see a bullish move
👀Current Price: $1,10,800
🎯 Target Price : $1,21,700
⚡️What to do ?
👀Keep an eye on #BTC price action and volume. We can trade according to the chart and make some profits⚡️⚡️
#BTC #Cryptocurrency #Breakout #TechnicalAnalysis #DYOR

Gold prices are still supporting price increases⭐️GOLDEN INFORMATION:
Gold (XAU/USD) inches higher in Friday’s Asian session, extending its rebound from the $3,500 level and staying close to this week’s record highs. Expectations of at least two Fed rate cuts this year, starting in September, keep the US Dollar subdued and support the safe-haven metal, while trade tensions add to its appeal. However, upbeat risk sentiment and overbought conditions could cap gains as traders await the US Nonfarm Payrolls report later today for fresh cues on Fed policy.
⭐️Personal comments NOVA:
The market is expecting continued good news for gold, rate cuts and gold hitting above 3600.
⭐️SET UP GOLD PRICE:
🔥SELL GOLD zone: 3600- 3598 SL 3605
TP1: $3585
TP2: $3568
TP3: $3552
🔥BUY GOLD zone: $3482-$3484 SL $3477
TP1: $3490
TP2: $3500
TP3: $3510
⭐️Technical analysis:
Based on technical indicators EMA 34, EMA89 and support resistance areas to set up a reasonable BUY order.
⭐️NOTE:
Note: Nova wishes traders to manage their capital well
- take the number of lots that match your capital
- Takeprofit equal to 4-6% of capital account
- Stoplose equal to 2-3% of capital account

BTC starts to show signs of recovery💎 BTC PLAN UPDATE – START OF WEEK (09/03/2025 )
Mid-week BTC Analysis
Currently, BTC is reacting around the support zone ~111,000 – 110,500 (confluence of EMA200 D1 and 0.5 Fibonacci). This is an important short-term support area; if it holds, a rebound may occur in the next few sessions.
If BTC bounces from this level, it could retest short-term resistance levels at:
• 111,900 – 112,200 (EMA34 + nearest resistance)
• 114,100 – 114,500 (0.382 Fibonacci)
• 116,000 – 117,000 (0.236 Fibonacci + previous strong resistance)
If the 110,500 support is broken, price could easily drop toward:
• 108,400 – 108,000 (mid-term support)
• 104,800 – 105,000 (major support, extended Fibonacci zone)
Trend:
• Mid-term: still in a corrective downtrend.
• Short-term: possible technical rebound from current support zone, with the first target around 114,000 – 116,000.
👉 In summary: Mid-week, BTC is at a critical zone. Holding 110,500 – 111,000 favors a rebound scenario; if this area breaks, downside pressure may extend toward 108K – 105K.

LONG ON ETH/USD ETHEREUMEthereum has a nice falling wedge into a major demand zone.
I will be taking ETH as a market buy now looking for price to reach 5000
making over 500 points to the previous High.
IDOL / USDT : Approaching resistance with strong potentialIDOL/USDT is approaching a key trendline resistance. A successful breakout from this level could trigger a bullish rally toward $0.020 – $0.024 in the short term.
Best approach: Wait for breakout confirmation (strong bullish candle + volume) before entering. Always manage risk and trade wisely.

3539, continue to increase in price⭐️GOLDEN INFORMATION:
Gold (XAU/USD) extends its rally for a sixth straight session, hitting a new record high in Asia on Tuesday as expectations of a Fed rate cut, tariff uncertainty, and geopolitical tensions fuel safe-haven demand. However, the metal struggles to hold above the $3,500 mark amid a firmer Dollar and overbought conditions, with traders eyeing key U.S. data this week, including Friday’s Nonfarm Payrolls.
⭐️Personal comments NOVA:
Gold price breaks old peak, market is fomo into next big price increase. Waiting for next ATH: 3539
⭐️SET UP GOLD PRICE:
🔥SELL GOLD zone: 3539- 3541 SL 3546
TP1: $3530
TP2: $3520
TP3: $3510
🔥BUY GOLD zone: $3470-$3468 SL $3463
TP1: $3480
TP2: $3490
TP3: $3500
⭐️Technical analysis:
Based on technical indicators EMA 34, EMA89 and support resistance areas to set up a reasonable BUY order.
⭐️NOTE:
Note: Nova wishes traders to manage their capital well
- take the number of lots that match your capital
- Takeprofit equal to 4-6% of capital account
- Stoplose equal to 2-3% of capital account

Accumulate for uptrend ! ETH September 01💎 ETH WEEKLY PLAN UPDATE (09/01 )
Medium-term ETH Plan & Trend Outlook
ETH has completed the test of the resistance zone at 4,800 (4k8 resistance DONE) and is currently in a corrective move.
The price is still holding above the 4,200 – 4,215 support zone, which coincides with EMA89, showing that this is an important medium-term demand area.
As long as ETH stays above 4,200, the main trend remains bullish, with the next target aiming toward 6,000 (Fib 2.618 resistance + strong supply zone).
Key Support Zones:
• 4,200 – 4,215 → short-term demand, main support pillar.
• 3,600 – 3,620 → medium-term support (EMA200 + previous breakout).
• 3,200 – 3,216 → deeper support if 4,200 breaks.
• 2,500 – 2,520 → long-term support, major base zone.
Key Resistance Zones:
• 4,800 – 4,825 → short-term resistance, recently tested.
• 6,000 – 6,050 → medium-term bullish target, strong supply zone.
Trend Outlook:
ETH is currently undergoing a healthy correction after a 5-wave rally.
• The positive scenario: price holds above 4,200, then rebounds to retest 4,800, and if it breaks, the uptrend could extend to 6,000.
• The negative scenario: if 4,200 breaks, the market could retrace to deeper support levels at 3,600 or 3,200 before forming the next bullish wave.
