#BTC Time to Buy ?!I believe We could have another downside move , and then we can have a buy position on it as Scalp . for 6-15%
Added in watchlist .
Longterm

Is this time different — is Ubisoft really dead?Ubisoft, the biggest French studio, has now fully retraced its bubble and returned to the mean. It’s currently valued at less than $1B, even though it generates between $1-3B a year, which seems undervalued. Of course, they’re not profitable every year; it’s unstable, and that’s an issue for rational investors.
But they’re not that far from being profitable again, they just need to cut some bs positions, bring back some strong IPs, and they’ll be back on track. I trust the process. Don’t you?


ETH/USDT 1W Chart📊 Market Structure:
Main Trend: Still up (higher lows and highs pattern persists).
Current Phase: Correction in an uptrend.
Local Trend: Down for several weeks (series of red weekly candles).
⚙️ Key Support and Resistance Levels:
Resistance (green lines):
4,753 USDT – recent local high, very strong resistance.
4,373 USDT – previous consolidation level, currently a supply zone.
3,979 USDT – current key local resistance, which previously served as support.
Support (red lines):
3,600 USDT – currently tested support level (coincides with the uptrend line).
3,165 USDT – next strong support level (previous local lows).
2,740 USDT – strong long-term support, potential target for further correction.
📈 Trendline:
The black uptrend line connects successive higher lows since April 2024.
The current weekly candlestick is testing this line (confluence with support at 3,600 USDT).
Maintaining this line = still a bullish medium-term scenario.
A breakout and weekly close below ~3,580–3,600 USDT → a signal of a possible trend reversal.
📉 Volume:
Downward volume is increasing, indicating supply pressure.
A lack of strong demand candlesticks = buyers are cautious in this zone.
🔄 Stoch RSI Oscillator (bottom of the chart):
Located in the oversold zone (below 20).
The %K (blue) and %D (orange) lines are starting to converge → a possible rebound signal in the coming weeks if a crossover occurs upwards.
🧭 Scenarios:
🟢 Bullish
Holding support at 3,600 USDT + trendline.
Confirmation with a bullish candle with higher volume.
Target: Return to 3,980 → 4,370 USDT.
🔴 Bearish:
Closing the week below 3,580 USDT (trendline + support).
Potential decline to 3,165 USDT, and even 2,740 USDT beyond.
RSI and volume suggest that downward pressure remains significant.
📌 Summary:
Key level: 3,600 USDT → decisive point for the market's further direction.
Short-term: Still downward pressure, but a technical rebound is possible (Stoch RSI).
Medium-term: The uptrend has not reversed until ETH closes below the trend line and 3,550 USDT.

BTC returns to support zone, bullish reactionBTC/USD Analysis (4H timeframe)
Bitcoin continues to trade within a descending wedge structure, suggesting a potential accumulation phase before a possible bullish breakout. The market is currently reacting near the lower boundary of the pattern, showing signs of support around the 106,300–107,000 zone.
1. Market Structure
Price remains trapped between the wedge’s lower trendline support and the descending upper resistance. Each rejection from the upper boundary has been met with strong buying interest at the lower support, indicating that buyers are still defending this level.
The overall structure shows higher lows forming within the wedge, which could be a bullish signal if confirmed by a strong rebound.
2. Key Support and Resistance Levels
Immediate support: 106,300–107,000
Secondary support: 103,400 (major liquidity zone and previous swing low)
First resistance: 113,800–114,000 (near descending trendline and EMA confluence)
Second resistance: 116,300–116,500 (major breakout zone)
3. EMA Confluence
The 34, 89, and 200 EMAs are currently stacked above price, acting as dynamic resistance. A clean breakout and candle close above these EMAs would confirm a shift in momentum and likely trigger a move toward the 113,800–116,300 targets.
4. Possible Scenarios
Bullish Scenario:
If BTC holds above 106,300 and rebounds with strong bullish candles, price could retest 113,800, followed by 116,300. A breakout above 116,300 would confirm a bullish reversal and open room toward 120,000+.
Bearish Scenario:
A clear breakdown below 106,300 could lead to a deeper retracement toward 103,400 before a possible rebound.

HDFCAMC CAPABLE OF 700% RETURNAs per my Elliot Wave Analysis HDFCAMC is making a interesting pattern and have just completed wave ((II)) Black cycle and is in now ((III)) black. Just completed another lower degree cycle wave ((2)) blue and started wave ((3)) blue which means it has a long way to go.
If one wish to make a long term investment In my view this stock can give a very good opportunity for investment for time horizon of 4-5 years.
Lets have this on record to see how it works out in future

ETH/USDT 1W🔹 Overall Trend
We are still in an uptrend (trend line maintained from the March low).
However, momentum is weakening—a series of lower highs is forming, suggesting a local correction within the main trend.
🔹 Key Technical Levels
🟢 Resistance:
4,179 USDT – the current level that the price is testing as resistance.
4,407 USDT – the next strong resistance, where previous rejections occurred.
4,877 USDT – the main resistance resulting from the August highs.
🔴 Support:
3,916 USDT – almost identical to the above (demand zone).
3,561 USDT – key structural support; loss of this level = possible trend change.
🔹 Formation and Structure
The current pattern could form a potential ascending triangle, with the trendline (black) connecting the lows and the horizontal resistance lines marking the upper boundary of the consolidation.
If a breakout occurs above 4,180–4,400, a move to 4,800+ is possible.
However, if we break the trendline and 3,900, a move to 3,560–3,400 could occur, or even a test of 3,000 with significant selling pressure.
🔹 Volume
Volume is decreasing during consolidation → typical of an accumulation or distribution phase.
No clear breakout signal – the market is waiting for a trigger (e.g., macroeconomic data, ETFs, news about ETH 2.0).
🔹 Stochastic RSI (Bottom of the chart)
Located in the oversold zone (<20).
The %K line (blue) is attempting to cross the %D line (orange) from below – a signal of an early rebound.
If confirmed next week, a local rebound from the 3,900–4,000 zone could occur.
🔹 Scenarios:
✅ Bullish:
Breakout from the trendline + breakout above 4,180 → target 4,400, then 4,880.
Confirmation by increasing volume and the Stoch RSI emerging from oversold territory.
❌ Bearish:
Breakout of the trendline and 3,900 → target 3,560, then 3,200.
Increasing downward volume + no bullish reaction at the support levels.

Ethereum is deciding where it wants to live.This is not a trade idea, this is a long term concept, most of my portfolio is swing when bull market comes (monthly/yearly) not trade (daily/weekly).
This is a solid question that will have to be played out in the upcoming years, Ethereum keeps changing its monetary policy and right now has less supply increase than BTC (due to burning mechanisms), will that stay forever? What will happen in the future to the policy? What it will mean for price?
Right now we can clearly see this is a bull case for future months.

Why Most Traders Exit Too Early — Psychology of Taking Profits1. Introduction
Most traders obsess over finding the perfect entry.
But what really separates professionals from everyone else is how they exit.
Closing trades too early kills more profits than bad setups ever will.
The problem might be one's psychology.
2. The Two Fears That Control Exits
When managing profits, every trader battles two emotions:
Fear of Loss – “ What if the PRICE reverses?”
Fear of Regret – “What if it keeps running after I close?”
Both pull you in opposite directions. One makes you take profit too soon; the other makes you hold too long.
The balance between them defines your discipline.
3. Why Most Traders Close Too Early
After entering a good trade, emotions rise. As profit builds, so does anxiety.
Instead of trusting their plan, traders imagine losing what they’ve just gained, so they close the trade prematurely.
In doing so, they trade emotion, not logic.
It feels safe in the moment, but long term it destroys reward-to-risk consistency.
4. The Solution: Predefine the Exit
The only way to remove hesitation is to plan exits before entering.
Decide in advance:
– Target levels based on structure or risk-reward.
– Conditions that justify partial profits.
– Situations that allow for trailing stops.
When these decisions are made beforehand, emotions can’t interfere mid-trade.
You act according to a plan, not a feeling.
Visual idea: Screenshot-style mockup of trade plan with marked “Entry,” “Partial,” “Final Target.”
5. The Real Lesson
Profit-taking should be systematic, not emotional.
Your job isn’t to catch every little move, it’s to execute your plan without hesitation.

Gold price accumulation - sideways range⭐️GOLDEN INFORMATION:
Gold (XAU/USD) starts the week slightly lower but holds above Friday’s low during the Asian session. Easing US-China trade tensions lift risk appetite and weigh on the safe-haven metal, as reflected in stronger global equities. Still, dovish Fed expectations and a softer US Dollar help limit further losses.
⭐️Personal comments NOVA:
The US and ASEAN weekend tariff policy has a negative impact on gold prices, mainly accumulating buying power waiting for interest rate cuts.
⭐️SET UP GOLD PRICE:
🔥SELL GOLD zone: 4236 - 4238 SL 4243
TP1: $4220
TP2: $4200
TP3: $4185
🔥BUY GOLD zone: 3987 - 3985 SL 3980
TP1: $3998
TP2: $4010
TP3: $4030
⭐️Technical analysis:
Based on technical indicators EMA 34, EMA89 and support resistance areas to set up a reasonable SELL order.
⭐️NOTE:
Note: Nova wishes traders to manage their capital well
- take the number of lots that match your capital
- Takeprofit equal to 4-6% of capital account
- Stoplose equal to 2-3% of capital account

Q4 2025 | SOYBEANS to $964.1After the bullish move in Q2, the price has been consolidating.
I would like to see this move towards the sell side occur in the last quarter of this year.
The price is within a 6-month consolidation, so either side of the range can be taken.
The invalidation level is indicated on the chart.

BTC accumulates and starts to recoverBitcoin (BTC/USD) – Daily Analysis
BTC continues to trade within a broad ascending channel, currently rebounding strongly from the key demand zone around 106,000–108,000. This zone has acted as a major liquidity area where buyers have repeatedly stepped in to defend price.
After forming a double rejection at the lower channel boundary, BTC has reclaimed the EMA 34 and is now attempting to stabilize above 110,000, signaling early bullish recovery momentum.
If buyers can maintain price action above 110,000, the next resistance levels to watch are:
113,000–114,000: confluence of EMA 89 + prior structure resistance.
126,000–127,000: upper trendline of the ascending channel and potential medium-term target.
Technical Outlook:
Price respected long-term ascending channel support.
EMAs show potential for a bullish crossover if momentum continues.
Higher low formation supports a recovery scenario.
Bullish Scenario:
Holding above 110,000 would confirm strength, with possible continuation toward 113,000 → 126,000.
Bearish Scenario:
Failure to hold 108,000 could trigger a deeper retracement toward 106,000 or even 102,000 (next demand zone).

Your Gold is about to melt !Hey Traders!
Gold is showing similar pattern to its last bull market which lasted 10 years and followed by a bear market which lasted 3 years, well guess what ! We've just finished the 10 years for the current bull market and I think its the time to roach out xD
It might pump a little more but its definitely going down soon, after all any bull market doesn't last forever and 10 years is a lot of full market especially when we see a similar pattern in the chart History.
Stay safe and let me know what do you guys think about this ?

Bulls continue to pressure new ATH⭐️GOLDEN INFORMATION:
Gold (XAU/USD) retreats slightly from record highs in Tuesday’s Asian session, though a deeper pullback remains limited by a supportive fundamental outlook. The US Dollar’s three-day rebound weighs on the metal, while upbeat equity sentiment further restricts its safe-haven appeal.
⭐️Personal comments NOVA:
forming a bullish DOW structure on the H1 frame, gold price returns to the old ATH 4380
⭐️SET UP GOLD PRICE:
🔥SELL GOLD zone: 4450 - 4452 SL 4457
TP1: $4430
TP2: $4410
TP3: $4390
🔥BUY GOLD zone: $4279-$4277 SL $4272
TP1: $4290
TP2: $4315
TP3: $4330
⭐️Technical analysis:
Based on technical indicators EMA 34, EMA89 and support resistance areas to set up a reasonable BUY order.
⭐️NOTE:
Note: Nova wishes traders to manage their capital well
- take the number of lots that match your capital
- Takeprofit equal to 4-6% of capital account
- Stoplose equal to 2-3% of capital account

AUD/USD Longer term OutlookHey Guys,
This is a follow up the the Short Term outlook I posted to show you the bigger picture of what happening. If you haven't checked out that short term thesis I suggest you do to understand why i think in the near term why there will be a decline possibly down to .50.
As I'm sure most people are aware there is abit of fear on the longer term of the debasement of the USD, as we have massive debts and deficits which are highly unlikely to get any better soon. This is ultimately lead to its decline relative to other assets think current rise in GOLD. If we have a recession from slower growth from tariffs, regional banks and private credit going bad and the consumer becoming too squeezed then this budget with get much worse as they will try and stimulate the economy to ease some of these pressure. But as a consequence this will lead to inflation and more debasement just like the 60s - 80s period. Each time they try and rein in inflation growth will slow so they will simulate resulting in the cycle continuing.
Now if the "debasement" continues this doesn't mean the USD will die get replace but it does mean other assets and currencies that aren't having this systemic problem will rise relative to the dollar again just like the 1960s-1980s. Australia has had long running fiscal conservative budgets and most definitely no debasing its currency. Our debt to Nominal GDP peak during covid and unlike most other economies has decreased since. Although we are projected to runn a deficit of A$10 billion our growth will more then out weigh this and this is such a small fraction to out A$1.752 trillion economy is a non factor really.
looking at some technicals on the charts we can see we have been in a falling wedge since the last "debasement" of the USD happened after the GFC. This will breakout sometime over the next two years as its running out of room. we have gaining strength on the RSI creating a divergence on the monthly also point to a breakout to the upside. we have clear outlined targets to hit on the way up and looking back again at previous debasement events by 2011 we were at $1.10 and by the 1975 we were at $1.49 so a return to these levels isn't without precedence.
I have shown with the green line the general direction of where i think it will be please dont take that as an exact model. This will take years to fully play out but if you understand even the most basic supply and demand , technical analyst and fundamental problem America is facing then it should keep you true.
Please check out the shorter outlook to gain a full picture and do you own research
here are some links to data used
www.ceicdata.com
data.worldbank.org

When will gold continue to rise? 4300?⭐️GOLDEN INFORMATION:
Gold (XAU/USD) advances toward $4,210 during Thursday’s Asian session, hovering near a fresh record high as Fed rate-cut expectations and renewed trade tensions lift safe-haven demand. Traders now await comments from Fed officials, including Michael Barr, Stephen Miran, Christopher Waller, and Michelle Bowman, for policy cues. Earlier this week, Fed Chair Jerome Powell warned that slowing job growth poses a risk to the US economy, reinforcing prospects for two more rate cuts this year—supportive of the non-yielding yellow metal.
⭐️Personal comments NOVA:
The buying power shows no signs of stopping, breaking 4217 and continuing to increase in price. The whole market is very excited and focusing on investing in gold as the safest asset.
⭐️SET UP GOLD PRICE:
🔥SELL GOLD zone: 4275 - 4277 SL 4282
TP1: $4265
TP2: $4250
TP3: $4240
🔥BUY GOLD zone: $4154-$4152 SL $4147
TP1: $4165
TP2: $4180
TP3: $4190
⭐️Technical analysis:
Based on technical indicators EMA 34, EMA89 and support resistance areas to set up a reasonable BUY order.
⭐️NOTE:
Note: Nova wishes traders to manage their capital well
- take the number of lots that match your capital
- Takeprofit equal to 4-6% of capital account
- Stoplose equal to 2-3% of capital account

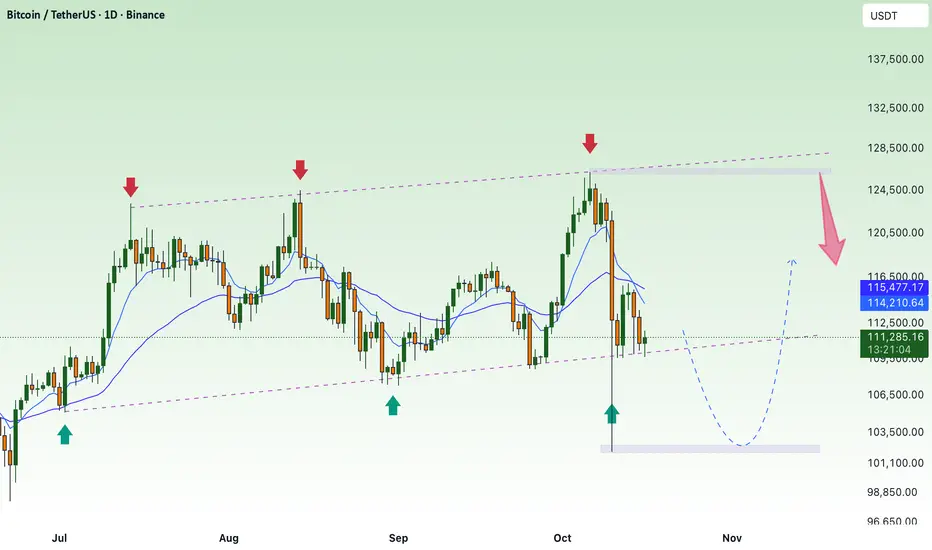
BTC mainly accumulates, remaining force decreasesBTC Technical Analysis (1D Chart)
Bitcoin continues to move inside a rising channel, where the upper trendline has repeatedly acted as strong resistance (around $125,000–126,000), and the lower boundary has held as key support near $108,000.
After the recent rejection at the upper boundary, price has pulled back sharply and is now approaching the support zone at $108,000–108,500, which aligns with:
The bottom trendline of the ascending channel
The 200-day EMA (white line)
A previous reaction zone marked by strong bullish reversals in the past
If the support holds, BTC may see a technical rebound toward the EMA89–EMA34 zone around $114,000–115,000, or even back to the channel resistance near $125,000.
However, if price breaks below $108,000, it would confirm a bearish breakout from the channel, potentially opening the way toward $100,000–102,000.
Key Levels to Watch
Resistance: $114,000 – $115,800 / $125,000 – $126,000
Support: $108,000 – $108,500 (critical zone)
Trend: Neutral to bullish inside channel; bearish breakdown if $108K fails
Gold price continues to break above 4200⭐️GOLDEN INFORMATION:
Gold (XAU/USD) surges to a new all-time high in Wednesday’s Asian session, with bulls eyeing the $4,200 mark amid mounting global uncertainty. Renewed US-China trade tensions, the prolonged US government shutdown, and ongoing geopolitical risks continue to drive safe-haven demand. Meanwhile, dovish Federal Reserve expectations and a softer US Dollar further support the metal’s strong uptrend, with buyers largely unfazed by overbought conditions.
⭐️Personal comments NOVA:
Gold price continues to break out near 4200, strong buying power continues to increase price, US government is still closed, gold price continues to increase
⭐️SET UP GOLD PRICE:
🔥SELL GOLD zone: 4235 - 4237 SL 4242
TP1: $4220
TP2: $4210
TP3: $4200
🔥BUY GOLD zone: $4093-$4091 SL $4086
TP1: $4105
TP2: $4120
TP3: $4130
⭐️Technical analysis:
Based on technical indicators EMA 34, EMA89 and support resistance areas to set up a reasonable BUY order.
⭐️NOTE:
Note: Nova wishes traders to manage their capital well
- take the number of lots that match your capital
- Takeprofit equal to 4-6% of capital account
- Stoplose equal to 2-3% of capital account

The bulls are too dominant, prices continue to increase⭐️GOLDEN INFORMATION:
Gold (XAU/USD) extends its record-breaking rally above $4,100 in Tuesday’s Asian session, fueled by safe-haven demand amid the ongoing US government shutdown and renewed US-China trade tensions. Geopolitical risks and rising expectations of further Federal Reserve rate cuts also continue to underpin the non-yielding metal.
⭐️Personal comments NOVA:
Selling pressure is almost absent in the market, buying pressure continues to push gold prices up. Continue waiting for a new ATH today.
⭐️SET UP GOLD PRICE:
🔥SELL GOLD zone: 4212 - 4214 SL 4219
TP1: $4200
TP2: $4185
TP3: $4162
🔥BUY GOLD zone: $4058-$4056 SL $4051
TP1: $4070
TP2: $4090
TP3: $4105
⭐️Technical analysis:
Based on technical indicators EMA 34, EMA89 and support resistance areas to set up a reasonable BUY order.
⭐️NOTE:
Note: Nova wishes traders to manage their capital well
- take the number of lots that match your capital
- Takeprofit equal to 4-6% of capital account
- Stoplose equal to 2-3% of capital account

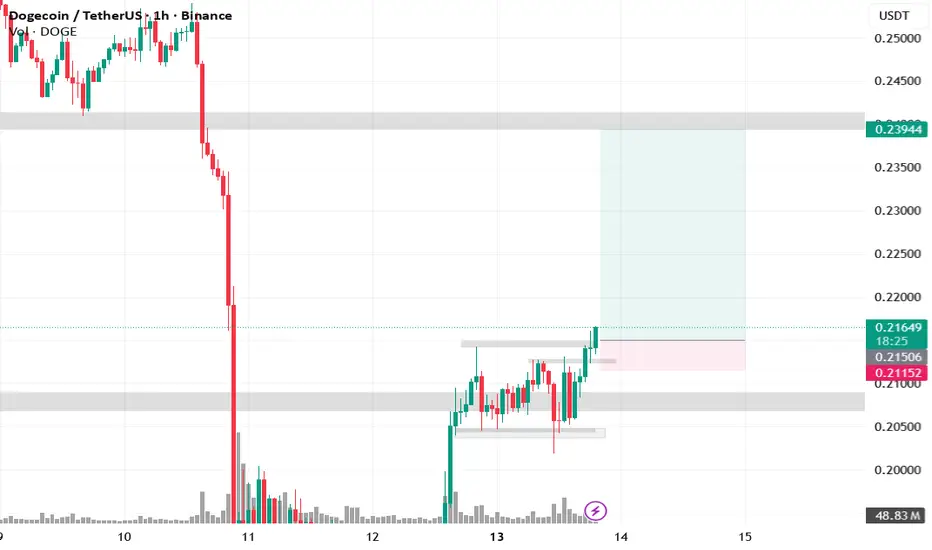
Taking a trade on DOGE/USDT’m a new trader and just started sharing my experience here. This is not financial advice, so take your own risk
find new ATH 4074 , price increase⭐️GOLDEN INFORMATION:
Gold (XAU/USD) extends gains for a second day, reaching a new record high near $4,060 in Monday’s Asian session. Persistent economic uncertainty from the prolonged US government shutdown, renewed US-China trade tensions, and growing expectations of further Federal Reserve rate cuts continue to support the safe-haven metal. Markets now anticipate two additional rate cuts this year, pressuring the US Dollar and bolstering Gold. However, President Trump’s softer tone on China tariffs has improved overall risk sentiment, capping the metal’s upside for now.
⭐️Personal comments NOVA:
Tariffs, adding momentum for gold prices to continue growing, creating new ATH this week
⭐️SET UP GOLD PRICE:
🔥SELL GOLD zone: 4074 - 4076 SL 4081
TP1: $4060
TP2: $4050
TP3: $4040
🔥BUY GOLD zone: $4000-$4002 SL $3995
TP1: $4010
TP2: $4020
TP3: $4030
⭐️Technical analysis:
Based on technical indicators EMA 34, EMA89 and support resistance areas to set up a reasonable BUY order.
⭐️NOTE:
Note: Nova wishes traders to manage their capital well
- take the number of lots that match your capital
- Takeprofit equal to 4-6% of capital account
- Stoplose equal to 2-3% of capital account
Silver Long-Term Outlook: Wyckoff, Fibonacci & Volunacci in PlayOn the monthly chart, Silver is showing a strong setup for long-term investors. We can clearly identify two adjacent Wyckoff accumulation patterns, signaling institutional accumulation phases.
Price action is following an ascending Fibonacci channel, reflecting a steady bullish structure. After breaking out of the second Wyckoff pattern, a Volunacci projection has formed—pointing toward a potential move to retest its historical high near $48.
This alignment of classic technical patterns with volume-based projection tools strengthens the long-term bullish case for Silver.

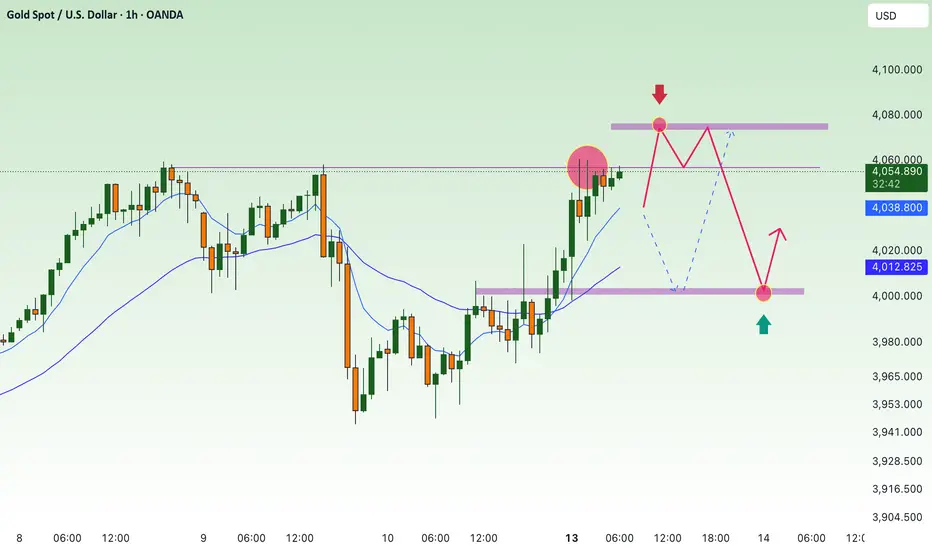
Tariff tensions - the driving force behind gold price increases✍️ NOVA hello everyone, Let's comment on gold price next week from 10/13/2025 - 10/17/2025
⭐️GOLDEN INFORMATION:
Gold (XAU/USD) climbs during the North American session on Friday, trading near $3,997, up 0.6%, as renewed US-China trade tensions, the ongoing US government shutdown, and expectations of further Fed easing fuel safe-haven demand. Risk sentiment deteriorated after President Donald Trump warned of new tariffs on China, which threatened countermeasures on rare earth exports, while Trump dismissed the need to meet President Xi Jinping later this month.
⭐️Personal comments NOVA:
Tariff tensions return, US government remains shut. Gold price maintains bullish momentum above 4000
🔥 Technically:
Based on the resistance and support areas of the gold price according to the H4 frame, NOVA identifies the important key areas as follows:
Resistance: $4058, $4100
Support: $3980, $3942, $3895
🔥 NOTE:
Note: Nova wishes traders to manage their capital well
- take the number of lots that match your capital
- Takeprofit equal to 4-6% of capital account
- Stoplose equal to 2-3% of capital account
- The winner is the one who sticks with the market the longest
