GOLD/USD LONG-TERM,HUSHING ALL THE NOISE,what do the charts say?Now, obviously, gold as every other asset is affected by the all the kind of news that the media discloses. But looking in the 3-5 year span, it's impossible to predict what sort of news will be around, so we'll just assume for now, that it would be a zero-sum game(no gain or loss from news).
However, I'll just mention the current strong trends happening with regards to trade, interest rate and inflation(the biggest factors affecting the XAUUSD).
-Under Trump, we've seen 3 things so far, and there's more than enough indicators pointing that to that these trends will continue:
1. Higher and Higher interest rates
2. Decreasing unemployment/Increasing inflation(these are highly correlated)
3. Tough stance of trade, recent tariffs(which I think he's using in order to raise money, that is missing from the last tax cuts). Lower trade, that usually equals to lower economic growth, since it's a fundamental idea in economics that no one benefits from trade wars for obvious reasons.
All of these factors are pointing to, somewhat of an highly heated up economy that is about to cool down. In any case most of the major economies, are way way overdue for a recession, in which gold value will undoubtedly benefit from.
Note: This is just a preliminary draft of this idea, for now I am waiting for the outcome of the ascending triangle(noted on the chart), but I will continuously update this idea in due time.
Disclaimer:
//This is not a buy or sell sign, you decide what to do with your own money!!//
If you liked my take on gold, and/or other market, comment your thoughts, agree or follow for more interesting ideas, as always, much appreciated, cheers !
Longterminvesting

ICON seems to have build a bottom @0.00025 Thnxforthe tip aidanbI invest in Crypto currencies and I trade CFD's. When you want to invest in crypto, I advise you to buy 'real coins' because on long term that will give you far more profit than speculate the chart with CFD's. I have bought Bitcoin, Bitcoin Cash, Ethereum, XRP-Ripple, ReddCoin, FeatherCoin, Adcoin ( ACC ), Bunny Token and looking for others every day! Bunny Token gave me good profit so far! I bought these in Pre-sale. I expect this is going to become huge!
Interesting coins, which I am looking to buy:
- EOS
- QASH
- Bitcoin-Gold
Do you have some good tips for crypto coins? let me know!
-------------------------------------------------------------------------------------------------------------------------------------------
My strategy
My main strategy is called 'cycle-trading'. After years of learning and practicing after I bought a teaching-package from a visionair, I found a way of how to trade successful with CFD's on the stock-market. Every stock is following an certain cycle which repeats itself. So, movements are often appearing in the same percentage, aswel long as short. This cycles appear at all levels; when you analyse the chart at 1 month, 1 week, 1 day, 1 hour. (others I don't use). This is the case, because all in life is build by the fibonacci sequence. When you analyse the chart, you'll also see the stock market is behaving itself as the fibonacci sequence.
How do I decide to open a position or not? First I analyse:
- Sentiment on the market
- Own created indicators
- Moving-averages and Bollinger-Bands
Trading means investing. Sometimes you lose more than you win in the beginning of a period!
Don't forget to follow me, so you get updated when I post new analysis. Also read my account to be informed about what I do.
Thank you for following and Succes with trading !
Richard from Rich.Exclusive.Trading

BTC - Digital Gold - Don't panic - PATIENCE IS THE KEY. Hi Guys.
We know you are stressed and anxious.
Don’t be. The most important is to not PANIC.
Recent price fall may be linked with the last hack ($40 million in tokens) of the Korean Exchange Coinrail.
This is one of the smallest exchanges. They are ranked on 90th place based on trading volume.
Most notably, the hackers got away with $19.5 million-worth of NPXS tokens that were issued by payment project Pundi X’s ICO. Added to that they scored a further $13.8 million from Aston X, an ICO project building a platform to decentralize documents, $5.8 million in tokens for Dent, a mobile data ICO, and over $1.1 million Tron, a much-hyped project originating from China.
The whole amount is nothing (0,013%) according to the whole market cap ($300 billion).
This was unpredictable although we may expect another hacks and rapid price falls in the future.
Keep a bit of fiat currency or USDT for such sales. :)
Please remember why BTC is and will be the king of all crypto. This is digital gold.
1. Gold does not oxidize thus it maintains its value. Bitcoin doesn't deteriorate either. They both don't lose their value because of their (physical) state.
2. Both gold and BTC are widely used. Gold - reserves and jewellery. BTC - reserves (long-term capital investment); to buy 95% of other crypto you need to buy BTC first. There is a constant demand on both.
3. Their amount is small and strictly limited.
Please look at the long-term chart. This is log scale.
We have a very strong support at $6100 level.
We identified triangle shape. We should bounce up from this triangle breaking resistance at $7300 - $9000 level. Please look at the green rectangle. This is boy zone.
According to the Trend-Based Fibonacci Extension we are very low. Nearly at the bottom. They only major move is UP.
BE PATIENT. PATIENCE IS THE KEY.
Keep watching us for updates.
If you like what we are doing do not forget to like it.
Your comments are highly appreciated.
HUGE HUGS.
Your WBM Team!

Potential Buy Opportunity on EURCAD & GBPCADwatch the video with full attention and follow the rules. This video can be a very educative as well, because I showed how to take an action on trading by confluenceing several reasons.

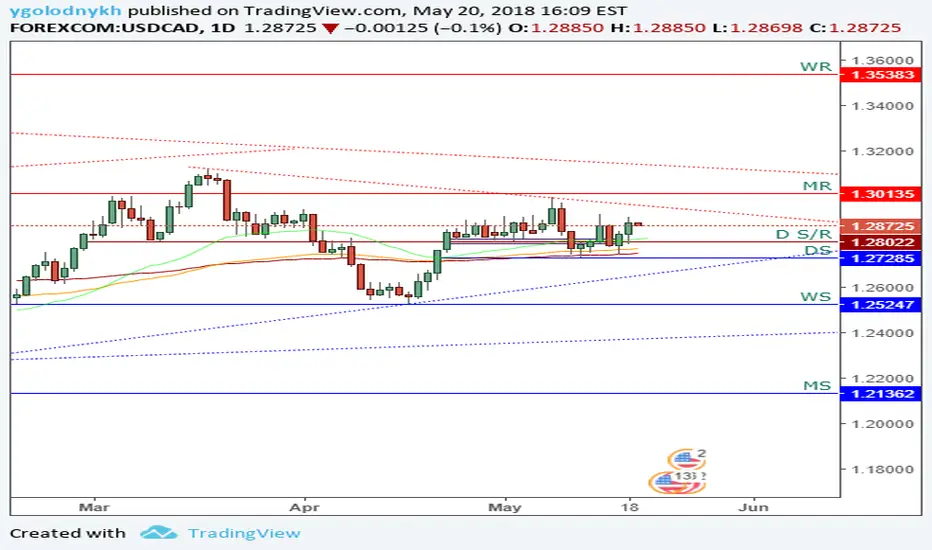
USDCAD - Daily Chart AnalysisPrice Action: Neutral
Pattern: Asymmetrical triangle
Long-Term Momentum: Bullish
Short-Term Momentum: Bearish
Bias: Neutral
Action: Wait until price breaks trend resistance or trend support to indicate further price momentum.
Comments: Do not trade this pair until further confirmation of price action
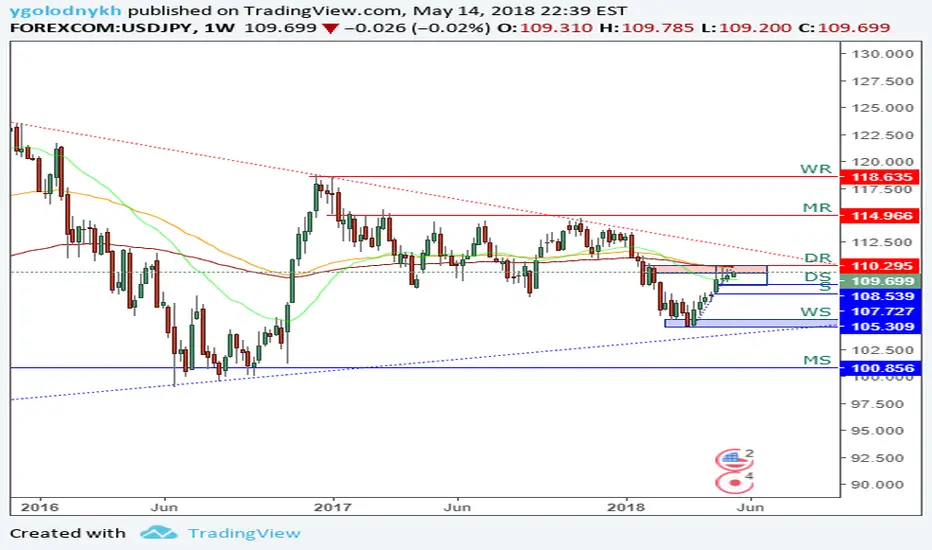
USDJPY - Weekly AnalysisPrice has been moving in a parabolic manner since March. There was a few times in recent structure that price formed a doji star and it seemed like price would reverse but it didn't. Similar to the monthly chart, price is nearing a major resistance zone + trend resistance. If bullish momentum continues to show from the dollar price will continue to trend nicely. There is a chance that price can consolidate in this region for some time.
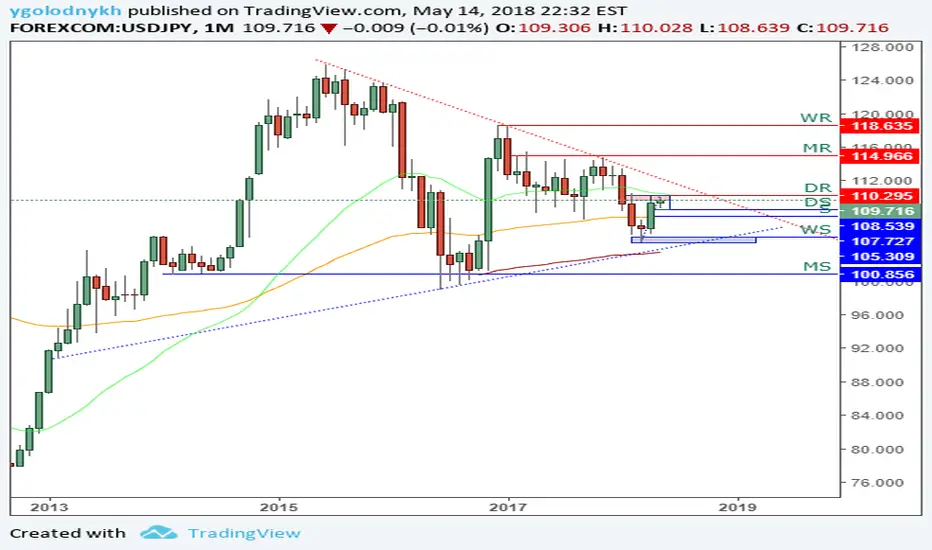
USDJPY - Monthly Chart AnalysisPrice created a LH in the structure at the beginning of March and has been moving nicely to the upside. There is some major rejection happening at the 110.3 level. If price is able to get above and hold daily resistance, 29 EMA, and trend resistance there could be a runup to 115. Everything depends on what will happen with the U.S. dollar of the next several weeks.
Orange SA France(Telecom) - Undervalued.This year in the report , the heads stated that they will increase the dividends by 0.05 euro cents. Meaning - earnings are better. As earnings are rising, dividends risen also, the stock moved higher, the questions is for how long. As it was floating in a highest range for quiet some time, I assume there will be the market correction to the bigger channels bottom.
As this company is owned also by a government of France, we do not expect it to skyrocket, but we assume it to be confident and steady for a good yearly %.
Analysed PE, BV and financial reports. We have a an undervalued company.
Briefly.
256 million customers worldwide.
0.65 Euros dividend per share.
15% of stocks - Government of France
85% of stocks - public float.
BUYING PRICES AND INVESTMENTS SPREADS: 12 - 10% of capital
10 - 10% of capital
9 - 15% of capital
8 - 20% of capital
SELLING PRICES - 16
17

PLATINUM Possible Heavy Pressure in the coming weeks and monthsWill be definitely keeping an eye on this one.
Never trade with money you can't afford to lose.

QASH in good direction When it break 0,9000 it gets interesting!I invest in Crypto currencies and I trade CFD's. When you want to invest in crypto, I advise you to buy 'real coins' because on long term that will give you far more profit than speculate the chart with CFD's. I have bought Bitcoin, Bitcoin Cash, Ethereum, XRP-Ripple, ReddCoin, FeatherCoin, Adcoin (ACC), Bunny Token and looking for others every day! Bunny Token gave me good profit so far! I bought these in Pre-sale. I expect this is going to become huge!
Do you have some good tips for crypto coins? let me know!
-------------------------------------------------------------------------------------------------------------------------------------------
My strategy
My main strategy is called 'cycle-trading'. After years of learning and practicing after I bought a teaching-package from a visionair, I found a way of how to trade successful with CFD's on the stock-market. Every stock is following an certain cycle which repeats itself. So, movements are often appearing in the same percentage, aswel long as short. This cycles appear at all levels; when you analyse the chart at 1 month, 1 week, 1 day, 1 hour. (others I don't use). This is the case, because all in life is build by the fibonacci sequence. When you analyse the chart, you'll also see the stock market is behaving itself as the fibonacci sequence.
How do I decide to open a position or not? First I analyse:
- Sentiment on the market
- Own created indicators
- Moving-averages and Bollinger-Bands
Trading means investing. Sometimes you lose more than you win in the beginning of a period!
Don't forget to follow me, so you get updated when I post new analysis. Also read my account and the 'status updates' to be informed.
Thank you for following and Succes with trading !
Richard from Rich.Exclusive.Trading

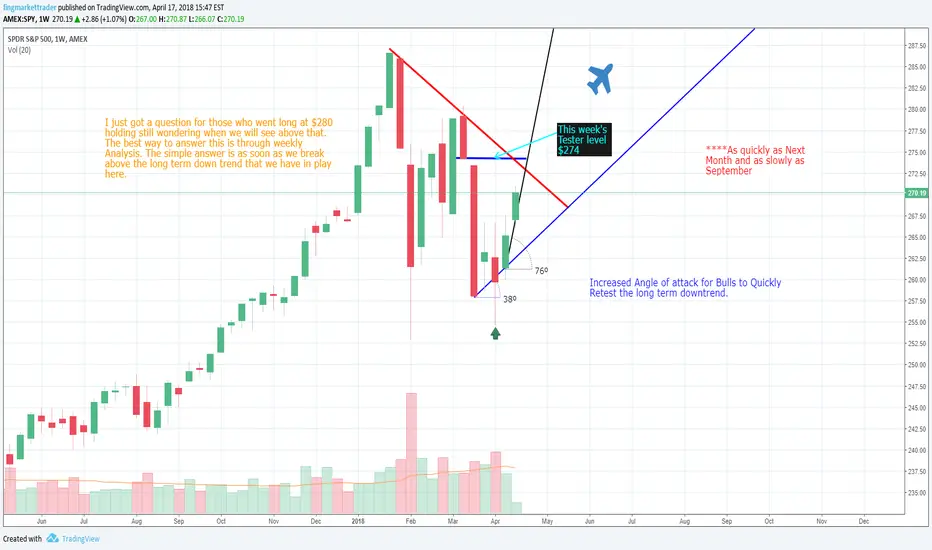
SPY Chart 2018 Weekly Outlook I put this chart together to help our Longer term investors who are wondering when the heck we are going to get back to All time highs. the Path of Least resistance would be to recapture ATH's between Mid May-September.
Bearish, but taking a small long positionI am generally short term bearish on COINBASE:BTCUSD but consider the coming days a great opportunity for dollar cost averaging if you believe the overall trend long term is growth in the coin.
I do recall last year being absolutely blown away by the $6000 price tag of COINBASE:BTCUSD but at this point it seems like an absolute steal. It's like buying NASDAQ:AMZN when it was $100.
I'll be taking another position around the 7900 and 7500 price points and then waiting a few days for the market to shake out. I'm still anticipating a short term bearish move so better prices could rear their heads, but I liken betting on BTC similar to betting on the S&P - in the long run it always recovers even if sometimes it takes years.
If your goal is Account Building, Swing Trading and Day Trading then stay out, I'm sure there are better opportunities in other coins or just waiting for this to drop more.

Thanks to 'qdoc' for the tip! QASH huge long potential 1,20 ! I invest in Crypto currencies and I trade CFD's. When you want to invest in crypto, I advise you to buy 'real coins' because on long term that will give you far more profit than speculate the chart with CFD's. I have bought XRP-Ripple, Bitcoin, Bitcoin Cash, Ethereum, ReddCoin, FeatherCoin, Adcoin ( ACC ), Bunny Token and looking for others every day!
-------------------------------------------------------------------------------------------------------------------------------------------
What about my ' Cycle phenomenon' ? read here:
My main strategy is called 'cycle-trading'. After years of learning and practicing after I bought a teaching-package from a visionair, I found a way of how to trade successful with CFD's on the stock-market. Every stock is following an certain cycle which repeats itself. So, movements are often appearing in the same percentage, aswel long as short. This cycles appear at all levels; when you analyse the chart at 1 month, 1 week, 1 day, 1 hour. (others I don't use). This is the case, because all in life is build by the fibonacci sequence. When you analyse the chart, you'll also see the stock market is behaving itself as the fibonacci sequence. But, still the most difficult part and what it's all about, is where does a long or a short start? and which point is telling you that the cycle is started, so that you know it will probably go to the next fibonacci resistance? .... therefore I have developed some own indicators!
The exact positions of where to open, to close and the stop loss position and take profit position is very important to be successful with trading!
My strategy is to never trade on volatile markets. You will lose your money when you do! Trade on technical-chart analysis! not on news and volatility!
One of my other strategies is that trades are only interesting and ‘safe’ to open when: you can possibly lose 1/3rd of the possible profit. So; when you set the indicators after analysing resistances, and you can lose 100 but win 300, it is worth the try!
How do I decide to open a position or not? First I analyse:
- sentiment on the market > are people in buy mode or short mode
- I have some own created indicators, some I show in my charts. Therefor I use the fibonacci sequence. My indicators tell to open a position or not and in combination with other own created indicators I decide where to place the stop loss and take profit positions.
- and this own indicators tell me when probably a new long position starts or a new short > these are the positions where I place my orders! or open directly.
- and again other own created indicators tell me how far long or short it probably goes. The take profit and stop loss positions are other positions than the resistances in the market!
- the moving-averages and bollinger-bands are very important indicators also. They are helping a lot! by making decisions.
And that is Why I win more than I lose in the end. Patience is everything, we’ll wait for the right moment! But don't forget; trading means investing. Sometimes you lose more than you win in the beginning of a period!
Most of the times the sentiment changes on Monday! please consider that when you start a position on Monday. Tuesday, Wednesday and Thursday are on steady markets normally calm trading days. Than, my strategies work at their best!
Don't forget to follow me, so you get updated when I post new analysis. Also read my account and the 'status updates' to be informed.
Thank you for following and Succes with trading !
Richard from Rich.Exclusive.Trading

NaturalGas opportunity short target 2,688 and 2,667 FibonacciI invest in Crypto currencies and I trade CFD's. When you want to invest in crypto, I advise you to buy 'real coins' because on long term that will give you far more profit than speculate the chart with CFD's. I have bought XRP-Ripple, Bitcoin, Bitcoin Cash, Ethereum, ReddCoin, FeatherCoin, Adcoin ( ACC ), Bunny Token and looking for others every day!
-------------------------------------------------------------------------------------------------------------------------------------------
What about my ' Cycle phenomenon' ? read here:
My main strategy is called 'cycle-trading'. After years of learning and practicing after I bought a teaching-package from a visionair, I found a way of how to trade successful with CFD's on the stock-market. Every stock is following an certain cycle which repeats itself. So, movements are often appearing in the same percentage, aswel long as short. This cycles appear at all levels; when you analyse the chart at 1 month, 1 week, 1 day, 1 hour. (others I don't use). This is the case, because all in life is build by the fibonacci sequence. When you analyse the chart, you'll also see the stock market is behaving itself as the fibonacci sequence. But, still the most difficult part and what it's all about, is where does a long or a short start? and which point is telling you that the cycle is started, so that you know it will probably go to the next fibonacci resistance? .... therefore I have developed some own indicators!
The exact positions of where to open, to close and the stop loss position and take profit position is very important to be successful with trading!
My strategy is to never trade on volatile markets. You will lose your money when you do! Trade on technical-chart analysis! not on news and volatility!
One of my other strategies is that trades are only interesting and ‘safe’ to open when: you can possibly lose 1/3rd of the possible profit. So; when you set the indicators after analysing resistances, and you can lose 100 but win 300, it is worth the try!
How do I decide to open a position or not? First I analyse:
- sentiment on the market > are people in buy mode or short mode
- I have some own created indicators, some I show in my charts. Therefor I use the fibonacci sequence. My indicators tell to open a position or not and in combination with other own created indicators I decide where to place the stop loss and take profit positions.
- and this own indicators tell me when probably a new long position starts or a new short > these are the positions where I place my orders! or open directly.
- and again other own created indicators tell me how far long or short it probably goes. The take profit and stop loss positions are other positions than the resistances in the market!
- the moving-averages and bollinger-bands are very important indicators also. They are helping a lot! by making decisions.
And that is Why I win more than I lose in the end. Patience is everything, we’ll wait for the right moment! But don't forget; trading means investing. Sometimes you lose more than you win in the beginning of a period!
Most of the times the sentiment changes on Monday! please consider that when you start a position on Monday. Tuesday, Wednesday and Thursday are on steady markets normally calm trading days. Than, my strategies work at their best!
Don't forget to follow me, so you get updated when I post new analysis. Also read my account and the 'status updates' to be informed.
Thank you for following and Succes with trading !
Richard from Rich.Exclusive.Trading

ReddCoin seems to hold resistance. When break 0.0052: LONG!I invest in Crypto currencies and I trade CFD's. When you want to invest in crypto, I advise you to buy 'real coins' because on long term that will give you far more profit than speculate the chart with CFD's. I have bought XRP-Ripple, Bitcoin, Bitcoin Cash, Ethereum, ReddCoin, FeatherCoin, Adcoin (ACC), Bunny Token and looking for NEO! But wait NEO to buy, because price seems to go to 30.00 first.
-------------------------------------------------------------------------------------------------------------------------------------------
What about my ' Cycle phenomenon' ? read here:
My main strategy is called 'cycle-trading'. After years of learning and practicing after I bought a teaching-package from a visionair, I found a way of how to trade successful with CFD's on the stock-market. Every stock is following an certain cycle which repeats itself. So, movements are often appearing in the same percentage, aswel long as short. This cycles appear at all levels; when you analyse the chart at 1 month, 1 week, 1 day, 1 hour. (others I don't use). This is the case, because all in life is build by the fibonacci sequence. When you analyse the chart, you'll also see the stock market is behaving itself as the fibonacci sequence. But, still the most difficult part and what it's all about, is where does a long or a short start? and which point is telling you that the cycle is started, so that you know it will probably go to the next fibonacci resistance? .... therefore I have developed some own indicators!
The exact positions of where to open, to close and the stop loss position and take profit position is very important to be successful with trading!
My strategy is to never trade on volatile markets. You will lose your money when you do! Trade on technical-chart analysis! not on news and volatility!
One of my other strategies is that trades are only interesting and ‘safe’ to open when: you can possibly lose 1/3rd of the possible profit. So; when you set the indicators after analysing resistances, and you can lose 100 but win 300, it is worth the try!
How do I decide to open a position or not? First I analyse:
- sentiment on the market > are people in buy mode or short mode
- I have some own created indicators, some I show in my charts. Therefor I use the fibonacci sequence. My indicators tell to open a position or not and in combination with other own created indicators I decide where to place the stop loss and take profit positions.
- and this own indicators tell me when probably a new long position starts or a new short > these are the positions where I place my orders! or open directly.
- and again other own created indicators tell me how far long or short it probably goes. The take profit and stop loss positions are other positions than the resistances in the market!
- the moving-averages and bollinger-bands are very important indicators also. They are helping a lot! by making decisions.
And that is Why I win more than I lose in the end. Patience is everything, we’ll wait for the right moment! But don't forget; trading means investing. Sometimes you lose more than you win in the beginning of a period!
Most of the times the sentiment changes on Monday! please consider that when you start a position on Monday. Tuesday, Wednesday and Thursday are on steady markets normally calm trading days. Than, my strategies work at their best!
Don't forget to follow me, so you get updated when I post new analysis. Also read my account and the 'status updates' to be informed.
Thank you for following and Succes with trading !
Richard from Rich.Exclusive.Trading

When Feathercoin breaks current bottom, short to 0,11300When Feathercoin breaks current bottom, short to 0,11300. At this moment at Fibonacci retracement 0.618%.
Crypto currencies I don't trade as CFD's. Too much risk, mainly because they expire very soon every time. When you want to invest in crypto, I advise you to buy 'real coins' and not to speculate the chart with CFD's. I have bought XRP-Ripple, Bitcoin, Bitcoin Cash, Ethereum, ReddCoin, FeatherCoin, Adcoin (ACC), Bunny Token and looking for NEO now! But wait NEO to buy, because price looks to go to 30.00 first.
-------------------------------------------------------------------------------------------------------------------------------------------
What about my ' Cycle phenomenon' ? read here:
My main strategy is called 'cycle-trading'. After years of learning and practicing after I bought a teaching-package from a visionair, I found a way of how to trade successful with CFD's on the stock-market. Every stock is following an certain cycle which repeats itself. So, movements are often appearing in the same percentage, aswel long as short. This cycles appear at all levels; when you analyse the chart at 1 month, 1 week, 1 day, 1 hour. (others I don't use). This is the case, because all in life is build by the fibonacci sequence. When you analyse the chart, you'll also see the stock market is behaving itself as the fibonacci sequence. But, still the most difficult part and what it's all about, is where does a long or a short start? and which point is telling you that the cycle is started, so that you know it will probably go to the next fibonacci resistance? .... therefore I have developed some own indicators!
The exact positions of where to open, to close and the stop loss position and take profit position is very important to be successful with trading!
My strategy is to never trade on volatile markets. You will lose your money when you do! Trade on technical-chart analysis! not on news and volatility!
One of my other strategies is that trades are only interesting and ‘safe’ to open when: you can possibly lose 1/3rd of the possible profit. So; when you set the indicators after analysing resistances, and you can lose 100 but win 300, it is worth the try!
How do I decide to open a position or not? First I analyse:
- sentiment on the market > are people in buy mode or short mode
- I have some own created indicators, some I show in my charts. Therefor I use the fibonacci sequence. My indicators tell to open a position or not and in combination with other own created indicators I decide where to place the stop loss and take profit positions.
- and this own indicators tell me when probably a new long position starts or a new short > these are the positions where I place my orders! or open directly.
- and again other own created indicators tell me how far long or short it probably goes. The take profit and stop loss positions are other positions than the resistances in the market!
- the moving-averages and bollinger-bands are very important indicators also. They are helping a lot! by making decisions.
And that is Why I win more than I lose in the end. Patience is everything, we’ll wait for the right moment! But don't forget; trading means investing. Sometimes you lose more than you win in the beginning of a period!
Most of the times the sentiment changes on Monday! please consider that when you start a position on Monday. Tuesday, Wednesday and Thursday are on steady markets normally calm trading days. Than, my strategies work at their best!
Don't forget to follow me, so you get updated when I post new analysis. Also read my account and the 'status updates' to be informed.
Thank you for following and Succes with trading !
Richard from Rich.Exclusive.Trading

NEO in repeating cycle. I'll expect to fall to 30.00! fib retracNEO broke fibonacci bottom, now RISK for short to $30 area!
Crypto currencies I don't trade as CFD's. Too much risk, mainly because they expire very soon every time. When you want to invest in crypto, I advise you to buy 'real coins' and not to speculate the chart with CFD's. I have bought XRP-Ripple, Bitcoin, Bitcoin Cash, Ethereum, ReddCoin, FeatherCoin, Adcoin (ACC), Bunny Token and looking for NEO now! But wait NEO to buy, because price looks to go to 30.00 first.
-------------------------------------------------------------------------------------------------------------------------------------------
What about my ' Cycle phenomenon' ? read here:
My main strategy is called 'cycle-trading'. After years of learning and practicing after I bought a teaching-package from a visionair, I found a way of how to trade successful with CFD's on the stock-market. Every stock is following an certain cycle which repeats itself. So, movements are often appearing in the same percentage, aswel long as short. This cycles appear at all levels; when you analyse the chart at 1 month, 1 week, 1 day, 1 hour. (others I don't use). This is the case, because all in life is build by the fibonacci sequence. When you analyse the chart, you'll also see the stock market is behaving itself as the fibonacci sequence. But, still the most difficult part and what it's all about, is where does a long or a short start? and which point is telling you that the cycle is started, so that you know it will probably go to the next fibonacci resistance? .... therefore I have developed some own indicators!
The exact positions of where to open, to close and the stop loss position and take profit position is very important to be successful with trading!
My strategy is to never trade on volatile markets. You will lose your money when you do! Trade on technical-chart analysis! not on news and volatility!
One of my other strategies is that trades are only interesting and ‘safe’ to open when: you can possibly lose 1/3rd of the possible profit. So; when you set the indicators after analysing resistances, and you can lose 100 but win 300, it is worth the try!
How do I decide to open a position or not? First I analyse:
- sentiment on the market > are people in buy mode or short mode
- I have some own created indicators, some I show in my charts. Therefor I use the fibonacci sequence. My indicators tell to open a position or not and in combination with other own created indicators I decide where to place the stop loss and take profit positions.
- and this own indicators tell me when probably a new long position starts or a new short > these are the positions where I place my orders! or open directly.
- and again other own created indicators tell me how far long or short it probably goes. The take profit and stop loss positions are other positions than the resistances in the market!
- the moving-averages and bollinger-bands are very important indicators also. They are helping a lot! by making decisions.
And that is Why I win more than I lose in the end. Patience is everything, we’ll wait for the right moment! But don't forget; trading means investing. Sometimes you lose more than you win in the beginning of a period!
Most of the times the sentiment changes on Monday! please consider that when you start a position on Monday. Tuesday, Wednesday and Thursday are on steady markets normally calm trading days. Than, my strategies work at their best!
Don't forget to follow me, so you get updated when I post new analysis. Also read my account and the 'status updates' to be informed.
Thank you for following and Succes with trading !
Richard from Rich.Exclusive.Trading

NEO at fibonacci bottom $56 now chance for long NEO at fibonacci bottom $56 now chance for long. RISK for short to $30 area!
Crypto currencies I don't trade as CFD's. Too much risk, mainly because they expire very soon every time. When you want to invest in crypto, I advise you to buy 'real coins' and not to speculate the chart with CFD's. I have bought XRP-Ripple, Bitcoin, Bitcoin Cash, Ethereum, ReddCoin, FeatherCoin, Adcoin (ACC), Bunny Token and looking for NEO now !
-------------------------------------------------------------------------------------------------------------------------------------------
What about my ' Cycle phenomenon' ? read here:
My main strategy is called 'cycle-trading'. After years of learning and practicing after I bought a teaching-package from a visionair, I found a way of how to trade successful with CFD's on the stock-market. Every stock is following an certain cycle which repeats itself. So, movements are often appearing in the same percentage, aswel long as short. This cycles appear at all levels; when you analyse the chart at 1 month, 1 week, 1 day, 1 hour. (others I don't use). This is the case, because all in life is build by the fibonacci sequence. When you analyse the chart, you'll also see the stock market is behaving itself as the fibonacci sequence. But, still the most difficult part and what it's all about, is where does a long or a short start? and which point is telling you that the cycle is started, so that you know it will probably go to the next fibonacci resistance? .... therefore I have developed some own indicators!
The exact positions of where to open, to close and the stop loss position and take profit position is very important to be successful with trading!
My strategy is to never trade on volatile markets. You will lose your money when you do! Trade on technical-chart analysis! not on news and volatility!
One of my other strategies is that trades are only interesting and ‘safe’ to open when: you can possibly lose 1/3rd of the possible profit. So; when you set the indicators after analysing resistances, and you can lose 100 but win 300, it is worth the try!
How do I decide to open a position or not? First I analyse:
- sentiment on the market > are people in buy mode or short mode
- I have some own created indicators, some I show in my charts. Therefor I use the fibonacci sequence. My indicators tell to open a position or not and in combination with other own created indicators I decide where to place the stop loss and take profit positions.
- and this own indicators tell me when probably a new long position starts or a new short > these are the positions where I place my orders! or open directly.
- and again other own created indicators tell me how far long or short it probably goes. The take profit and stop loss positions are other positions than the resistances in the market!
- the moving-averages and bollinger-bands are very important indicators also. They are helping a lot! by making decisions.
And that is Why I win more than I lose in the end. Patience is everything, we’ll wait for the right moment! But don't forget; trading means investing. Sometimes you lose more than you win in the beginning of a period!
Most of the times the sentiment changes on Monday! please consider that when you start a position on Monday. Tuesday, Wednesday and Thursday are on steady markets normally calm trading days. Than, my strategies work at their best!
Don't forget to follow me, so you get updated when I post new ones. Also read my account and the 'status updates' to be informed.
Thank you for following and Succes with trading !
Richard from Rich.Exclusive.Trading

Feathercoin at beautiful bottom. I'll expect long 0.25700.Crypto currencies I don't trade as CFD's. Too much risk, mainly because they expire very soon every time. When you want to invest in crypto, I advise you to buy 'real coins' and not to speculate the chart with CFD's. I have bought XRP-Ripple, Bitcoin, Bitcoin Cash, Ethereum, ReddCoin, FeatherCoin, Adcoin (ACC), Bunny Token and looking for NEO now !
-------------------------------------------------------------------------------------------------------------------------------------------
What about my ' Cycle phenomenon' ? read here:
My main strategy is called 'cycle-trading'. After years of learning and practicing after I bought a teaching-package from a visionair, I found a way of how to trade successful with CFD's on the stock-market. Every stock is following an certain cycle which repeats itself. So, movements are often appearing in the same percentage, aswel long as short. This cycles appear at all levels; when you analyse the chart at 1 month, 1 week, 1 day, 1 hour. (others I don't use). This is the case, because all in life is build by the fibonacci sequence. When you analyse the chart, you'll also see the stock market is behaving itself as the fibonacci sequence. But, still the most difficult part and what it's all about, is where does a long or a short start? and which point is telling you that the cycle is started, so that you know it will probably go to the next fibonacci resistance? .... therefore I have developed some own indicators!
The exact positions of where to open, to close and the stop loss position and take profit position is very important to be successful with trading!
My strategy is to never trade on volatile markets. You will lose your money when you do! Trade on technical-chart analysis! not on news and volatility!
One of my other strategies is that trades are only interesting and ‘safe’ to open when: you can possibly lose 1/3rd of the possible profit. So; when you set the indicators after analysing resistances, and you can lose 100 but win 300, it is worth the try!
How do I decide to open a position or not? First I analyse:
- sentiment on the market > are people in buy mode or short mode
- I have some own created indicators, some I show in my charts. Therefor I use the fibonacci sequence. My indicators tell to open a position or not and in combination with other own created indicators I decide where to place the stop loss and take profit positions.
- and this own indicators tell me when probably a new long position starts or a new short > these are the positions where I place my orders! or open directly.
- and again other own created indicators tell me how far long or short it probably goes. The take profit and stop loss positions are other positions than the resistances in the market!
- the moving-averages and bollinger-bands are very important indicators also. They are helping a lot! by making decisions.
And that is Why I win more than I lose in the end. Patience is everything, we’ll wait for the right moment! But don't forget; trading means investing. Sometimes you lose more than you win in the beginning of a period!
Most of the times the sentiment changes on Monday! please consider that when you start a position on Monday. Tuesday, Wednesday and Thursday are on steady markets normally calm trading days. Than, my strategies work at their best!
Don't forget to follow me, so you get updated when I post new ones. Also read my account and the 'status updates' to be informed.
Thank you for following and Succes with trading !
Richard from Rich.Exclusive.Trading

Bitcoin still possible short to 6900. Will resistance hold?Crypto currencies I don't trade as CFD's. Too much risk, mainly because they expire very soon every time. When you want to invest in crypto, I advise you to buy 'real coins' and not to speculate the chart with CFD's. I have bought XRP-Ripple, Bitcoin, Bitcoin Cash, Ethereum, ReddCoin, FeatherCoin, Adcoin (ACC), Bunny Token and looking for NEO now !
-------------------------------------------------------------------------------------------------------------------------------------------
What about my ' Cycle phenomenon' ? read here:
My main strategy is called 'cycle-trading'. After years of learning and practicing after I bought a teaching-package from a visionair, I found a way of how to trade successful with CFD's on the stock-market. Every stock is following an certain cycle which repeats itself. So, movements are often appearing in the same percentage, aswel long as short. This cycles appear at all levels; when you analyse the chart at 1 month, 1 week, 1 day, 1 hour. (others I don't use). This is the case, because all in life is build by the fibonacci sequence. When you analyse the chart, you'll also see the stock market is behaving itself as the fibonacci sequence. But, still the most difficult part and what it's all about, is where does a long or a short start? and which point is telling you that the cycle is started, so that you know it will probably go to the next fibonacci resistance? .... therefore I have developed some own indicators!
The exact positions of where to open, to close and the stop loss position and take profit position is very important to be successful with trading!
My strategy is to never trade on volatile markets. You will lose your money when you do! Trade on technical-chart analysis! not on news and volatility!
One of my other strategies is that trades are only interesting and ‘safe’ to open when: you can possibly lose 1/3rd of the possible profit. So; when you set the indicators after analysing resistances, and you can lose 100 but win 300, it is worth the try!
How do I decide to open a position or not? First I analyse:
- sentiment on the market > are people in buy mode or short mode
- I have some own created indicators, some I show in my charts. Therefor I use the fibonacci sequence. My indicators tell to open a position or not and in combination with other own created indicators I decide where to place the stop loss and take profit positions.
- and this own indicators tell me when probably a new long position starts or a new short > these are the positions where I place my orders! or open directly.
- and again other own created indicators tell me how far long or short it probably goes. The take profit and stop loss positions are other positions than the resistances in the market!
- the moving-averages and bollinger-bands are very important indicators also. They are helping a lot! by making decisions.
And that is Why I win more than I lose in the end. Patience is everything, we’ll wait for the right moment! But don't forget; trading means investing. Sometimes you lose more than you win in the beginning of a period!
Most of the times the sentiment changes on Monday! please consider that when you start a position on Monday. Tuesday, Wednesday and Thursday are on steady markets normally calm trading days. Than, my strategies work at their best!
Don't forget to follow me, so you get updated when I post new ones. Also read my account and the 'status updates' to be informed.
Thank you for following and Succes with trading !
Richard from Rich.Exclusive.Trading

Ethereum target 443 reached. Will it hold? than we're go long!Crypto currencies I don't trade as CFD's. Too much risk, mainly because they expire very soon every time. When you want to invest in crypto, I advise you to buy 'real coins' and not to speculate the chart with CFD's. I have bought XRP-Ripple, Bitcoin, Bitcoin Cash, Ethereum, ReddCoin, FeatherCoin, Adcoin (ACC), Bunny Token and looking for NEO now !
-------------------------------------------------------------------------------------------------------------------------------------------
What about my ' Cycle phenomenon' ? read here:
My main strategy is called 'cycle-trading'. After years of learning and practicing after I bought a teaching-package from a visionair, I found a way of how to trade successful with CFD's on the stock-market. Every stock is following an certain cycle which repeats itself. So, movements are often appearing in the same percentage, aswel long as short. This cycles appear at all levels; when you analyse the chart at 1 month, 1 week, 1 day, 1 hour. (others I don't use). This is the case, because all in life is build by the fibonacci sequence. When you analyse the chart, you'll also see the stock market is behaving itself as the fibonacci sequence. But, still the most difficult part and what it's all about, is where does a long or a short start? and which point is telling you that the cycle is started, so that you know it will probably go to the next fibonacci resistance? .... therefore I have developed some own indicators!
The exact positions of where to open, to close and the stop loss position and take profit position is very important to be successful with trading!
My strategy is to never trade on volatile markets. You will lose your money when you do! Trade on technical-chart analysis! not on news and volatility!
One of my other strategies is that trades are only interesting and ‘safe’ to open when: you can possibly lose 1/3rd of the possible profit. So; when you set the indicators after analysing resistances, and you can lose 100 but win 300, it is worth the try!
How do I decide to open a position or not? First I analyse:
- sentiment on the market > are people in buy mode or short mode
- I have some own created indicators, some I show in my charts. Therefor I use the fibonacci sequence. My indicators tell to open a position or not and in combination with other own created indicators I decide where to place the stop loss and take profit positions.
- and this own indicators tell me when probably a new long position starts or a new short > these are the positions where I place my orders! or open directly.
- and again other own created indicators tell me how far long or short it probably goes. The take profit and stop loss positions are other positions than the resistances in the market!
- the moving-averages and bollinger-bands are very important indicators also. They are helping a lot! by making decisions.
And that is Why I win more than I lose in the end. Patience is everything, we’ll wait for the right moment! But don't forget; trading means investing. Sometimes you lose more than you win in the beginning of a period!
Most of the times the sentiment changes on Monday! please consider that when you start a position on Monday. Tuesday, Wednesday and Thursday are on steady markets normally calm trading days. Than, my strategies work at their best!
Don't forget to follow me, so you get updated when I post new ones. Also read my account and the 'status updates' to be informed.
Thank you for following and Succes with trading !
Richard from Rich.Exclusive.Trading

Copper still bearish to me. Fibonacci retracement short 2.92000What about my ' Cycle phenomenon' ? read here:
My main strategy is called 'cycle-trading'. After years of learning and practicing after I bought a teaching-package from a visionair, I found a way of how to trade successful with CFD's on the stock-market. Every stock is following an certain cycle which repeats itself. So, movements are often appearing in the same percentage, aswel long as short. This cycles appear at all levels; when you analyse the chart at 1 month, 1 week, 1 day, 1 hour. (others I don't use). This is the case, because all in life is build by the fibonacci sequence. When you analyse the chart, you'll also see the stock market is behaving itself as the fibonacci sequence. But, still the most difficult part and what it's all about, is where does a long or a short start? and which point is telling you that the cycle is started, so that you know it will probably go to the next fibonacci resistance? .... therefore I have developed some own indicators!
The exact positions of where to open, to close and the stop loss position and take profit position is very important to be successful with trading!
My strategy is to never trade on volatile markets. You will lose your money when you do! Trade on technical-chart analysis! not on news and volatility!
One of my other strategies is that trades are only interesting and ‘safe’ to open when: you can possibly lose 1/3rd of the possible profit. So; when you set the indicators after analysing resistances, and you can lose 100 but win 300, it is worth the try!
How do I decide to open a position or not? First I analyse:
- sentiment on the market > are people in buy mode or short mode
- I have some own created indicators, some I show in my charts. Therefor I use the fibonacci sequence. My indicators tell to open a position or not and in combination with other own created indicators I decide where to place the stop loss and take profit positions.
- and this own indicators tell me when probably a new long position starts or a new short > these are the positions where I place my orders! or open directly.
- and again other own created indicators tell me how far long or short it probably goes. The take profit and stop loss positions are other positions than the resistances in the market!
- the moving-averages and bollinger-bands are very important indicators also. They are helping a lot! by making decisions.
And that is Why I win more than I lose in the end. Patience is everything, we’ll wait for the right moment! But don't forget; trading means investing. Sometimes you lose more than you win in the beginning of a period!
Most of the times the sentiment changes on Monday! please consider that when you start a position on Monday. Tuesday, Wednesday and Thursday are on steady markets normally calm trading days. Than, my strategies work at their best!
Don't forget to follow me, so you get updated when I post new ones. Also read my account and the 'status updates' to be informed.
Thank you for following and Succes with trading !
Richard from Rich.Exclusive.Trading

NEO heavy resistance 66.10. Looks like a great buy moment now.Crypto currencies I don't trade as CFD's. Too much risk, mainly because they expire very soon every time. When you want to invest in crypto, I advise you to buy 'real coins' and not to speculate the chart with CFD's. I have bought XRP-Ripple, Bitcoin, Bitcoin Cash, Ethereum, ReddCoin, FeatherCoin, Adcoin (ACC) and looking for NEO now !
-------------------------------------------------------------------------------------------------------------------------------------------
My main strategy is called 'cycle-trading'. After years of learning and practicing after I bought a teaching-package from a visionair, I found a way of how to trade successful with CFD's on the stock-market. Every stock is following an certain cycle which repeats itself. So, movements are often appearing in the same percentage, aswel long as short. This cycles appear at all levels; when you analyse the chart at 1 month, 1 week, 1 day, 1 hour. (others I don't use). This is the case, because all in life is build by the fibonacci sequence. When you analyse the chart, you'll also see the stock market is behaving itself as the fibonacci sequence. But, still the most difficult part and what it's all about, is where does a long or a short start? and which point is telling you that the cycle is started, so that you know it will probably go to the next fibonacci resistance? .... therefore I have developed some own indicators!
The exact positions of where to open, to close and the stop loss position and take profit position is very important to be successful with trading!
My strategy is to never trade on volatile markets. You will lose your money when you do! Trade on technical-chart analysis! not on news and volatility!
One of my other strategies is that trades are only interesting and ‘safe’ to open when: you can possibly lose 1/3rd of the possible profit. So; when you set the indicators after analysing resistances, and you can lose 100 but win 300, it is worth the try!
How do I decide to open a position or not? First I analyse:
- sentiment on the market > are people in buy mode or short mode
- I have some own created indicators, some I show in my charts. Therefor I use the fibonacci sequence. My indicators tell to open a position or not and in combination with other own created indicators I decide where to place the stop loss and take profit positions.
- and this own indicators tell me when probably a new long position starts or a new short > these are the positions where I place my orders! or open directly.
- and again other own created indicators tell me how far long or short it probably goes. The take profit and stop loss positions are other positions than the resistances in the market!
- the moving-averages and bollinger-bands are very important indicators also. They are helping a lot! by making decisions.
And that is Why I win more than I lose in the end. Patience is everything, we’ll wait for the right moment! But don't forget; trading means investing. Sometimes you lose more than you win in the beginning of a period!
Most of the times the sentiment changes on Monday! please consider that when you start a position on Monday. Tuesday, Wednesday and Thursday are on steady markets normally calm trading days. Than, my strategies work at their best!
Don't forget to follow me, so you get updated when I post new ones. Also read my account and the 'status updates' to be informed.
Thank you for following and Succes with trading !
Richard from Rich.Exclusive.Trading
