#LRC/USDT Ready to go up#LRC
The price is moving in a descending channel on the 1-hour timeframe. It has reached the lower boundary and is heading towards breaking above it, with a retest of the upper boundary expected.
We have a downtrend on the RSI indicator, which has reached near the lower boundary, and an upward rebound is expected.
There is a key support zone in green at 0.0514. The price has bounced from this level multiple times and is expected to bounce again.
We have a trend towards stability above the 100-period moving average, as we are moving close to it, which supports the upward movement.
Entry price: 0.0517
First target: 0.0536
Second target: 0.0546
Third target: 0.0561
Stop loss: Below the support zone in green.
Don't forget a simple thing: capital management.
For inquiries, please leave a comment.
Thank you.
LRC

LRC Buy/Long Signal (4H)We have a liquidity pool on the chart that, if swept, could allow the price to rebound strongly upwards. There are two lows, with buyer stop-losses placed just below them.
We have two entry points, which can be entered using a DCA (Dollar-Cost Averaging) approach.
Targets are marked on the chart.
If you would like us to analyze a coin or altcoin for you, first like this post, then comment the name of your altcoin below.

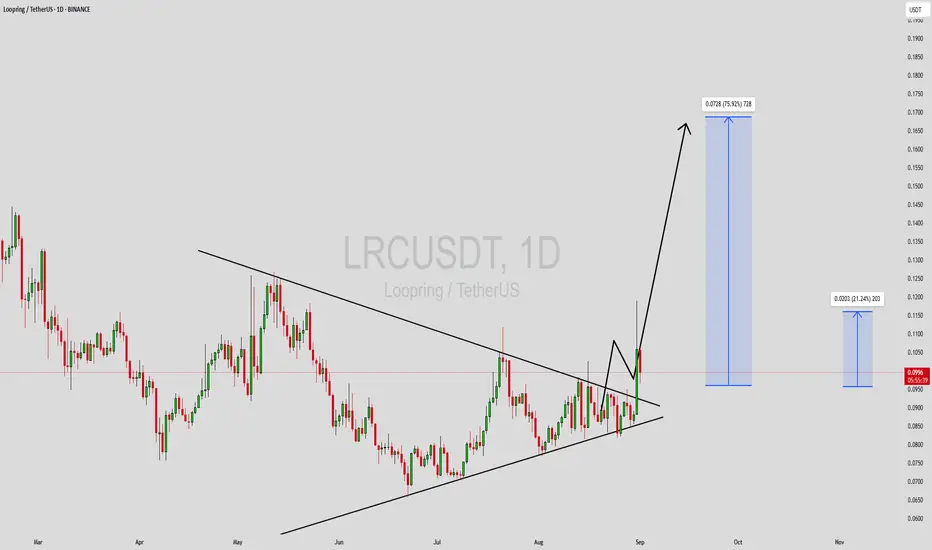
LRCUSDT Forming Falling WedgeLRCUSDT is forming a clear falling wedge pattern, a classic bullish reversal signal that often indicates an upcoming breakout. The price has been consolidating within a narrowing range, suggesting that selling pressure is weakening while buyers are beginning to regain control. With consistent volume confirming accumulation at lower levels, the setup hints at a potential bullish breakout soon. The projected move could lead to an impressive gain of around 90% to 100% once the price breaks above the wedge resistance.
This falling wedge pattern is typically seen at the end of downtrends or corrective phases, and it represents a potential shift in market sentiment from bearish to bullish. Traders closely watching LRCUSDT are noting the strengthening momentum as it nears a breakout zone. The good trading volume adds confidence to this pattern, showing that market participants are positioning early in anticipation of a reversal.
Investors’ growing interest in LRCUSDT reflects rising confidence in the project’s long-term fundamentals and current technical strength. If the breakout confirms with sustained volume, this could mark the start of a fresh bullish leg. Traders might find this a valuable setup for medium-term gains, especially as the wedge pattern completes and buying momentum accelerates.
✅ Show your support by hitting the like button and
✅ Leaving a comment below! (What is your opinion about this Coin?)
Your feedback and engagement keep me inspired to share more insightful market analysis with you!

LRC Showing Renewed StrengthLRC - movement is observed within the bullish flag pattern
We have exited the liquidity zone after a false breakout
It is now more likely that the movement will continue within the pattern to its upper boundary according to Fibonacci levels
Full breakdown with levels and graphs on the website

LRC/USDT – Horizontal channel. Continuing to work.Loopring - is an open protocol designed for building decentralized crypto exchanges.
CoinMarketCap : #262
Since the publication of my trading idea, the price has reached the resistance zone of the inner channel at $0.3338 (+158%). From there, it retraced back to the support of the outer channel, following the overall market movement.
I've marked potential liquidity grabs (wicks) as well as future target zones in case of a trend reversal on the chart.
Remember, if you're feeling scared right now, so is everyone else. Many have lost faith in a market recovery. Typically, these are strong triggers for position accumulation.
There's no need to guess where the price will go—just build your strategy and follow it.
My previous idea generated solid profit, and I'm now reinvesting from profits using compound interest.

Keep Your Eyes on LRC (Short with tight stop or Long at BO)Attention traders! It's time to buckle up, because LRC is facing some serious rejection at a major resistance level on the 4-hour timeframe. But don't be intimidated by this wall of resistance, because we're not backing down. We're going to wait for the breakout before opening any long positions, or you can even consider shorting with a tight stop loss above this resistance. Remember, guys, risk management is key to success in the markets, so keep your cool and stay focused. Get ready for some wild times ahead with LRC!

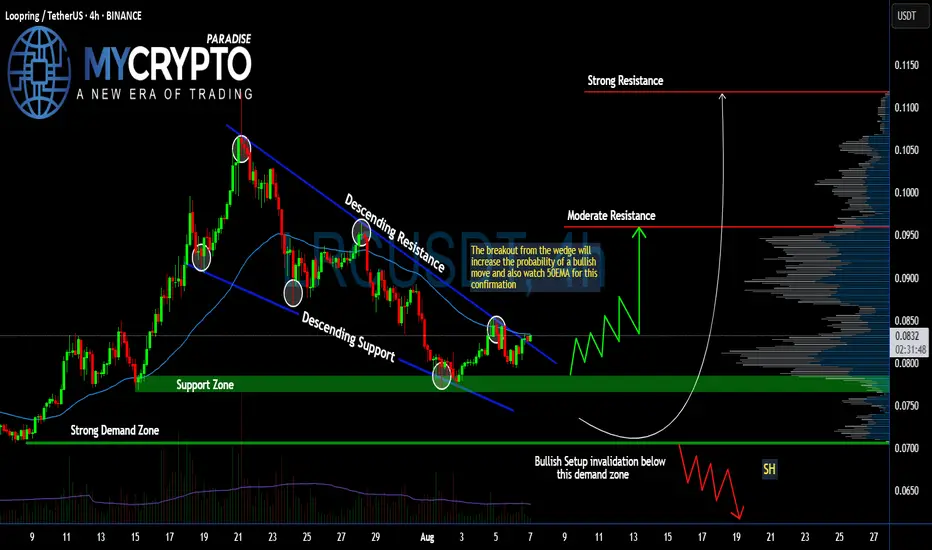
#LRC Ready for a Massive Recovery From Here | Must Watch Yello, Paradisers! Is #LRCUSDT finally ready for a breakout, or is it just another trap for early bulls? Let's break down the current structure of #LRC.
💎#Loopring ( CAPITALCOM:LRC ) has been moving within a descending wedge pattern for weeks, with price consistently making lower highs and lower lows—clearly respecting both descending resistance and support levels. However, we are now starting to see signs of change as it retests the upper trendline.
💎A breakout above the descending resistance is about to occur, and it’s doing so right around the 50EMA, which adds further confluence for a possible bullish move. This move is increasing the probability of a short-term trend reversal.
💎The support zone around $0.078–$0.082 is the key region to watch now. If bulls can hold above this zone and reclaim it as a base, we could see a breakout continuation toward the moderate resistance at $0.096. Should momentum build up from there, the next big target is the strong resistance at $0.1118—a level marked by historical seller interest and significant volume profile resistance.
💎However, if #LRCUSD falls below the strong demand zone at $0.0706, this entire bullish setup becomes invalid. That breakdown would suggest the market isn't ready yet, and could trigger another wave down toward fresh lows.
Stay patient, Paradisers. Let the breakout confirm, and only then do we strike with conviction.
MyCryptoParadise
iFeel the success🌴
LRCUSDT Forming Bullish PennantLRCUSDT is forming a bullish pennant pattern, which is one of the most reliable continuation setups in technical analysis. After a strong upward move, the price has entered into a consolidation phase, creating a pennant structure that often signals the possibility of another breakout to the upside. The consolidation indicates that buyers are holding their positions while sellers are unable to push the price significantly lower, showing strength in the trend.
The trading volume behind LRCUSDT remains healthy, supporting the potential for a strong breakout once the pennant resolves. With investors actively taking interest in this project, the market sentiment is leaning bullish. If the breakout occurs as expected, price projections suggest possible gains of 60% to 70%+, making this an attractive setup for traders looking for high-reward opportunities.
The strong structure of this pattern, combined with growing participation from traders and investors, positions LRCUSDT as a pair to watch closely in the coming sessions. A sustained move above the pennant resistance could trigger momentum-driven buying, leading to a sharp rally and establishing new short-term highs.
✅ Show your support by hitting the like button and
✅ Leaving a comment below! (What is You opinion about this Coin)
Your feedback and engagement keep me inspired to share more insightful market analysis with you!
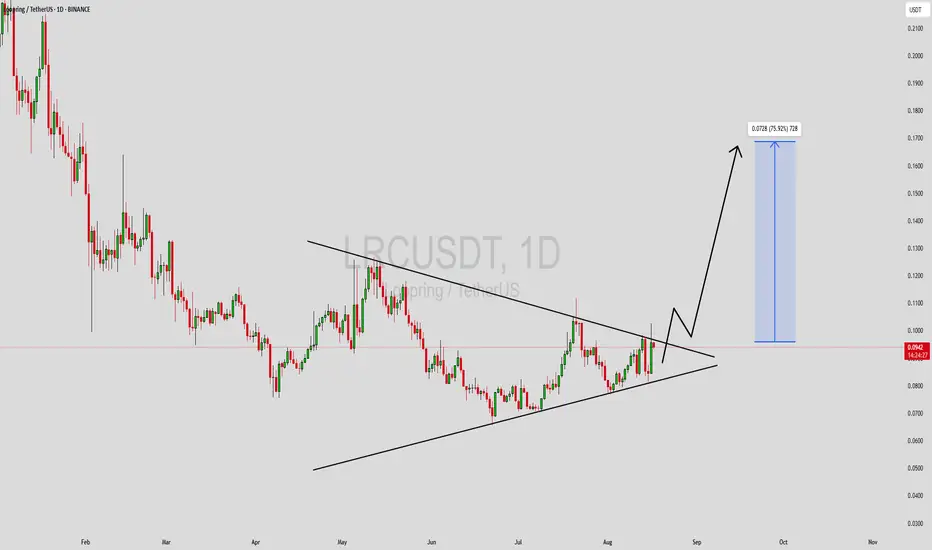
LRCUSDT Forming Symmetrical TriangleLRCUSDT is currently trading within a well-defined symmetrical triangle pattern, indicating a phase of consolidation after a prolonged downtrend. This type of chart formation is often seen as a neutral setup that can break in either direction—but when combined with rising volume and improving market sentiment, the likelihood of a bullish breakout increases. Based on technical analysis, a breakout above the upper trendline resistance could trigger a strong rally, projecting a potential gain of 60% to 70%+ in the near term.
Volume has been gradually increasing, which supports the bullish case. This growing interest from market participants shows that traders and investors are beginning to accumulate positions ahead of a possible breakout. If LRCUSDT clears the key resistance zone with a strong daily close, it could attract even more buyers and build strong upward momentum.
The overall sentiment around LRCUSDT is improving, with more eyes turning toward the project. It’s not only the chart setup that’s catching attention, but also the fundamentals and network activity that continue to support the long-term outlook. With the broader market showing early signs of recovery, LRCUSDT could be well-positioned to outperform many other altcoins if it follows through on this pattern.
✅ Show your support by hitting the like button and
✅ Leaving a comment below! (What is You opinion about this Coin)
Your feedback and engagement keep me inspired to share more insightful market analysis with you!
Loopring Bullish Through 2026 · Bull Market DurationSome people are saying that the altcoins bull market will be over in two months. To me this sounds a little early, too soon I should say.
The market is one but we have thousands and thousands of projects. Some will definitely grow for months, or years, others go down and hit new lows. It is always mixed and it will continue to be mixed because right now everything is already mixed.
Bitcoin was hitting new all-time highs as everything was trading at bottom prices.
Several altcoins now hit a new all-time high but most of the market is in a different situation. We can use this information to reach some conclusions:
1) Bitcoin was the only crypto trading at new all-time highs recently from the major projects.
2) It took a while but then Solana hit a new all-time high and then also XRP. Ethereum moved really strong.
3) We saw many of the smaller altcoins growing 300%, 400% or even 500% or higher, something that never happens in a bear market. Bull market action of course.
We can conclude that the market is growing but it is still early in this phase. Only the bigger projects are up and the rest of the market will eventually get there. It goes step by step but it is already happening.
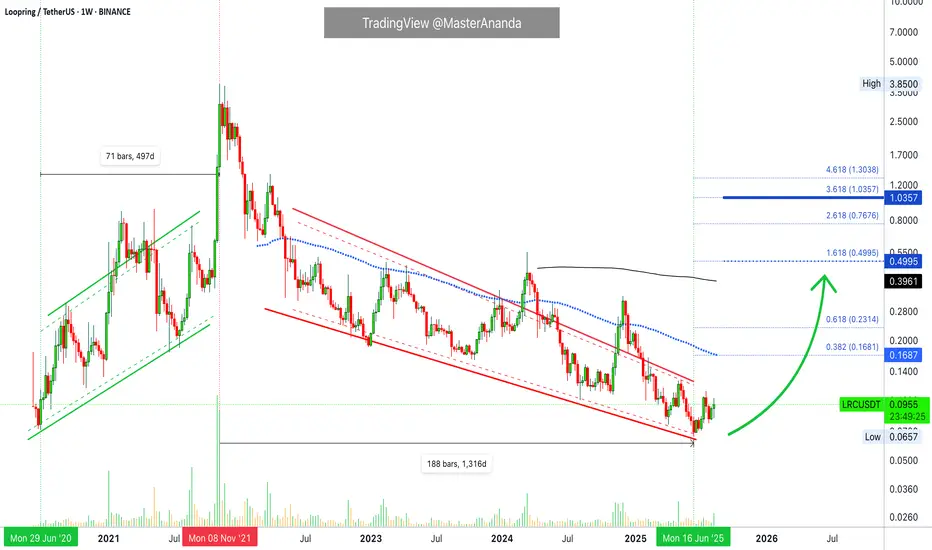
LRC (Loopring) grew for 497 days between June 2020 and November 2021. That is 497 days rising, an uptrend. Then LRCUSDT started dropping until June 2025. Notice that the previous low was five years before this one, June 2020. The entire bearish wave lasted 1,316 days, 3.6 years.
LRCUSDT goes up for 497 days and down for 1,316 days; why would the next bullish cycle end in two months? There is room for years of growth.
I do not agree with the early end of the bull market, we are going into 2026.
Thanks a lot for your continued support.
Namaste.
LRC/USDT 1W – Final Test Before a Major Reversal?> Loopring (LRC) is currently sitting at a critical long-term support zone, and the next few weeks could determine whether a strong reversal or deeper decline will follow.
---
🧠 Macro Overview:
After falling more than 97% from its all-time high (ATH) of $3.0596, LRC is now revisiting a historical demand zone between $0.0657–$0.0821. This area has acted as a powerful launchpad during previous cycles and remains a major accumulation zone.
---
🔎 Technical Structure & Price Action:
✅ Historical Demand Zone (Strong Support)
Marked by the yellow box, this range has historically triggered major price rallies.
Buyers have consistently stepped in at this level since early 2021.
✅ Possible Double Bottom Formation
A potential double bottom pattern is forming in this zone. A breakout above $0.1189 would confirm the bullish reversal structure.
✅ Low Volume = Volatility Brewing
Current low-volume environment could indicate quiet accumulation before a potential breakout.
✅ Weakening Downtrend
The multi-year downtrend is still intact, but the selling momentum is fading as price consolidates in this key support area.
---
🟢 Bullish Scenario (Reversal or Relief Rally):
1. Price holds and bounces from the $0.0657–$0.0821 demand zone.
2. Breakout above $0.1189 (initial resistance) opens the door for:
🎯 $0.1632 – First key resistance.
🎯 $0.3205 & $0.4398 – Mid-term resistance levels.
🎯 $1.1848 – Long-term recovery target if altcoin momentum returns.
> A weekly candle close above $0.1632 with strong volume would confirm the bullish trend shift.
---
🔴 Bearish Scenario (Support Breakdown):
1. A breakdown below $0.0657 would invalidate the support zone.
2. Potential downside targets:
⚠️ $0.0550 – Psychological support.
⚠️ Uncharted territory below $0.0550 could trigger panic selling and deeper declines.
> In this case, strict risk management is essential, as breaking this zone may lead to a fresh leg down in price discovery.
---
📈 Strategy & Outlook:
Short-term/Swing Traders:
Consider speculative entries within the support zone with tight stop-losses below $0.0657.
Wait for a confirmed breakout above $0.1189–$0.1632 for trend validation.
Long-term Investors:
This zone presents a compelling Dollar-Cost Averaging (DCA) opportunity with high reward potential.
However, maintain capital discipline in case of deeper downside risk.
---
💡 Conclusion:
> LRC is at a make-or-break level.
If this historical support holds and volume kicks in, we could be witnessing the early signs of a major weekly reversal.
But if the support fails, it may enter a new bearish phase with further downside.
#LRCUSDT #Loopring #AltcoinReversal #CryptoSupportZone #CryptoAnalysis #TechnicalAnalysis #SwingTradeSetup #BearishOrBullish #LRCChart #CryptoOpportunities

LRC - Sine Line Says: Bullish!Hello TradingView Family / Fellow Traders! This is Richard, also known as theSignalyst.
The picture says it all!
📈For the bulls to take over and ignite the next bullish wave in line with the Sine Line cycles, a break above the $0.12 structure marked in blue is needed.
📚 Reminder:
Always stick to your trading plan — entry, risk management, and trade management are key.
Good luck, and happy trading!
All Strategies Are Good, If Managed Properly!
~Rich

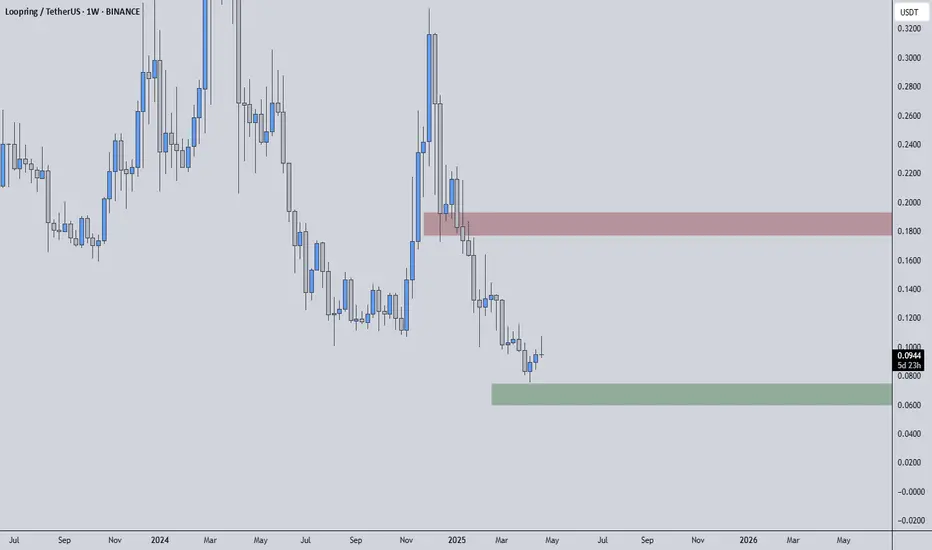
LRCUSDT | Weak Support, Strong Resistance — Proceed with CautionLRCUSDT is trading between clearly defined zones, where the red box acts as a significant resistance and the green box serves as a mild support level. However, the critical detail here is that the support does not appear very reliable — and that should make you extra cautious if you're planning to long from there.
🔴 Resistance: Respect the Sellers
The red box is a zone where sellers have previously stepped in and where supply could easily overwhelm demand again. If price approaches this region and starts to struggle, short opportunities can be considered — but only with confirmation on lower time frames. Think exhaustion candles, failed breakouts, and lack of volume follow-through.
🟢 Support: Don’t Get Too Comfortable
Yes, the green box might offer a small reaction zone, but this isn’t the kind of support you marry — it’s the kind you date briefly. If the price drops and finds temporary footing there, scalps or short-term longs might work, but you should not be expecting major reversals unless significant volume and structure change show up.
🧠 Mental Model:
If price hits the green box and breaks below, don’t hold on hoping for a miracle. Let go fast.
If price reaches the red box and confirms rejection, lean into the short with a tight stop.
If the red box breaks and holds above, especially with volume and bullish orderflow, that’s your cue to flip the bias and ride the move higher with a new mindset.
Remember, trading is a game of adaptation, not ego. Stick to structure, wait for your confirmations, and stay emotion-free in your decisions.
📌I keep my charts clean and simple because I believe clarity leads to better decisions.
📌My approach is built on years of experience and a solid track record. I don’t claim to know it all but I’m confident in my ability to spot high-probability setups.
📌If you would like to learn how to use the heatmap, cumulative volume delta and volume footprint techniques that I use below to determine very accurate demand regions, you can send me a private message. I help anyone who wants it completely free of charge.
🔑I have a long list of my proven technique below:
🎯 ZENUSDT.P: Patience & Profitability | %230 Reaction from the Sniper Entry
🐶 DOGEUSDT.P: Next Move
🎨 RENDERUSDT.P: Opportunity of the Month
💎 ETHUSDT.P: Where to Retrace
🟢 BNBUSDT.P: Potential Surge
📊 BTC Dominance: Reaction Zone
🌊 WAVESUSDT.P: Demand Zone Potential
🟣 UNIUSDT.P: Long-Term Trade
🔵 XRPUSDT.P: Entry Zones
🔗 LINKUSDT.P: Follow The River
📈 BTCUSDT.P: Two Key Demand Zones
🟩 POLUSDT: Bullish Momentum
🌟 PENDLEUSDT.P: Where Opportunity Meets Precision
🔥 BTCUSDT.P: Liquidation of Highly Leveraged Longs
🌊 SOLUSDT.P: SOL's Dip - Your Opportunity
🐸 1000PEPEUSDT.P: Prime Bounce Zone Unlocked
🚀 ETHUSDT.P: Set to Explode - Don't Miss This Game Changer
🤖 IQUSDT: Smart Plan
⚡️ PONDUSDT: A Trade Not Taken Is Better Than a Losing One
💼 STMXUSDT: 2 Buying Areas
🐢 TURBOUSDT: Buy Zones and Buyer Presence
🌍 ICPUSDT.P: Massive Upside Potential | Check the Trade Update For Seeing Results
🟠 IDEXUSDT: Spot Buy Area | %26 Profit if You Trade with MSB
📌 USUALUSDT: Buyers Are Active + %70 Profit in Total
🌟 FORTHUSDT: Sniper Entry +%26 Reaction
🐳 QKCUSDT: Sniper Entry +%57 Reaction
📊 BTC.D: Retest of Key Area Highly Likely
📊 XNOUSDT %80 Reaction with a Simple Blue Box!
📊 BELUSDT Amazing %120 Reaction!
I stopped adding to the list because it's kinda tiring to add 5-10 charts in every move but you can check my profile and see that it goes on..
LRCUSDT 1WLRC ~ 1W Analysis
#LRC This is the lowest support at this time, maybe you can consider starting to buy back from here with a short -term target of at least 15%+

LRC Long -> 1.36$Long Position on LRC/USDT
We have entered a long position at the current price of 0.1348 USDT. Based on our chart analysis, we expect the price to soon reach the marked levels.
At each target, we suggest taking partial profits to secure gains and reduce risk.
Targets:
0.50 USDT – First target, take partial profits here.
0.80 USDT – Second target, take more profits.
1.40 USDT – Final target, exit the remaining position.
A stop-loss should be placed below the recent low to manage risk effectively.

Loopring completed very sneaky right shoulder just b4 goldencrssLoopring snuck in this extremely small right shoulder and price action has now retested the neckline as support right before Oo prints golden cross is set to occur. I’m guessing the breakout up from the inverseheadandshoulders is validated very close to when the cross occurs. *not financial advice*

LRC is Setting Up BIG!Loopring (LRC) is presenting an excellent opportunity with a confluence of technical factors aligning at the old high demand zone. This area holds significant importance as it combines the strength of a multi-tap demand zone with a Fibonacci retracement level, enhancing its reliability for a potential bounce.
Why the Old High Demand Zone is Key
3-Tap Test:
The price has tapped into this demand zone multiple times, signaling its strength as a support level. Each tap reinforces the zone, indicating buyer interest and the likelihood of a reversal from this level.
Historical Significance:
This zone corresponds to a previous high where LRC established strong momentum. Retesting old highs as support is a common bullish continuation pattern, suggesting this area is crucial for price stability.
Fibonacci Confluence:
The demand zone aligns perfectly with a key Fibonacci retracement level (e.g., 0.618 or 0.786). Fibonacci levels are widely respected in the market, making this zone even more attractive for an entry.
Why This Setup Stands Out
High-Probability Reversal: The confluence of factors increases the likelihood of a strong bounce, making it an ideal point to join the trend.
Low Risk, High Reward: Entering near this zone offers a tighter stop-loss and greater upside potential if the price rebounds.
Market Structure Support: The demand zone holds significance in maintaining the bullish structure of LRC.
How to Approach This Trade
Spot Buy at the Demand Zone: Place buy orders within the old high demand zone, ensuring you're positioned at this critical level.
Watch for Confirmation: Look for bullish price action, such as candlestick patterns (e.g., hammer or engulfing candles) or increasing volume near the zone.
Set a Stop-Loss: Place a stop-loss slightly below the demand zone to protect against invalidation.
Hold for a Fibonacci Extension: If the price bounces, aim for higher Fibonacci extension levels as potential targets.
I keep my charts clean and simple because I believe clarity leads to better decisions. Trading doesn’t have to be overly complicated, and I enjoy sharing setups that have worked well for me.
My approach is built on years of experience and a solid track record. I don’t claim to know it all, but I’m confident in my ability to spot high-probability setups. It’s all about learning and growing together as traders, and I’m here to share what I see.
The markets can confirm what the charts whisper if we’re paying attention. I hope these levels help you as much as they’ve helped me in the past. Let’s see how this plays out!
Tip of The Iceberg
🐶 DOGEUSDT.P: Next Move
🎨 RENDERUSDT.P: Opportunity of the Month
💎 ETHUSDT.P: Where to Retrace
🟢 BNBUSDT.P: Potential Surge
📊 BTC Dominance: Reaction Zone
🌊 WAVESUSDT.P: Demand Zone Potential
🟣 UNIUSDT.P: Long-Term Trade
🔵 XRPUSDT.P: Entry Zones
🔗 LINKUSDT.P: Follow The River
📈 BTCUSDT.P: Two Key Demand Zones
🟩 POLUSDT: Bullish Momentum

#LRC/USDT Ready to go up#LRC
The price is moving in a descending channel on a 1-day frame and sticking to it well
We have a bounce from the lower limit of the descending channel, this support is at 0.2112
We have a downtrend on the RSI indicator that is about to be broken, which supports the rise
We have a trend to stabilize above the moving average 100
Entry price 0.2150
First target 0.2258
Second target 0.2331
Third target 0.2427

Alt coins ready to run ANKR, BAT, LINK, RNDR, DOT, LTC, LRC, ETCThis market is great for trading trend lines, look at this chart as an example, the two thick dark purple likes. The short one represented resistance for about 5 months, we finally broke that resistance and we broke out, we ran to top of what had been resistance for about 18 months, we had a small hiccup in both places and the break out from that trend line lead to XLM running virally, up to 65% in one day.
Every day there are may assets reaching towards a break out point, and that's what I try to look for. I start on 1 day charts and then come down to a 4h or 1h candle, really no since in going to a shorter candle unless you are looking for precision entry. The main thing to take away from this is that when an asst breaks a resistance it tends to run, many times first coming down and proving that line to be support instead of resistance, then taking off, sin any case, the break of a trend line is generally a fuse lit for a run. The longer the resistance, the more times its resisted and then it breaks out, the break out tends to be stronger.
Here are some alts i have been watching that seem to be staging breakouts or possibly in an early stage of the breakout.
I like ENJ, ANKR, BAT, LINK, RNDR, DOT, 1INCH, mostly these are midcap, but they have started to break out from recent trends.
I kind of like LTC, LRC, ETC, ATOM, BNT, MASK, MPL. Higher risk, but they have staged a breakout and most of these have lower marketcap so easier for them to get pushed further.
Lots of other coins nearing some breakout points as well, they seem to be coming in waves with each day throwing us some 20,50, even 100% gains some times.
I will try to post another update of break outs soon but in between all the trading and working to try to make my ai tech startup do something, my time is short. That also can lead me to evaluate things too quickly sometimes so don't just take what I say as a trigger to pull, use it as a flag to get your interest in evaluating these things yourself.
The market is very bullish right now and there is a lot of opportunity to make nice gains and also to lose a lot buying the dead end of a recent run. Be vigilant.

LRC looks bullishThe LRC appears to have completed a correction that was ABC and wave C was a terminal.
We are looking for buy/long positions on the green range
The target is the red box on the chart.
Closing a daily candle below the invalidation level will violate this analysis
For risk management, please don't forget stop loss and capital management
Comment if you have any questions
Thank You

LRCUSD LoopRing... Ring.. Ring. Hello? Like a phone, lol get it?
Okay, enough fun, time for the serious stuff.
Loopring is at support area, where things are flipping in the bullish direction
I don't know the exact point it moves, but I know .1 was an area of support on a past chart.
Take this move and probably compress the line, which isn't as accurate and more a guide to show the idea of a potential trend move to the upside.
Okay, here is help from AI
Here's an analysis based on the chart provided:
### Overview:
- **Asset:** Loopring (LRC) against USD on the BITSTAMP exchange.
- **Time Frame:** Weekly chart from 2023 projected into the future until 2028.
### Key Observations:
1. **Price Movement Analysis:**
- The chart displays a pattern where the price of Loopring has been oscillating within a broadening formation, often referred to as a "megaphone" pattern. This is characterized by an expanding range between resistance and support lines, suggesting increasing volatility.
2. **Technical Indicators:**
- **Price Levels:** The current price is at $0.04002, with a slight decrease (-0.17%) from the previous period.
- **Volume:** The volume on the trading day is 229K, indicating moderate trading activity.
3. **Trend Analysis:**
- **Support and Resistance:** The chart shows potential support around $0.02700 and resistance at approximately $0.07800. The price has been bouncing between these levels, with historical attempts to break above the upper resistance.
- **Divergence:** There appears to be a divergence between the price action and the RSI (Relative Strength Index). While the price has been making higher highs, the RSI hasn't followed suit, which could be a sign of weakening momentum, hinting at a possible correction or consolidation phase.
4. **RSI Indicator:**
- The RSI is currently in the neutral zone, neither overbought nor oversold, which might suggest a phase of indecision or consolidation in the market for Loopring.
5. **Future Projections:**
- **Trend Lines:** The chart includes two trend lines drawn in a way that suggests an anticipated breakout or continuation pattern. The upper line acts as a resistance that has yet to be decisively breached, while the lower line serves as a support. Given the broadening pattern, there's an expectation of a significant move, but the direction is uncertain based on this chart alone.
6. **Volume Analysis:**
- The volume bars show periods of high volume followed by lower volumes, typical in a broadening pattern where the market tests new highs and lows with less conviction each time.
### Potential Scenarios:
- **Bullish Scenario:** If the price breaks above the upper resistance line with strong volume, it could signal a bullish trend continuation. This would align with the broader market's bullish sentiment if other external factors are favorable.
- **Bearish Scenario:** A drop below the lower support line could indicate a bearish trend, potentially leading to a test of lower levels, around the 0.02370 region, indicated by the horizontal line.
### Trading Strategy Implications:
- **Entry Points:** For a bullish trade, one might look for a confirmation of a breakout above the resistance with increased volume. Conversely, for a bearish stance, a break below support could prompt a short position.
- **Exit Points:** Setting stop-losses just below support or above resistance could help manage risk effectively. For profit-taking, aiming for the next significant resistance or support levels as shown might be strategic.
### Recommendations:
- **Wait for Confirmation:** It might be wise to wait for a clear breakout in either direction before committing to a trade. False breakouts are common in broadening patterns, so volume and price action confirmation are crucial.
- **Time Frame Considerations:** Given the long-term nature of this chart, this analysis might be more suited for swing trading or long-term investment rather than day trading.
- **Backtesting:** Before live trading, backtest any strategy you might derive from this chart against historical data to gauge its effectiveness.
- **Market Sentiment:** Keep an eye on market sentiment and news related to Loopring or the broader crypto market. Fundamental analysis might also be necessary to understand why such patterns are forming, especially in the context of broader market trends.
### Conclusion:
The chart suggests Loopring might be at a critical juncture, potentially poised for a breakout. However, the broadening pattern's nature implies caution, as it can lead to either a significant rise or fall. Traders should use additional tools like moving averages, MACD, or Fibonacci retracement for more refined entry and exit points. Given the chart's time frame, patience and a cautious approach are recommended. Always remember, in trading, patience can be a virtue, and understanding the broader market context is crucial.
Remember, this is not financial advice, and while technical analysis provides insights, it's just one tool in a trader's toolkit. Always consider combining TA with fundamental analysis and market sentiment for a more comprehensive view.

LRCUSD LOOPRING IS THIS THE END?not really, unless something super major happens which is outside of TA and puts the coin down to nearly nothing.
Overall, RSI is bearish, but gearing up to move bullish for at least a little bit, at which point, it can reject the short term trend and continue to funnel down or it doesn't and the short term trend ends up moving LRC to the higher price targets.
Everything is marked on the chart.
This is the Monthly view so really long term viewpoint.
Anyway, all the other LRC charts cover a lot of the moves, trends and price targets so this one is staying simple.
