LTC about ready to move $225LTC approaching 60 RSI and did the same on the last move to 228. I think its about to confirm a 3 green marching soldiers move.
LTC-USD


LTCUSD approaching support, potential bounce!LTCUSD is approaching its support at 109.600 (multiple swing low support) where a bounce may occur, causing price to rise to its 1st resistance at 136.839 (23.6% Fibonacci retracement, 38.2% Fibonacci retracement, horizontal overlap resistance). We have also identified another support level at 96.787 (61.8% Fibonacci extension).
Stochastic (34, 5, 3) is approaching its support at 7.5% where a corresponding reaction could occur.

We need to see a bounce here - otherwise .... Have a look at the 106USD - 100USD levels. If they break, we face a serious problem.
If we manage to bounce and gain some momentum to the upper side and break out of the triangle to the upper side, we may see a bullrun similar to last years spring bullrun.

LTC/USD double bottom and double bull patternNow we see how the second local bottom is formed, repeating the history of Bitcoin, and the bull patterns that are shown in purple and red lines are also pending completion, so beware, but also do not forget to use stop limits because the market is very speculative and unstable
You can find a top inside new at www.dabinside.com this platform the first


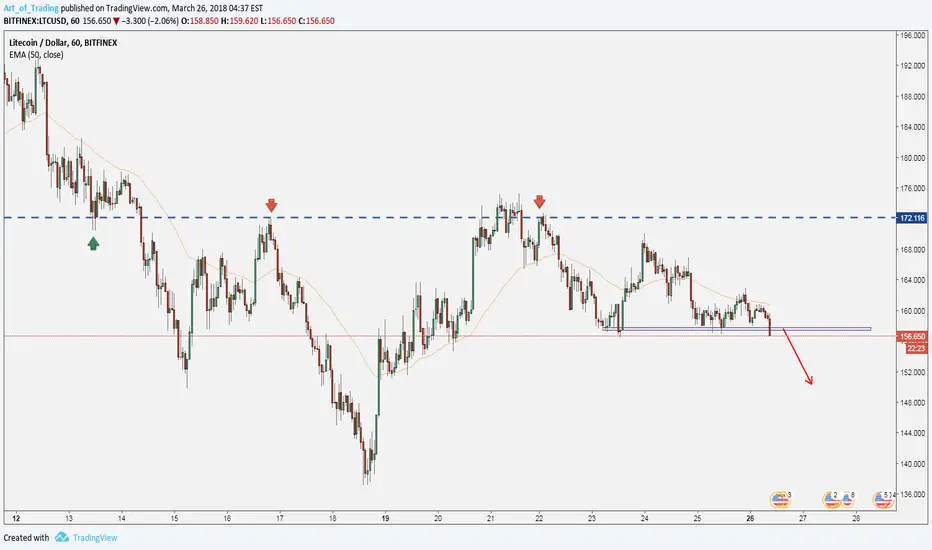
LITECOIN (LTC) - Support Becomes Resistance?!The LTCUSD moves sideways last few days and could not manage to break the support level at 157. However, there is a selling momentum at the moment, which may break this level and price may continue falling down. The best approach here is to wait for a strong bearish bar to consider it as a valid breakout and then sell.
LITECOIN (LTC) Breakouts - Opportunity to Go Long?There is an interesting setup on Litecoin H1 chart. The price reached the resistance level at 171 and it is considered as a valid breakout, because the bars closed outside of resistance zone. Then, it backtested back and went up. It means, the buyers got control of the price and the more bullish moves are expected. That previous resistance now acts as a support level again.

LITECOIN (LTC) Structure TradingThere is a potential opportunity for structure traders. There is the resistance level at 171. The price respected that level few times and it is more likely it will do again. We know the big orders usually are placed at those areas and I expect the sellers are ready to step once it reaches the red box.

Litecoin US dollar Fibonacci retracement levelsMy thesis is that LTCUSD will trade between $137.75-143.75

LITECOIN (LTC) Bat Pattern & StructureThe Litecoin priced was dropped significantly last few days, The next structure low is at 108 that acts as support. If the price continues going down at that point, it will create a buying opportunity. The price respected that level twice and it is more likely it will do again. Moreover, there is a potential bat pattern formation, which increases the probability of this setup.
T1 – 38.2%
T2 – 61.8%

Litecoin to bounce?LTCUSD looking like a good spot to start pushing back up. Markets have been quiet but its just a matter of time!

XRP Elliot Wave...What do you guys think?Wow today has been a rough day for me......Would have loved to have shorted but was scared even though the signs were out there. I have been in this same situation before. It goes down and i dont short. Then, while we are at or close to bottom, I start trying to play around with a couple of coins only to get stuck buying in later at a higher price. (I think they are watching me!)
Question. The first run up to 3.50 I assume can be wave 1 of Elliot Wave which would put us at wave 2 or 3. If we are in wave 3 that means bottom has already been met @56 cents.Which would be great cause wave 3 is impulse wave up and is (usually longest wave.)
If we are still in wave 2 we can still go down from here because it would have to be lower than 56 cents!?!?
I guess that is the million dollar question.
I am leaning more towards wave 3 because I feel like wave 2 is usually shorter than wave 1. But at the same time the way the market(S) are going I feel like there is more downside. Id love to see what you guys are thinking
Kindest regards

Sellers Control LITECOINThe interesting moves on LTCUSD H1 chart. There was strong bullish move (green long bar) few hours ago, but it was rejected by bears and pushed the price down. It means, there was the shift of powers from buyers to sellers. The price is going down last few hours and it means the sellers control the price at the moment. There is a major resistance level at 192; the price respected multiple times and it is more likely it will do it again. The LTCUSD already bounced backed after touching that level. I expect the price will continue going down and maintain its bearish momentum.

LITECOIN Harmonic Moves - Bat Pattern for Sell?!The LTCUSD price is reaching the structure high at 194.5 that acts as a resistance level. The recent few bars show that there is buying momentum and the price went little up and if it reaches the 88.6 fibo retracement then it completes the bat pattern. This will increases the probability of this trading setup to go short. The best approach here is to wait the market to make moves and once it is confirmed that the resistance rejected the price, then I will place the sell order.
T1 – 38.2%
T2 – 61.8%

LTC-USD ending ABCDE correctionLTC looks like it just finished an ABCDE correction. I count 5 subwaves with a 3-3-3-3-3 structure.
If this is the case we are now in, or just finishing an impulse wave 1 usually ending in the same region as the B wave.

Litecoin already broke the downwards trend.However btc is struggling. BTC has barely broke out of the downward trend and needs LTC to pull it out. We've seen the bottom of ltc. this year. 100,125,150, now 175. The next bottom will easily be 200, since I am 90% certain we are in a upwards trend now. Good luck people!

LTDUSD: LITECOIN Decision PointThe LTCUSD price is at the key support level at 186; this is a decision point where buyers or sellers will get control of the price. We have seen that the price respected that level twice already (green arrows) and left the long shadows. However, the buyers could not manage to push the price up much. If the price breaks that structure then, it is more likely that LTC will fall.

Put the bears down. For good this time. Reversal Imminent!LTC is leading the way once again! Reversal is Imminent friends, we have reached the bottom, and stared at it with our own two very eyes. It was disgusting to say the least. It is time for the bears to go back into hibernation, if not we put them down by force! For good this time. THIS IS THE TIME TO BUY! REMEMBER EVERY SUPPORT AND RESISTANCE ALWAYS GETS RETESTED. WE JUST TESTED OUR SUPPORT. IT HELD. TIME TO GO FOR 250 AGAIN! My call for 250 two weeks back was SPOT ON, and WE PROFITED. LET'S TAKE GAINS, AGAIN!
Vote and like! THANK YOU!

LTCUSD: Potential Bat Pattern - LITECOINThe LTCUSD price did not drop much compare to other cryptocurrencies. It fell last few days, but had a steady raise in mid February. However, the sellers got control the price in the last few days. If it continues dropping it may create a good opportunity to go long.
There is a structure low at 107 and which acts as support level. The large orders usually placed on those key levels. In addition, the price may form the bat pattern which increases the probability of this setup.
T1- 38.2%
T2 – 61.8%
- Follow & Comment -

LTC - next stop: 160After the symmetric triangle broke to the lower side, we were able to set a target at about 160 USD. My buying target is 162 USD at the 0.618 fibonacci retracement of the previous pump.
Your thoughts are appreciated in the comments...

LTCUSD testing its support, potential rise!LTCUSD tested its support at 194.484 (76.4% Fibonacci retracement , horizontal swing low support) and a potential rise could occur to its resistance at 217.160 (61.8% Fibonacci retracement , horizontal swing high resistance).
Stochastic (89, 5, 3) shows a bullish divergence which suggest a corresponding increase in price could occur.

