LTCUSD approaching resistance, potential drop! LTCUSD is approaching our first resistance at 13.24 (horizontal pullback resistance, 61.8% Fibonacci extension, 23.6% Fibonacci retracement) where a strong drop might occur to our major support at 94.33 (23.6% Fibonacci retracement).
Stochastic (21,5,3) is also approaching resistance.
LTC-USD

Bitcoin hits $5,000 as cryptocurrency market bulls returnBitcoin bulls return
Bitcoin surged above the $5,000 resistance level this week as the market capitalization of the entire digital currency market reached its highest level of the year so far. Bitcoin moved above its 200-day moving average for the first time since May 2018, as the BTCUSD pair advanced towards the $5,300 level before correcting lower, as traders booked profits from overstretched levels. Bitcoin had spent much of the last trading month consolidating in a narrow price range between the $3,800 to $,4,000 level prior to its strong technical breakout above the $4,200 level.
• The BTCUSD pair is only bearish while trading below the $4,200 level, key support is found at the $4,100 and $4,000 levels.
• If the BTCUSD pair trades above the $4,400 level, buyers may test towards the $5,300 and $6,000 resistance levels.
RBA turning dovish
The Australian dollar moved lower against the US dollar and the Japanese yen currency following the release of the Reserve Bank of Australia interest rate statement. The RBA maintained interest at record low levels as widely expected, with the central bank issuing more dovish forward policy guidance. The RBA noted that domestic risks in the global and domestic economy continue to be the main areas of concern for Australian policymakers. Financial market participants are now speculating that RBA will slash interest rates as soon as August this year.
• The AUDUSD pair is bearish while trading below the 0.7245 level, key support is found at the 0.7030 and 0.6930 levels.
• If the AUDUSD pair trades above the 0.7245 level, buyers may test towards the 0.7310 and 0.7380 resistance levels.
Brexit wrangling
The British pound moved higher against the greenback this week as British Prime Minter Theresa May lost control of Brexit. UK Parliament voted to take power away from PM May over key Brexit decisions, as she failed to find a clear resolution to the United Kingdom’s departure from the EU. Markets cheered the move by UK Parliament, to take control of Brexit, as traders and investors perceived that the chances of a no-deal Brexit have now decreased. The GBPUSD pair advanced towards the 1.3200 level, after briefly dipping towards the 1.3000 level in early week trading.
• The GBPUSD pair is only bearish while trading below the 1.3100 level, key support is found at the 1.2975 and 1.2660 levels.
• If the GBPUSD pair trades above the 1.3100 level, key resistance is found at the 1.3200 and 1.3270 levels.
Litecoin rally
Litecoin performed its strongest weekly advance since February 2018 this week, as the surge in the value of Bitcoin provoked a wave of buying towards other digital assets. Litecoin advanced towards the $100.00 level, with the fifth largest cryptocurrency by market capitalization adding close to fifty percent in value. Ethereum also posted strong double-digit gains, with the second largest cryptocurrency moving towards the $180.00 level, after starting the month of April close to the pivotal $140.00 level.
• The LTCUSD pair is only bullish while trading below the $56.00 level, key resistance is found at the $100.00 and $120.00 levels.
• If the LTCUSD pair trades below the $56.00 level, sellers may test towards the $50.00 and $42.00 support levels.

LTCUSD approaching resistance, potential drop! LTCUSD is approaching our first resistance at 13.24 (horizontal pullback resistance, 61.8% Fibonacci extension, 23.6% Fibonacci retracement) where a strong drop might occur to our major support at 94.33 (23.6% Fibonacci retracement).
Stochastic is also approaching resistance.
Trading CFDs on margin carries high risk.
Losses can exceed the initial investment so please ensure you fully understand the risks.

LTCUSD approaching resistance, potential drop! LTCUSD is approaching our first resistance at 113.24 (horizontal pullback resistance, 23.6% Fibonacci retracement) where a strong drop might occur to our major support at 94.33 (23.6% Fibonacci retracement).
Stochastic is also approaching resistance.
Trading CFDs on margin carries high risk.
Losses can exceed the initial investment so please ensure you fully understand the risks.

LTCUSD approaching support, potential bounce!LTCUSD is approaching our first support at 57.14 (horizontal overlap support, 50% Fibonacci retracement, 100%, 61.8% Fibonacci extension) where a strong bounce might occur above this level pushing price up to our major resistance at 63.31 (61.8% Fibonacci extension).
Stochastic is also approaching support.
Trading CFDs on margin carries high risk.
Losses can exceed the initial investment so please ensure you fully understand the risks.

LTCUSD approaching support, potential bounce!LTCUSD is approaching our first support at 57.14 (horizontal overlap support, 61.8% Fibonacci extension) where a strong bounce might occur to our major resistance at 63.29 (horizontal swing high resistance, 61.8% Fibonacci extension).
Stochastic (21,5,3) is also approaching support where we might see a corresponding bounce in price.
Trading CFDs on margin carries high risk.
Losses can exceed the initial investment so please ensure you fully understand the risks.

LTCUSD approaching support, potential bounce!LTCUSD is approaching our first support at 54.90 (horizontal swing low support, 100%, 61.8% Fibonacci extension) where a strong bounce might occur to our major resistance at 60.93 (horizontal swing high resistance).
Stochastic (89,5,3) is also approaching support where we might see a corresponding bounce in price.
Trading CFDs on margin carries high risk.
Losses can exceed the initial investment so please ensure you fully understand the risks.

LTCUSD approaching support, potential bounce!LTCUSD is approaching our first support at 54.90 (horizontal swing low support, 61.8%, 100% Fibonacci extension) where a strong bounce might occur to our major resistance at 59.20 (horizontal overlap resistance, 61.8% Fibonacci retracement).
Stochastic (21,5,3) is also approaching support where we might see a corresponding bounce in price.
Trading CFDs on margin carries high risk.
Losses can exceed the initial investment so please ensure you fully understand the risks.


LTCUSD approaching resistance, potential drop! LTCUSD is approaching our first resistance at 56.85 (horizontal swing high resistance, 23.6% Fibonacci retracement, 100% Fibonacci extension, Elliot wave structure) where a strong drop might occur to our major support at 44.79 (horizontal swing low support, 38.2%, 76.4% Fibonacci retracement).
Stochastic (89,5,3) is also approaching resistance where we might see a corresponding drop in price.
Trading CFDs on margin carries high risk.
Losses can exceed the initial investment so please ensure you fully understand the risks.

LTCUSD approaching resistance, potential drop! LTCUSD is approaching our first resistance at 56.85 (horizontal swing high resistance, 23.6% Fibonacci retracement, 100% Fibonacci extension, Elliot wave structure) where a strong drop might occur to our major support at 44.79 (horizontal swing low support, 38.2%, 76.4% Fibonacci retracement).
Stochastic (34,5,3) is also approaching resistance where we might see a corresponding drop in price.
Trading CFDs on margin carries high risk.
Losses can exceed the initial investment so please ensure you fully understand the risks.

There is a possibility for the beginning of an uptrend in LTCUSDMidterm forecast:
While the price is above the support 22.45, beginning of uptrend is expected.
We make sure when the resistance at 74.35 breaks.
If the support at 22.45 is broken, the short-term forecast -beginning of uptrend- will be invalid.
Technical analysis:
While the RSI support #1 at 44 is not broken, the probability of price decrease would be too low.
Price is above WEMA21, if price drops more, this line can act as dynamic support against more losses.
Relative strength index (RSI) is 61.
Trading suggestion:
. There is a possibility of temporary retracement to suggested support zone (42.20 to 30.05). if so, traders can set orders based on Price Action and expect to reach short-term targets.
Beginning of entry zone (42.20)
Ending of entry zone (30.05)
Entry signal:
Signal to enter the market occurs when the price comes to " Buy zone " then forms one of the reversal patterns, whether " Bullish Engulfing ", " Hammer " or " Valley " in other words,
NO entry signal when the price comes to the zone BUT after any of the reversal patterns is formed in the zone.
To learn more about " Entry signal " and the special version of our " Price Action " strategy FOLLOW our lessons:
Take Profits:
TP1= @ 55.15
TP2= @ 64.45
TP3= @ 74.35
TP4= @ 89.45
TP5= @ 109.10
TP6= @ 130.95
TP7= @ 165.05
TP8= @ 196.55
TP9= @ 237.40
TP10= @ 295.80
TP11= @ 370.35
TP12= Free

LTCUSD approaching resistance, potential drop! LTCUSD is approaching our first resistance at 56.85 (horizontal swing high resistance, 23.6% Fibonacci retracement, 100% Fibonacci extension, Elliot wave structure) where a strong drop might occur to our major support at 44.79 (horizontal swing low support, 38.2%, 76.4% Fibonacci retracement).
Stochastic (34,5,3) is also approaching resistance where we might see a corresponding drop in price.
Trading CFDs on margin carries high risk.
Losses can exceed the initial investment so please ensure you fully understand the risks.


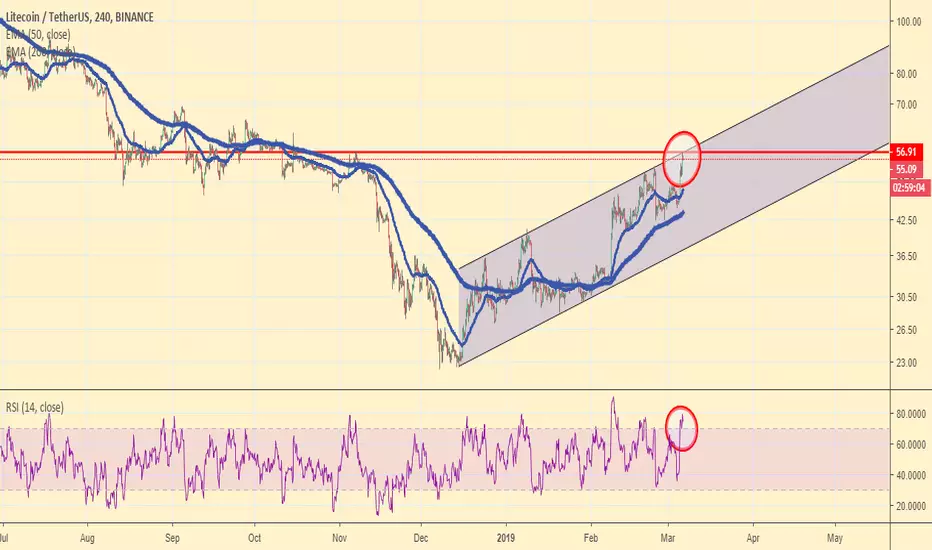
Litecoin(LTC) buyers be careful !!Here LTC touches resistance in 3 forms
1. Red line in chart is major price resistance where sellers with high volume can come.
2. RSI is 70+ (Overbought)
3. LTC chart moving in a parallel channel and touching channel resistance.
These are the most common and easy technical which all traders follow. If most of peoples of market follows these then we can see a sharp fall in prices.
please follow me if you want ideas like this.
LTCUSD approaching resistance, potential drop! LTCUSD is approaching our first resistance at 56.85 (horizontal swing high resistance, 23.6% Fibonacci retracement, 100% Fibonacci extension, Elliot wave structure) where a strong drop might occur to our major support at 44.79 (horizontal swing low support, 38.2%, 76.4% Fibonacci retracement).
Stochastic (34,5,3) is also approaching resistance where we might see a corresponding drop in price.
Trading CFDs on margin carries high risk.
Losses can exceed the initial investment so please ensure you fully understand the risks.

LTCUSD approaching support, potential bounce! LTCUSD is approaching our first support at 41.59 (horizontal overlap support, 38.2%, 50% Fibonacci retracement, 61.8%, 100% Fibonacci extension) where a strong bounce might occur below this level pushing price up to our major resistance at 48.81 (61.8% Fibonacci retracement).
Stochastic (89,5,3) is also approaching support where we might see a corresponding rise in price.
Trading CFDs on margin carries high risk.
Losses can exceed the initial investment so please ensure you fully understand the risks.

LTCUSD approaching support, potential bounce! LTCUSD is approaching our first support at 41.59 (horizontal overlap support, 38.2%, 50% Fibonacci retracement, 100% Fibonacci extension) where a strong bounce might occur below this level pushing price up to our major resistance at 48.81 (61.8% Fibonacci retracement).
Stochastic (89,5,3) is also approaching support where we might see a corresponding rise in price.
Trading CFDs on margin carries high risk.
Losses can exceed the initial investment so please ensure you fully understand the risks.
