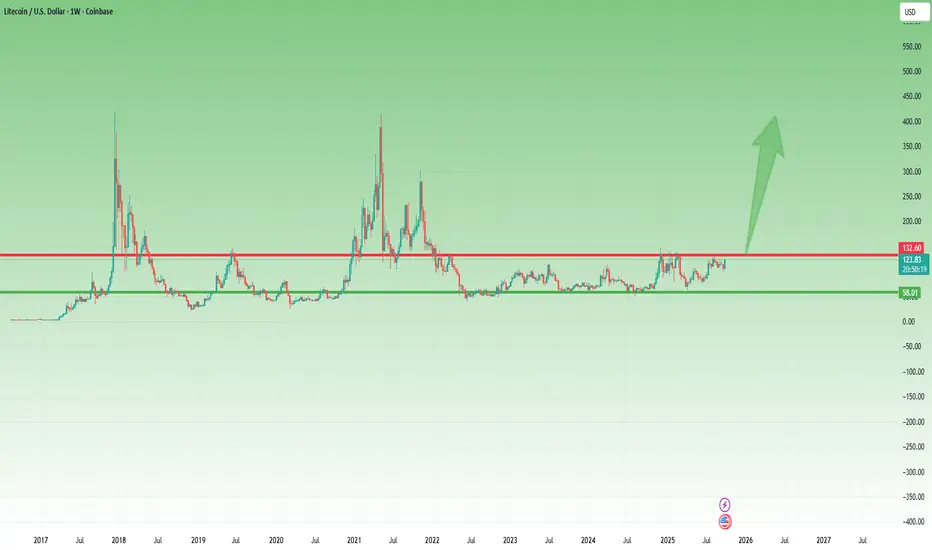
Litecoin Ready to Explode After 3 Years of SleepIn recent years, with the flood of new crypto projects, Litecoin has quietly faded into the background.
Since the local low in May 2022, the price action has been rather lethargic, contained within a well-defined range between 60 and 130 USD.
However, since April 2025, something interesting has been happening — Litecoin seems to be waking up, quietly and almost secretly, as if not to attract too much attention.
From that point onward, LTC/USD has been steadily printing higher lows, and if we zoom out to the longer-term chart, the structure looks remarkably clean — almost textbook — for a potential breakout setup.
Even recently, after another touch of the resistance zone, the correction that followed took the form of a bullish flag, and last week’s strong engulfing candle practically erased an entire month of pullback, now pressing once again against the key resistance level.
In my opinion, it’s time for this cryptocurrency to wake up.
A clear break above 130 would be a strong technical confirmation of that view.
While Litecoin might not deliver the “10x hype” potential that newer tokens promise, it has consistently proven to be one of the most stable and resilient assets in the crypto space.
After three years of accumulation, a breakout could easily trigger an explosive move to the upside.
📈 I’m personally buying Litecoin, with a target around 300 USD in the medium term.
Sometimes, the coins everyone forgets about are the ones that surprise the most. 🚀
Ltcsignals
Litecoin Faces Resistance at $92.32 Amid Overbought SignalsFenzoFx—Litecoin is overbought as price nears resistance at $92.32. Stochastic reads 91.0, suggesting an overbought market. If LTC stays below $92.32, a bearish wave may emerge, targeting $88.47 support.
However, a close above $92.32 could trigger a bullish move toward the $100.0 mark, reinforcing the upward trend.

Overbought LTC Faces Pressure at $85.0 BarrierLitecoin is building liquidity near $85.0, a strong resistance backed by volume, with Stochastic at 92.0 indicating short-term overbought conditions.
If LTC dips below $83.86, a bearish wave may follow toward $82.33 and $79.51. Conversely, a close above $87.99 could resume the uptrend toward $88.98.

#LTC (SPOT) IN ( 86.00- 103.00) T.(240.00) SL(81.54)BINANCE:LTCUSDT
#LTC / USDT
Entry ( 86.00- 103.00)
SL 1D close below 81.54
T1 199.00
T2 240.00
______________________________________________________________
Golden Advices.
********************
* collect the coin slowly in the entry range.
* Please calculate your losses before the entry.
* Do not enter any trade you find it not suitable for you.
* No FOMO - No Rush , it is a long journey.
Useful Tags.
****************
My total posts
www.tradingview.com
**********************************************************************************************
#Manta #OMNI #DYM #AI #IO #XAI #ACE #NFP #RAD #WLD #ORDI #BLUR #SUI #VOXEL #AEVO #VITE #APE #RDNT #FLUX #NMR #VANRY #TRB #HBAR #DGB #XEC #ERN #ALT #IO #ACA #HIVE #ASTR #ARDR #PIXEL #LTO #AERGO #SCRT #ATA #HOOK #FLOW #KSM #HFT #MINA #DATA #SC #JOE #RDNT #IQ #CFX #BICO #CTSI #KMD #FXS #DEGO #FORTH #AST #PORTAL #CYBER #RIF #ENJ #ZIL #APT #GALA #STEEM #ONE #LINK #NTRN #COTI #RENDER #ICX #IMX #ALICE #PYR #PORTAL #GRT #GMT #IDEX #NEAR #ICP #ETH #QTUM #VET #QNT #API3 #BURGER #MOVR #SKL #BAND #ETHFI #SAND #IOTX #T #GTC #PDA #GMX #REZ #DUSK #BNX #SPELL #POWR #JOE #TIA #TFUEL #HOT #AVAX #WAXP #OGN #AXS #GALA #ONE #SYS #SCRT #DGB #LIT #QI #FIL #GLMR #ATOM #LTC

#LTC/USDT SPOT LONG ENTRY#LTC/USDT SPOT LONG ENTRY
Leverage: 1x
Entries: $101.85
Take profit 1: $103.60
Take profit 2: $109.05
Take profit 3: $116.76
Stop Loss: $96.84
NOTE: This is just my prediction. Be sure to use STOPLOSS and remember that I am not a financial adviser. your money, your risk!
BINANCE:LTCUSD.P
Thanks
The sroced.

Will Litecoin be the next to break up?
The launch of the Bitcoin spot ETF has ignited a wave of optimism in the crypto market, leading many coins to surpass crucial resistance levels.
However, COINBASE:LTCUSD lags behind, still trading at 75, below a significant resistance level. On a positive note, following the recent low in October, November 22 brings a higher low. Moreover, with the coin positioned precisely at the resistance level mentioned earlier, a breakthrough at this point could expedite gains and propel Litecoin into a catch-up rally.
I am currently awaiting confirmation for a buy signal, and in such an instance, my target would be the 100 key zone.

LTCUSD Buy/LongLTC/USD futures is currently sitting upon on support.
Support shows its current stability can rise towards $104.68
LTCUSD
BUY/LONG
Entry: $63.63
Stop Loss: $58.84
Targets:
TP 1: $84.63
TP 2: $104.68
SWING TRADE
Risk: 2-5% of Capital

LITECOIN is rallying and can reach $250 based on this fractal.Litecoin (LTCUSD) is rebounding on its 3D MA50 (blue trend-line) towards the 3D MA200 (orange trend-line). If it breaks above the Bear Cycle Lower Highs trend-line (dashed line), then it might imitate the October 2020 rally. So far the two sequences are fairly similar, even on MACD terms. A break-out rally similar to Oct 2020 can hit the 0.786 Fibonacci extension and print $250.00
-------------------------------------------------------------------------------
** Please LIKE 👍, FOLLOW ✅, SHARE 🙌 and COMMENT ✍ if you enjoy this idea! Also share your ideas and charts in the comments section below! **
-------------------------------------------------------------------------------
💸💸💸💸💸💸
👇 👇 👇 👇 👇 👇

LITECOIN Analysis and Trade Idea💸 #Analysis #Trade 💸
📊 #LTC 1H-45min_
In one hour's time, it is on a static surface (SR) that according to the number of collisions, there is a possibility of failure of this region from the RTM-style point of view. For the trident on that cryptocurrency to act this way, it will be activated by the Order Lifetime targets will be updated.
➖➖➖➖➖➖➖➖
📗Order Type: Buy Limit (Not Active Yet)
🟡Ep 1=95.50$
🟡Ep 2=94.50$
⛔️Stop>93.50$
➖➖➖➖➖➖➖➖
📕Order Type: Sell Limit
🟡Ep 1=104.50$
🟡Ep 2=106.50$
⛔️Stop> 108$
➖➖➖➖➖➖➖➖
📊Powered By Smart Money Concept+Volume profile
🆚Risk/Reward Ratio:10
➖➖➖➖➖➖➖➖
👤 Analysis By Master_Of_Trades🦅
📅 2.19.2023
📫Get Free Access to Premium «Analysis + Trading Signals»

LTCLooks like we start the B wave up here. Then back to $170 to finish Wave C and complete the Zig Zag correction

LTCUSD support and resistance by volume profile 4 hour grafNow we are in strong support 200$ it is very probably go up around 230$ and more.
230$ first take profit.

Litecoin Rally starts December 9th 2021In my previous TA we caught that rally breaking from 200 to 300 , have a look below.
Now Litecoin is setting up for an even bigger move , this next one could be more explosive than the last taking it to all time high.
So right now price is hovering under the 8/1 Gann ratio, we failed to close any daily above it since its breakout and until we do break at 8/1 ratio and close a daily above we will not see an all time high. So the question is when does it break it?
Sometime in the next 30 days the 8/1 Gann ratio comes into a squeeze by December 15th 2021 and we have a very interesting Fib Time date on the 9th Dec 2021.
Fib Time Dates :
10th May 2021
20th July 2021
29th September 2021
9th December 2021
30th April 2022
These are very interesting sets of dates for a number of reasons , first of all the after placing the first two dates we get an impulse on the third which is a very good sign and increases the probability that we will get a reaction in the next two dates. So the next date is 9th of December 2021 that could very well be the date that Litecoin breaks the 8/1 ,I can see the price coming back down to 224 to the 0.382 Fib before we break 8/1.
Out of all these Fib dates the most important one is the 30th April 2022 , time and time again I keep getting Fib dates around this time. Chainlink, Alt Coin Market cap and many more seem to get Fib dates around May 2022, is it possible that Bitcoin tops out end of April and then 20-25 days later the Alt coin market tops out, if you look at 2017 top Alt coin market topped out 28 days after Bitcoin and even this year when Bitcoin hit 65k and topped out in April guess what alt coin market topped out 21 days later so if history does repeat Bitcoin/Litecoin cycle peak could be at the end of april 2022 with a altcoin market peak May 2022, I will link below previous TAs showing these Fib Dates.

LTCUSD support and resistance zoneNow you can see my S/R zones by volume profile
It will be very interesting zone 162 - 155$. LTC here can be go up to resistance zone 180-190$ and after that go up 200+$


what is the next move for litecoin ?! what is the next move for litecoin ?!
multi-timeframe analysis -- the complete analysis for litecoin
that shows you the historical levels that we must respect
searching for the best opportunities with the lowest risk
#eg_einance

LTC/USD support and resistance buy signalsHi, now you can see two support zones.
First support zone - 255 - 247$ here I have buy limit. If LTC go down, use other buy limit
Second support zone - 223 - 212$ here I have buy limit.
Take profit is around 330$


LTCUSD support and resistance by volume profile and trend lineHi, here you go my D1 idea, by volume profile.
______Check my other ideas and my profile status_____

LTCUSD long signalNow we are in support zone by volume profile. Same situation as last ltc idea. We can go more down, so you have to buy for parts.
Check my other ideas, and my proffile. I will be happy for your support :)
Support zone - 196 - 190

LTC/USD - Moon or DoomAt an important level, if we can reclaim 55.50ish on weekly I'll look for swings.

$LTC long signalsas you see we have long signals for LTCBTC.
the stop-loss for this call is once we got short signals from our indicators

LTCUSD Did Litecoin bottom?Litecoin just broke above the Lower High trend line that started with the June 2019 top. Is this a Bottom and thus a long term bullish sign?
Well a quick comparison with the Dec 2018 - Jan 2019 bottom sequence shows that when the long term Lower High trend line (dashed) breaks, the Bottom is in. The RSI sequences of the two periods is also similar. So what I am expecting is a pull back to LTC's high volatility zone in order to gather up some more buying momentum and then an even stronger rebound towards the 1W Resistance. $64.000 seems like a good first Target for long term traders.

LTCUSD Buy SignalPattern: Channel Down on 1D.
Signal: Bullish as the pattern broke upwards (Lower High line) on an RSI bullish divergence.
Target: 110.00 - 120.00.
