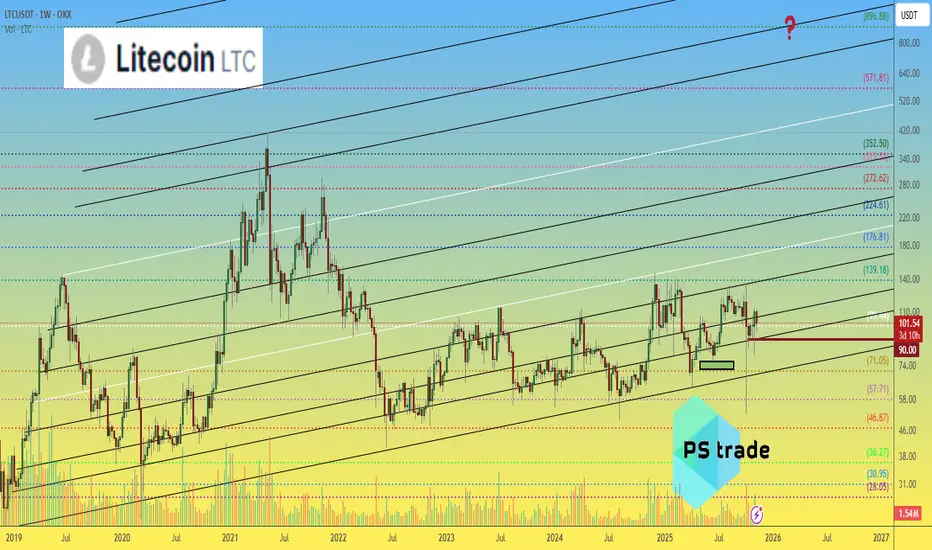
Litecoin Halving Cheat Sheet 2026-2027This Litecoin chart shows a recurring halving-cycle structure where accumulation precedes halving events and distribution follows them.
Logical breakdown:
Green zones – pre-halving bottoms:
Across prior cycles (2015, 2019, 2023), Litecoin formed major price bases 6–18 months before each halving, marked here in green. These zones align with low volatility, depressed sentiment, and long-term buyers stepping in.
Orange zones – late-cycle risk:
Orange bands appear as price accelerates toward the halving. Historically, this phase shows increased momentum but deteriorating risk–reward, with price often extended relative to the long-term trend channel.
Red zones – halving/top events:
Red bands coincide with the halving itself or shortly after. In every observed cycle, Litecoin topped either into or just after the halving, followed by multi-month drawdowns of roughly 60–80% (2015–2016, 2019–2020, 2023–2024).
PStructure context:
The broader ascending channel suggests long-term growth, but cycle timing has mattered more than trend direction for intermediate-term returns.
If the historical pattern holds, green zones favour accumulation, while orange-to-red zones favour caution, risk reduction, or profit-taking rather than fresh long exposure.
LTCUSDT

LTCUSDT 1,290% profits potential 5X leverage —LONG tradeLitecoin looks very tricky right now but also good, tricky and good. The action has been happening within a long long-term ascending channel. The previous bear market bottom came up June 2022. No new lows after this date.
The last major peak happened December 2024 and the most recent low, the market flush, October 2025. Last week we have a higher low.
Why should we expect a reversal here, now? Because the lower low last week has less volume compared to the market flush. This signal alone reveals the bearish trend being over. Actually, the current bearish move is already over-extended.
Advanced traders took advantage of the fact that many people have strong expectations for Litecoin in the coming years. Thus the over-extended correction. Yes, the market will turn but when? Experienced traders take advantage of this doubt to profit from over leveraged and impatient traders. Focus on the long-term.
This chart doesn't reveal much but we go based on marketwide action. We are going up next.
Needless to say, Ethereum is now trading back above $3,000 and Bitcoin is about to hit $90,000. The retrace is over; the resumption of the bullish period, the relief rally for Bitcoin, the bull run for the altcoins.
Full trade-numbers below:
_____
LONG LTCUSDT
Leverage: 5X
Potential: 1290%
Allocation: 5%
Entry zone: $65 - $72
Targets:
1) $84
2) $96
3) $116
4) $129
5) $145
6) $173
7) $197
8) $228
9) $251
Stop: Close monthly below $63
_____
Thank you for reading.
Namaste.

LTC/USDT 30M Short-Term📊 1) Market Structure (Price Action)
The market is consolidating/accumulating between ~67.2 and ~70.1.
Previously, there was a strong decline, then range trading with false breakouts.
Currently, the price has rebounded from the ~66 low and is making a higher low → short-term bullish.
👉 This looks like a retest of the range bottom → a push to the middle of the range.
🧱 2) Key Levels (Your lines are well marked)
🔴 Support Levels
67.20 – the most important local support (range low).
64.89 – a strong swing low (if 67 breaks → decline here).
63.14 – the bulls' last defense.
🟢 Resistance
69.37 – mid-range, local S/R flip.
70.11 – key range high.
71.60 – strong HTF resistance (if it breaks 70 → target).
📈 3) Trend (moving average)
The green MA (probably the 200 EMA/SMA) has been acting as dynamic resistance previously, and now the price is starting to hold above it → bullish short-term.
Structure:
low → higher low → test resistance = breakout potential.
⚡ 4) RSI + Stoch RSI
RSI (lower panel)
RSI ~55–60 → bullish momentum (above 50).
No overbought → room for further upward movement.
Stoch RSI (middle panel)
Oscillates, but not to an extreme → no dump signal.
If it crosses upwards >80 → a scalp short signal (at 30m).
🧠 5) Scenarios (most important)
🟢 BULLISH SCENARIO
Condition:
Close of the 30m candle above 69.40
Targets:
70.11
71.60
73+ (if a breakout range on HTF)
👉 This will be a consolidation breakout → an impulsive move.
🔴 BEARISH SCENARIO
Condition:
Rejection of 69.4 + return to below 67.9
Targets:
67.20
64.89
63.14
👉 This will be a classic range fake breakout → dump to the lower zone.
🧨 6) What do I see as smart money?
A liquidity grab above 69.5–70 is very likely, followed by a dump.
Market makers like to:
break resistance
collect longs
dump to range low
💰 7) Trading setup (pro)
📌 LONG scalp
Entry: 69.4 breakout retest
SL: 68.8
TP1: 70.1
TP2: 71.6
📌 SHORT swing (better R:R)
Entry: 70–71 rejection
SL: 71.8
TP1: 67.2
TP2: 64.9

LTCUSD | Reality Check — Liquidity Hasn’t Been TakenHello traders,
I’m not bullish on LTC yet. You shouldn't be either.
1W TF for LTC is still as bearish as it gets. Massive stop loss orders for buyers are setting below $63.
The structure is clear: before any real bullish expansion, sell-side liquidity must be swept.
This historical uptrend is where long-term positioning gets reset. Every strong run LTC ever had came after price touched that line, shook out weak hands, and re-accumulated.
Remember this period (Q4, 2026)
📍 Levels I’m watching
Buy zone (sell-side sweep):
$63 – $50
This is where I’ll be interested, not before.
Sell targets (buy-side liquidity):
$136 - $147
From now on during 2026 bearish market, any price up will be a reset chance.
Good Luck!
If you find this useful, hit a like, drop a comment and follow for more

And Yes the whales are buyingThis market volatility over the last few weeks might be an attempt to shake out the weak holders.
If price moves out of the smaller micro range (as illustrated) and pushes back in and breaks structure bullish, this would be a buy signal for me.
**The trade only happens if these conditions are met.
Keep your eye on the market and respond when it shows.
Happy Trading.

LTC global trend. Ascending channel. Triangle. January 2026Logarithm. 1-month time frame. Linear chart without market noise. Designed for visual understanding of long-term trend direction.

The start of something great is brewingLitecoin is showing clear signs of an automatic rally. This is the things you look for if the price moves lower.
1. One or Two breaks below the current low with the price bouncing back into the range after every low, this is a clear sign of accumulation.
2. Price moving to the top of the range after the spring has formed.
So I will only be bullish after I see the accumulation pattern play out.
Trade safe

LTC is in a clear downward trend📉 MARKET STRUCTURE
Main Trend: Down
Sequence: Lower High → Lower Low
Price is moving in a clear downward channel.
Any upward breakout = correction, not a trend change.
📐 KEY LEVELS
🟩 RESISTANCES (sell zones)
84.50 – current S/R flip (was support → now resistance)
94.50 – strong HTF level, where the market has been rejected multiple times
107.50 – key trend reversal level (BOS)
🟥 SUPPORT
72.00–72.50 – key support, currently being tested
63.10 – next strong HTF support
Below → empty space to ~55–58
🔎 PRICE ACTION – WHAT YOU CAN SEE
Recent Bounce:
Weak HH
No volume
Strong rejection from:
Upper channel line
Level ~84.5
Current candle:
Aggressive supply
No demand response
👉 Sellers in full control
📊 STOCH RSI
Turnover from the upper zones
Bearish momentum
No bullish divergence
👉 Oscillator confirms continuation of the downtrend
🧠 SCENARIOS
🔴 BASELINE SCENARIO (60–65%)
Descent lower
Condition:
Close D1 below 72
Target:
63.1
Possible breakout to 60–61
🟡 CORRECTIVE SCENARIO (25–30%)
Bounce Technical
Condition:
Holding 72
Demand candle + follow-up
Target:
84.5
Maximum 94.5
DOES NOT change the trend
🟢 TREND REVERSE SCENARIO (<10%)
Condition:
Close D1 > 94.5
Then reclaim 107.5
👉 Only then can we talk about a bull market
🎯 HOW TO PLAY IT (technically)
Short:
Retest 84–85 or 94–95
SL: above the structure
TP: 72 → 63
Long:
Only a reaction to 63
Short-term scalp / swing
No forcing the low

Litecoin LTC price analysis📉 For weeks, OKX:LTCUSDT has been holding strong
And guess what — this consolidation has lasted over 3.5 years! 😮
💭 The last real pump was back in early 2021... feels like it’s time for a sequel, right? 😉
Now, here’s the interesting part:
🔹 Litecoin has the same tokenomics and mining method as Bitcoin ( CRYPTOCAP:BTC ) and
🔹 Recently, another “old school” coin — CRYPTOCAP:ZEC — just pumped hard 💥
🔹 And there are rumors about a potential LTC ETF 😏
With a current market cap of only $7.7B, there’s plenty of room to grow.
So maybe... just maybe... CRYPTOCAP:LTC at $900 isn’t that crazy after all? 🚀
What do you think — are we on the verge of a new #Litecoin era? 👇
______________
◆ Follow us ❤️ for daily crypto insights & updates!
🚀 Don’t miss out on important market moves
🧠 DYOR | This is not financial advice, just thinking out loud
#LTC/USDT analysis.Give me some energy !!!#LTC
The price is moving within a descending channel on the hourly timeframe. It has reached the lower boundary and is heading towards a breakout, with a retest of the upper boundary expected.
The Relative Strength Index (RSI) is showing a downward trend, approaching the lower boundary, and an upward bounce is anticipated.
There is a key support zone in green at 75.00, and the price has bounced from this level several times and is expected to bounce again.
The indicator is showing a trend towards consolidation above the 100-period moving average, which we are approaching, supporting the upward move.
Entry Price: 78.30
First Target: 79.40
Second Target: 81.45
Third Target: 83.86
Stop Loss: Below the green support zone.
Remember this simple thing: Money management.
For any questions, please leave a comment.
Thank you.

LTCUSDT - Symmetrical Triangle: Breakout or Breakdown?Litecoin (LTC/USDT) on the Weekly (1W) timeframe is currently in a long-term consolidation phase following a major decline from its previous cycle high. Price action is becoming increasingly compressed and is now approaching the apex of a large structure, signaling an upcoming major directional move.
The current price is trading around $82–85, positioned near the middle of the triangle, which represents a critical decision zone for the market.
---
Pattern Explanation
The chart is forming a large Symmetrical Triangle, characterized by:
Lower highs → descending resistance (upper yellow trendline)
Higher lows → ascending support (lower yellow trendline)
Pattern structure developing from 2022 through early 2026
Gradually declining volume → a typical sign of market compression before a breakout
A Symmetrical Triangle is a neutral continuation pattern, meaning the next major move will be determined by a confirmed breakout or breakdown.
---
Key Levels
Major Resistance Levels:
$95 – $100 → minor resistance / mid-range area
$120 → strong historical resistance
$134 → major supply zone
$281 → long-term major resistance / macro target
Major Support Levels:
$82 – $80 → current support zone
$63 → structural support
$40 → swing low / extreme downside support
---
Bullish Scenario
The bullish scenario will be confirmed if:
1. Price breaks above the descending trendline
2. A weekly close above resistance, supported by increasing volume
Bullish Targets (Step-by-Step):
$95 – $100 (initial target)
$120 – $134 (major distribution zone)
$180 – $280 (measured move of the triangle if bullish continuation occurs)
A confirmed breakout could mark the start of a new medium- to long-term uptrend.
---
Bearish Scenario
The bearish scenario becomes valid if:
1. Price fails to break resistance
2. A weekly close below the ascending support trendline
Bearish Targets (Step-by-Step):
$63 → key support
$40 → historical lower boundary
A breakdown from this structure would suggest a continuation of bearish or prolonged sideways conditions.
---
Conclusion
LTC is currently trading within a major decision zone on the weekly timeframe.
Traders and investors are advised to wait for clear confirmation, rather than anticipating direction inside the triangle.
➡ Breakout = potential start of a new bullish trend
➡ Breakdown = risk of further downside or extended consolidation
Patience is crucial during high-compression market phases like this.
---
#LTCUSDT #Litecoin #Altcoin #CryptoMarket
#CryptoAnalysis #AltcoinAnalysis #WeeklyChart
#SymmetricalTriangle #TrianglePattern #TriangleBreakout

LTC/USDT 1D Chart 🔎 Market Structure
The market is in a downtrend (a series of lower highs and lower lows).
The price is moving within a descending channel (black lines).
The recent move is a rebound from the lower demand zones, but the trend has not yet been broken.
📉 Trend & Price Action
The main downtrend line has not been broken – the price has reached it and is reacting.
The current move looks like a pullback/upward correction, not a trend reversal.
No clear higher high → the structure remains bearish.
🟢 Key Levels
Resistance (sell zones)
86.84 USDT – local resistance (currently being tested)
95.83 USDT – strong structural resistance
103.54 USDT – previous downside base
110.66 USDT – very strong resistance (key to trend reversal)
Support (buy zones)
78.67 USDT – local support
72.25 USDT – strong demand zone
63.14 USDT – critical support (channel bottom)
📊 Indicators
Stochastic RSI
Currently in the overbought zone (>80)
Historically, on this chart, → often ends in a correction
Signal: watch out for shorts / profit-taking
CHOP Index
High → market was in consolidation
Recent CHOP breakout down → possible impulse but not yet confirmed by volume
🧠 Scenarios
🔴 Baseline scenario (more likely)
Rejection at 86–88 USDT
Return to around 78.67 → 72.25
Continuation of the downtrend
🟢 Alternative scenario (bullish, conditional)
Daily close above 95.83
Then a breakout of 103.54
Only 110.66 = a real trend change to up
🎯 Final conclusion
This is a correction in a downtrend, not a trend reversal.
Shorts are logical under resistance
Longs are only short-term/scalp
Swing longs only after a breakout of 103–110

LTC/USDT | Retesting incoming (READ THE CAPTION)As you can see in the 2h chart of LTCUSDT, it made it out of the FVG last night and gone up as high as 84.57, sweeping the BSL there, but it returned to the FVG and it is now being traded at 83.10. I expect Litecoin to to retest the high of the FVG again and then go on to sweep the liquidity above the 84.57 level.
Targets for LTCUSDT: 83.50, 84, 84.5 and 85.

LTC/USDT | Will it continue to go higher? (READ THE CAPTION)As you can see in the 2H chart of LTCUSDT, it got in the FVG zone, but failed to stay there and it is now below the low of the FVG, being traded at 82.10.
I don't expect it to go lower, rather want it to go and retest the FVG zone and maybe even breaking through it.
Should it fail to go higher and drops further, I would want a reaction to the Bullish Breaker.
Targets for Litecoin: 82.80, 83.40, 84 and 84.60.

LTCUSDT | Bullish run continues? (READ THE CAPTION)In the 2H chart of LTCUSDT, we can see that Litecoin has been on a bullish run in the past couple of days, going from 76.08 all the way to 82.82, and after hitting the FVG, it has dropped in price to 81.50 and is being traded there.
If it drops further, I expect a reaction to the Bullish Breaker. Otherwise, I expect it to challenge the FVG yet again.
Bearish Targets: 81, 80.60, 80.20 and 79.80.
Bullish Targets: 82, 82.40, 82.80 and 83.20.

LTCUSDT Bullish Structure – Is This the Next Expansion Leg?📊 LTC/USDT "DIGITAL SILVER" BULLISH BREAKOUT 🚀 | Swing Trade Profit Setup
🎯 TRADE OVERVIEW
Asset: Litecoin vs Tether (LTC/USDT)
Timeframe: 4H / Daily
Current Price: $77.32 USDT
Strategy Type: Swing Trade (Bullish Recovery)
Market Condition: Oversold with Bullish Divergence ⚡
Fear & Greed Index: 21 (Extreme Fear) 👻 = BUY OPPORTUNITY
📈 TECHNICAL CONFIRMATION (Real Market Data - Jan 2, 2026)
✅ 200-Day Simple Moving Average: $99.38 USDT (Strong Resistance Zone)
✅ 50-Day SMA: $83.76 USDT (Critical Breakout Level)
✅ 20-Day SMA: $78.90 USDT (Current Support)
✅ MACD Histogram: +0.3048 (BULLISH DIVERGENCE FORMING) 🔥
✅ RSI (14): 43.16 (Neutral - Room for Upside Movement)
✅ 24H Volume: $14.9M - $273.6M (Healthy Liquidity)
✅ Bollinger Bands: Mid-band at $80.74 (Target Zone)
🎪 ENTRY STRATEGY: "LAYERING METHOD" (Thief OG Style)
Entry Approach: Multiple Limit Orders / Scale-In Method
Layer 1️⃣ (Accumulation Zone)
Entry Point: $76.00 - $76.50 USDT
Risk Reward: Solid Foundation Builder
Size: 35% of position
Layer 2️⃣ (Breakout Confirmation)
Entry Point: $78.00 - $78.50 USDT
Risk Reward: Post-Consolidation Entry
Size: 35% of position
Layer 3️⃣ (Momentum Confirmation)
Entry Point: $80.00 - $81.00 USDT
Risk Reward: Strong Momentum Signal
Size: 30% of position
💡 PRO TIP: Scale into positions gradually. This reduces panic selling and locks in better average entry prices during volatility.
🛑 STOP LOSS PLACEMENT (Risk Management is KING 👑)
Recommended Stop Loss: $74.00 USDT
Hard SL Breakdown: $72.64 USDT (Technical Support)
Emergency SL: $70.00 USDT (Psychological Level)
Risk Calculation:
From Entry at $78.00 → SL at $74.00 = 5.1% Risk Per Trade
Position Size = 1-2% of Portfolio Risk (Suggested)
⚠️ IMPORTANT DISCLAIMER: This is YOUR decision. Adjust SL based on YOUR risk tolerance and account size. Never risk more than you can afford to lose!
🎯 PROFIT TARGETS (Cascading Exit Strategy)
🥉 Target 1 (Initial Profit Take) - 50% Position
TP1: $82.00 - $84.59 USDT
Gain: +5% to +8.3% from entry
Action: Lock in early profits, reduce risk to zero
🥈 Target 2 (Mid-Range Resistance) - 30% Position
TP2: $87.00 - $88.00 USDT (Key Analyst Consensus)
Gain: +11.5% to +12.8% from entry
Action: Trail stop-loss to breakeven
🥇 Target 3 (Major Resistance Break) - 20% Position
TP3: $95.00 - $100.00 USDT (Extended Target)
Gain: +21.8% to +28% from entry
Action: Ride momentum with trailing stop
🚀 STRETCH TARGET (Q1 2026)
Extended Target: $113.71 - $115.00 USDT
Gain: +45% to +47.2%
Condition: Sustained break above $87 with volume confirmation
⚠️ IMPORTANT DISCLAIMER: TP targets are based on technical analysis. Market conditions change. Your profit-taking strategy is YOUR choice. Manage position size wisely!
📊 TECHNICAL ANALYSIS BREAKDOWN
Bullish Signals 🟢
✅ MACD Histogram turning positive (Early momentum shift)
✅ Price above 7-day & 20-day SMA (Short-term uptrend)
✅ RSI in neutral zone (Not overbought = room to run)
✅ Recent consolidation at $74.66 support (Buyers defending)
✅ Oversold conditions (Often precede reversals)
✅ 24H Change: +3.29% (Momentum building)
Bearish Headwinds ⚠️
🔴 Price below 50-day SMA ($83.76) - Medium-term bearish
🔴 Price below 200-day SMA ($99.38) - Long-term bearish
🔴 Weekly Technical Rating: SELL (Mixed signals persist)
🔴 Volatility: 1.91% (Potential sharp moves both directions)
Verdict: Mixed setup = Wait for confirmation before scaling in!
🔗 CORRELATED PAIRS TO MONITOR
Direct Correlation 0.58-0.76
BTC/USDT (Bitcoin) 🔗
Correlation: 0.76 (Very High)
Why Important: LTC follows BTC dominance closely
Action: Monitor BTC chart for macro direction
Current BTC: Trading sideways (Neutral Signal for LTC)
Related Altcoins to Watch 📍
ETH/USDT (Ethereum) 📊
Correlation: 0.559 (Moderate-High)
Significance: Broader altcoin momentum
DOGE/USDT (Dogecoin) 🐕
LTC Weekly Correlation: +0.472
Signal: When alts pump together, LTC often leads
SEI, RENDER, DASH (Sector Leaders) ⭐
7-Day Correlation: +0.50-0.60
Importance: Monitor these for LTC breakout confirmation
💼 FUNDAMENTAL & MACRO FACTORS AFFECTING LTC (Jan 2026)
BULLISH CATALYSTS 🟢
1️⃣ LitecoinVM Layer-2 Launch (Q1 2026 Mainnet)
Status: Testnet Active (Dec 25, 2025)
Impact: Transforms LTC from "Digital Silver" → Programmable Web3 Hub
Details: EVM-compatible smart contracts via Polygon CDK
Significance: Attracts DeFi developers, increases utility
Timeline: Mainnet expected Q1 2026 (Could trigger rally)
2️⃣ MWEB Privacy Upgrade Adoption
Current Status: 90%+ of nodes validating MimbleWimble transactions
Volume Locked: 245,000+ LTC in private transactions
Impact: Enhanced fungibility without sacrificing speed
Implication: Increased demand from privacy-conscious users
3️⃣ Spot ETF Approval Prospects
Status: 3 US ETFs Under SEC Review (Grayscale, Canary, CoinShares)
Approval Odds: 68-90% by end-2025/early-2026
Potential Inflows: $400M-$500M if approved
Historical Precedent: Bitcoin ETF approval drove massive rallies
4️⃣ Institutional Accumulation
Latest Data: Lite Strategy (NASDAQ: LITS) holds 929,548 LTC (~$73M)
Signal: Corporate treasuries adding LTC like Bitcoin playbook
Market Impact: Reduces available supply for retail
5️⃣ Block Reward Halving Cycle ⏰
Last Halving: August 2023
Next Halving: 2027 (Scarcity narrative building)
Max Supply: 84 Million LTC (Fixed cap = deflationary)
BEARISH RISKS 🔴
⚠️ Binance Delisting Alert
Issue: 7 LTC margin pairs delisting Jan 6, 2026
Impact: Reduced leverage trading volume
Severity: Moderate (Spot trading unaffected)
⚠️ BTC Dominance at 59%
Concern: High BTC dominance leaves less capital for altcoins
Watch Level: If BTC dominance drops below 55% = Altcoin season
Current Status: Neutral-bearish for LTC
⚠️ Regulatory Uncertainty
MWEB Privacy Risk: Increased privacy use may attract regulatory scrutiny
Impact: Potential compliance challenges ahead
⚠️ Economic Data Releases
Upcoming: Fed Policy (Jan 29), Unemployment (Feb 7)
Risk: Hawkish signals could trigger broad crypto selloff
Monitor: Fed futures market for rate probability changes
🎬 ACTION PLAN FOR TRADERS
Before Entry ✅
Confirm support holding above $74.66
Wait for MACD histogram to cross above signal line
Check BTC chart for macro direction (critical!)
Scan news for ETF announcements or LitVM updates
During Entry 📍
Scale in using layer method (Don't FOMO all-in)
Set stop-loss FIRST before market order
Use limit orders for better entry prices
Document your entry prices for reference
After Entry 🚀
Take 50% profit at $82-84 level
Move stop to breakeven ($78.00)
Trail stop on remaining position
Monitor related pairs (BTC, ETH, DOGE) for confluence
Watch for ETF approval news (Major catalyst!)
Exit Strategy 🏁
Never hold through major economic news without reason
If LitVM news is negative = exit immediately
If BTC breaks below $85K = reduce position
Q1 2026 ETF decision = major milestone target
📌 KEY LEVELS SUMMARY (Cheat Sheet)
RESISTANCE ZONES:
🔴 $100.00 ← Psychological + Long-term target
🟠 $95.00 ← Analyst consensus (Short-term TP)
🟠 $87.00 ← Major resistance zone
🟡 $84.59 ← Immediate breakout level
🟡 $82.00 ← First profit-taking zone
CURRENT PRICE: $77.32 USDT
SUPPORT ZONES:
🟢 $76.00 ← Layer entry zone
🟢 $74.66 ← Critical support (Hard stop here!)
🔵 $72.64 ← Emergency support level
⚖️ RISK ASSESSMENT & DISCLOSURE
Trade Confidence Level: MEDIUM (60%)
Key Risk: Depends on support holding + BTC correlation
Reward Potential: +21-47% (Medium-term)
Volatility Expected: Moderate to High
🎓 FOR LEARNERS
Study: Litecoin's correlation with Bitcoin (0.76)
Practice: Identify support/resistance zones on your charts
Remember: Technical analysis is probability, not certainty
Execute: Small position sizes while building skill
Improve: Keep a trading journal for every decision
Good luck Thief OG's! Remember: "The best trade is the one where you keep your capital." 💰

LTC/USDT | Up or down? (READ THE CAPTION)By examining the 2H chart of LTCUSDT, we can see that after sweeping initial SellSide Liquidity, it started an upwards move, currently being traded at 77.55.
There are relative equal lows below the current zone LTCUSDT is being traded, I expect it to eventually drop there and sweep the liquidity there and then start another upwards move.
Current bullish targets for LTCUSDT: 78, 79.3 and 80.50.
Bearish Targets: 76.60, 75.40 and 74.30.

Movement comparisonBitcoin and Monero have approximately the same amount of coins in circulation. Bitcoin has an average of 500,000 transactions daily, while Monero has around 20,000. The Monero ownership centralization is obvious, but not provable.
The two assets have significantly opposite price movement.
The LTCBTC/XMRBTC pair is at the channel top.
The XMRUSD/LTCUSD is retesting long-term support.
The channel has been violated, which possibly means a strong corrective wave in the opposite direction is coming. LTCBTC pair isn't looking great for now, but LTCUSD has been in slow upside movement with quite high usage for payments. The upcoming LitVM hype might have impact on the price, and will be produced by Lunar Digital Assets company in deal with Bitcoin OS and Litecoin Foundation. The LDA is a marketing company and they have made a lot of damage through previous projects thus exercise extreme caution.
The BTCUSD is searching for support on 1W and appears to be completing Elliot five wave impulse, and forming a running flat.
The XMRBTC is at strong long-term resistance, the BTCUSD has more momentum for breakout while grinding at the channel top, and taking under consideration the BTCUSD and XMRBTC are inversed, the BTCUSD seems a better choice for investment at this moment.
However, XMRUSD does seem like it could get a correction, but in smaller magnitude than XMRBTC, thus the XMRUSD price might stay elevated for the period while BTCUSD is in bullish rally.
Furthermore, the BTCUSD versus GOLD is also finding significant support. Countries and private companies are holding the BTCUSD positions. It is possible that in this year people will realize it is easier to keep safe and spend Bitcoin rather than physical gold. Gold appears to be a fear hedge, around 50% of yearly mined gold being used for production of jewelry while around 10% used in electronics production. Silver appreciation is fair. The world will continue further into finance digitalization. Production of physical goods should also get more appreciation in the following years.
Opinion - Good time to move XMR to BTC, even though XMR might make another leg, but less likely.

LTC/USDT — Falling Wedge Formation Signals Potential ReversalOn the 8-hour timeframe, Litecoin (LTC) remains in an overall downtrend. However, the price structure is not moving in parallel lines, indicating that this is not a descending channel. The upper resistance trendline is steeper than the lower support trendline, signaling weakening bearish momentum.
Price is currently trading near the final phase of the pattern, approaching the apex, where a strong directional move (breakout or breakdown) is likely to occur.
---
Pattern & Price Structure
Pattern Identified: Falling Wedge (Bullish Reversal Pattern)
Key characteristics visible on the chart:
Continuous lower highs, forming a sharply declining resistance
Lower lows, but with decreasing downside momentum
Price compression, indicating reduced selling pressure
Non-parallel trendlines, distinguishing it from a descending channel
Technically, a falling wedge forming within a downtrend often precedes a bullish trend reversal, pending confirmation.
---
Key Levels
Support Zones:
80.0 USDT (current reaction zone)
76.0 – 72.6 USDT (major support & pattern invalidation level)
Resistance Zones:
85.8 USDT (near-term resistance)
93.5 – 96.5 USDT (key structural resistance)
104 – 110 USDT (major supply zone)
---
Bullish Scenario
The bullish scenario becomes valid if:
1. Price breaks above the falling wedge resistance
2. An 8H candle closes above 85.8 USDT
3. The market prints a first higher high as confirmation
Bullish Targets:
93.5 – 96.5 USDT
104 USDT
110 USDT (if momentum strengthens)
A confirmed breakout would suggest a shift from bearish control to recovery phase.
---
Bearish Scenario (Pattern Invalidation)
The bearish scenario occurs if:
Price fails to break out from the wedge
76 USDT support is broken with strong volume
Bearish Targets:
72.6 USDT
Extension toward the 70 USDT area if selling pressure accelerates
Such a move would invalidate the falling wedge and confirm bearish continuation.
---
Conclusion
Price action aligns more accurately with a falling wedge
The pattern suggests potential bullish reversal, but:
Confirmation is mandatory
Until a breakout occurs, the dominant trend remains bearish
The optimal approach is to wait for confirmation rather than anticipate.
---
#LTC #Litecoin #LTCUSDT #FallingWedge #BullishReversal #CryptoAnalysis #TechnicalAnalysis #Altcoin #CryptoTrading

LTC/USDT — Market StructureThe resistance block and the channel midline proved too strong — after another test, price moved into a correction.
The $70–95 range is the most heavily traded zone, where position building is taking place.
A bullish wedge is currently forming within this range.
Trade options:
— accumulate inside the pattern with a mandatory stop-loss below it;
— or wait for a confirmed breakout above the wedge’s upper boundary and enter on confirmation.
🎯 Primary targets: $93 and $110.
Long-term targets should be considered only after a sustained break and hold above $150.

Litecoin - Long-Term Bearish Structure, New Cycle Low ExpectedDuring previous bull runs (2017 and 2021) , Litecoin consistently made new all-time highs , breaking above prior peaks. However, an important historical pattern stands out: each bear market formed higher lows , suggesting long-term range compression.
At the current stage, this structure appears to be changing. Price remains in a prolonged consolidation phase, and a bear flag has formed on the monthly timeframe, which is a classic bearish continuation pattern following a strong downside impulse.
Based on the overall market cycle structure and historical behavior, I expect a breakdown below previous bear market lows, with a new cycle bottom forming in the $24–20 range.
Key factors:
Clear bear flag on the 1M timeframe
Lack of a sustained uptrend since the 2021 peak
Weak bullish momentum and distribution structure
Market cycle dynamics
Cycle outlook:
2026 is expected to be a bearish year, potentially marking the final phase of this downtrend and the establishment of a macro bottom.
Invalidation:
A sustained breakout and hold above the upper boundary of the monthly bear flag would invalidate this bearish scenario.
This idea is designed for long-term traders and investors who analyze the market through cycle behavior and macro structure, rather than short-term price fluctuations.

LTCUSDT (4H) chart update !!Litecoin is holding a strong demand zone around 76–80 and moving sideways under a long-term descending trendline.
A confirmed breakout above the trendline (~84) could trigger a bullish move toward 92, then 100, and ultimately 120.
If the price falls below the 76 support, the downside risk remains toward 69.
Bias: Neutral → Bullish on breakout.
DYOR | NFA.

LTC Approaching Key 4H FVG Zone_Reversal Setup AheadLTC is showing clear weakness and continues to drift lower, likely heading toward the 4H FVG zone at $76.2–$77.3. This area will be key for a potential reversal. If price reacts strongly from this zone, a clean recovery move toward the EQH liquidity level at $87.5 is expected. Manage risk wisely and wait for confirmation.
