Lumens

Stellar Lumens Long-term | Weekly Chart Analysis | Over 800%Let's take a look at the Stellar Lumens (XLMBTC) chart long-term, on the weekly time frame...
Let's start with the chart pattern, we can see the classic bullish falling wedge.
XLMBTC is breaking pass the "major trendline" in red. Moving above this level would put XLMBTC above resistance and a new trend can start to take form.
So the market moves in cycles... First, we have a downtrend, the uptrend comes next... How long will it last?
RSI:
The RSI printed the same bullish pattern and hit its lowest point ever, oversold... After a strong bounce, it is showing plenty of room left available for growth (green arrow).
MACD:
The MACD also reached its lowest point ever and is now displaying a bullish cross... Plenty of room available for growth (green arrow).
This is the long-term chart for Stellar Lumens (XLMBTC).
You can see the indicators oversold and sending out strong reversal signals... There are over 800% profits potential to XLM ATH on Binance... Surely, this pair will generate so much more gains/growth in the weeks, months and years to come.
What's your take?
Share your thoughts in the comments section below.
Namaste.

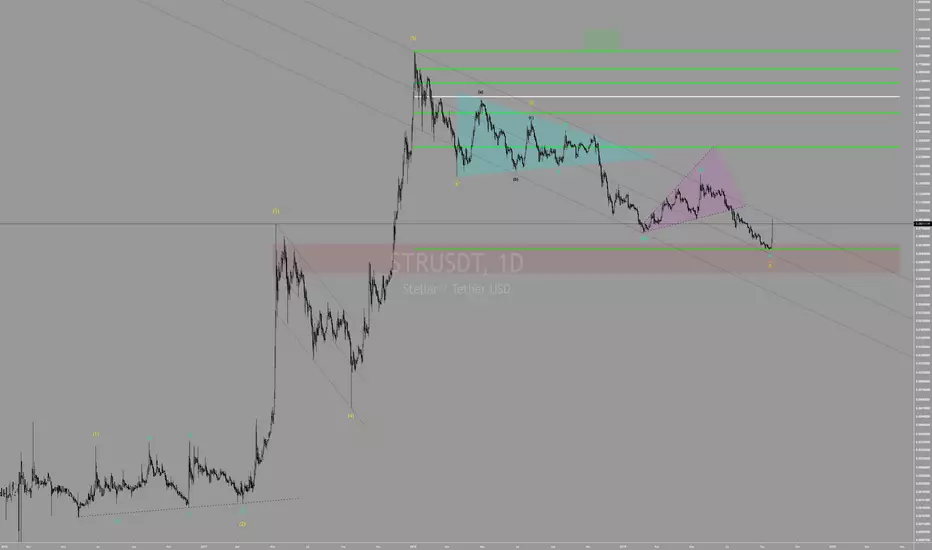
Stellar Lumens Full Chart Analysis | Daily Time-fameWe just looked at Stellar Lumens (XLMBTC) on the weekly time-frame, the long-term chart, now we are going to take a closer look and see what is going on...
Let's start by zooming in on the chart above:
We can see XLMBTC on a very steep decline since November 2018... Stellar never did let go and has been going down since... Only now early reversal signals are starting to show up.
Here we can see a new low being hit (bottom dashed line).
Here can see the volume breakout... We can see volume decreasing and then a sudden jump to print higher volume bars as well as break pass resistance.
The RSI is super strong, over 66.85. This is the highest it has been since March 2019.
If we compare Stellar to other altcoins, we are likely to see some huge growth in the weeks to come... All the details are shared on the chart above.
All the targets are clearly marked... Stellar Lumens is now super bullish.
Thanks a lot for your continued support.
Namaste.
_____________________________
Weekly analysis for Stellar Lumens (XLMBTC)

Stellar Bullish longterm +200% gain PotentialSimilar trend to September 2017. If Stellar can break resistance line we should expect big gains. Looking at the WaveTrend there's a high chance Stellar will Moon.
This is not trading advice, just keeping record of my own ideas to learn.

Stellar - XLM - A new cycle!Been a while since I watch the USD chart of $XLM and I was chocked. It gave back almost all it's yearly gains?!
A new cycle low is a possibility
Could be minor (<0.07093)
Big support at 0.0626
Break outside channel = first bullish warning
WELCOME TO ALTSEASON
We go together
Together we are stronger
Share and like
Thanks
God bless you!


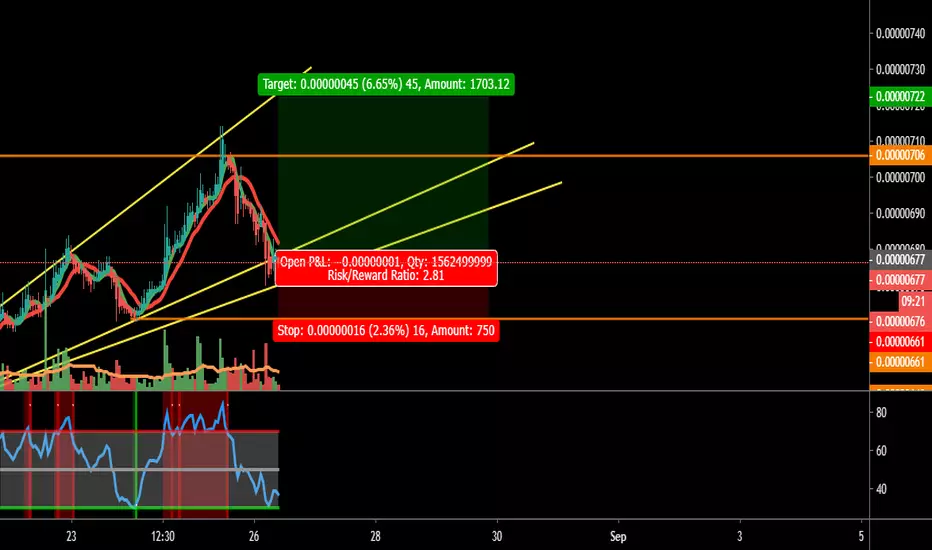
Stellar Scalping Opportunity!!!Short term trade if Bitcoin stables around 10,000$
Risky Trade!!! Sell around 6-8% profit.
Long term falling wedgeStellar has been bouncing within a falling wedge for weeks now. If we see a close above resistance, combined with an uptick in volume, there is high possibility of significant gains.

XLM is a fragile Beast. 24Volume has dropped back to $100 millBeen a couple months since XLM volume sunk to the $100 mill levels seen the last four days. May 1st was the last time it was in the $100 mill range.


#XLM follow up Falling below the support level from the previously formed wedge means that the direction will be down and looking towards the next monthly support level of 720 satoshis. This is a very strong support level and one of the lowest prices in a long time for #XLM. In my opinion it will go and test that support level before recovering to the previous monthly support of 2130 satoshis. Current prices seems to be a good entering point for long term trading. Keep looking at the descending wedge that has been pretty much the driving force of the current move, wait for the next move and break of it before getting aboard.

Xlm/btc About to reverseStellar lumens forming a bottom with bull divergence on rsi, getting ready to reverse the trend. will also perform really good against dolar pair.


Mini alt season incoming!With the juicy marketcap BTC has brought in the markets, we should expect a big contribution towards the alts coins especially while BTC will cool off for a bit. XLM is definitely a great sleeper waiting to unleash some green dildos!. The hammer doji highlighted has a decent wick that will confirm atleast an upcoming 30%+ profit, our STOCH RSI and RSI indicators can show that there it is clearly oversold and there also is a bullish divergence in the RSI.

XLMUSD Linear chart - possibly break pennantIf XLMUSD breaks out of the pennant it would possibly be big gains. But if it drops below the support line it could go back to $0.06 and then correct from that point.
This isn't trading advice. Just saving charts to learn myself.

XLMUSD could potentially break outJust saving this graph to collect ideas and learn. Not trading advice.


Rally time for the Lumen?Broken wedge, followed by a strong sell off. Looks like the market needed to reset before rallying, lets see if history repeats and stellar has a strong rally.

XLM-BTC Long Trade PlanCommodity : STELLAR LUMENS
Trade Type : LONG
Trading Against : BITCOIN
Entries : Double-UP Entries throughout the Buy Zone
Profit Taking : 25% at each TP point.
Profit Locking : Move SL to break even once TP1 is hit, to TP1 once TP2 hits, to TP2 once TP3 hits and so on
Duration - 1-2 weeks

4 Bullish Reasons For Stellar (XLM/BTC)I'll cut to the chase and say that I am bullish for Stellar in the short term.
Reason #1: It is my belief that Stellar found it's bottom and the recent bullish move that followed Bitcoin has only strengthened my opinion on this matter-
Reason #2: Looking at the charts we can see that this is a classic falling wedge formation. d.stockcharts.com
After a big move up not long ago we have stayed in this wedge formation and a move above the upper trend line would be very bullish.
Reason #3: Volume has increased in recent weeks and the volume is also showing a possibiliy of buying increasing in anticipation of a further leg up.
Reason #4: Bullish Divergence. On the MACD we can see that despite being in a falling trend we are showing bullish/positive divergence which is a key element to look out for when spotting a falling wedge formation.
Keep an eye on the top of that trend line, a break above could be very good for Stellar.
Happy Trading!

XLM at a HOT SPOT!What's up Traders!
After a long bearish sentiment, we have finally got our bullish impulse. Price reached a potential weekly inverse head and shoulders neck with price action supported by a huge volume. This simply shows that the big boys are interested in this level. Weekly Inverse head and shoulder pattern indicates the potential start of a bullish trend so our bias is bullish. Moreover, if we close above 0.1367 we also get weekly Higher High and a new weekly bullish trend confirmation.
If bears hold the level, we could see some correction to near-term support(0.11) that is also a round psychological number. This is where bulls could attack again causing market to test that weekly inverse head and shoulder neck.
What are your thoughts on the current market?
Enjoy the ride!
Follow Prosperous Traders

XLM Stellar Lumens are you ready ?This is very long term prediction for XLM, i used Bittrex and not Binance simply because Binance is too young exchange to make this kind of trends.
i did for a friend always asking me why i don't do long predictions ??? :P
it's always difficult to predict the future but Fibonacci never lie right ??
So in graph u can see that XLM bottomed and will make a Hammer at the end of this month.
it's simply a reversal sign.
i didnt show indicators to keep graph clean but i can tell you that we are very low.
RSI is at 45, same level as 2017 Pre-rally.
StochRSI is Flat and down, can turn up at any moment.
MACD made 6 Down Columns, and this one should be be the last one.
XLM stayed strong in this bear market so now the time will come soon to show some power back.
First Target 7600 Satoshi.
Second Target 18000 Satoshi.
it's just the beginning of crypto world and future is bright !
Don't forget that this is analyse is not a recommendation to buy.
Happy Tr4Ding !
