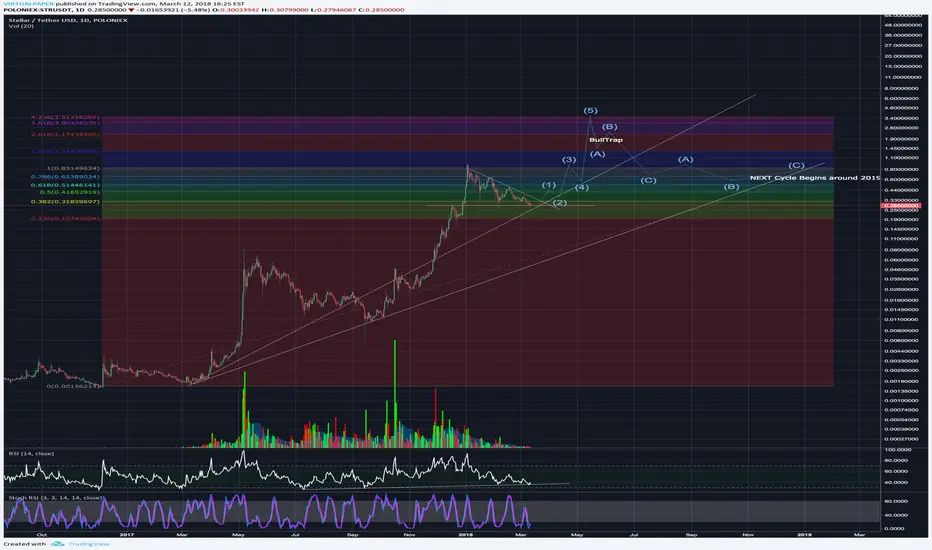
STELLAR LUMENS/ USD 2018 PredictionI Believe we are just about to start the 5th wave of the Elliot count.
This is a LOG Scale dating back 1 year starting from the Pump that happened May 2017 to the present day.
We are closing in on the descending wedge which should hopefully signal a break out. I dont believe this will be as big as the last pump, but theres still plenty of blue sky left in this run.
Im seeing a Top around $2.00-$3.00 near end of April early May followed by a steep correction and long consolidation that should last the entire summer into late fall early winter.
Then 2019 should begin the next market cycle there after.
Just my humble opinion... I could be wrong, but this is how i see the stellar cycle playing out
Feel free to add comments and give your feedback.
Lumens
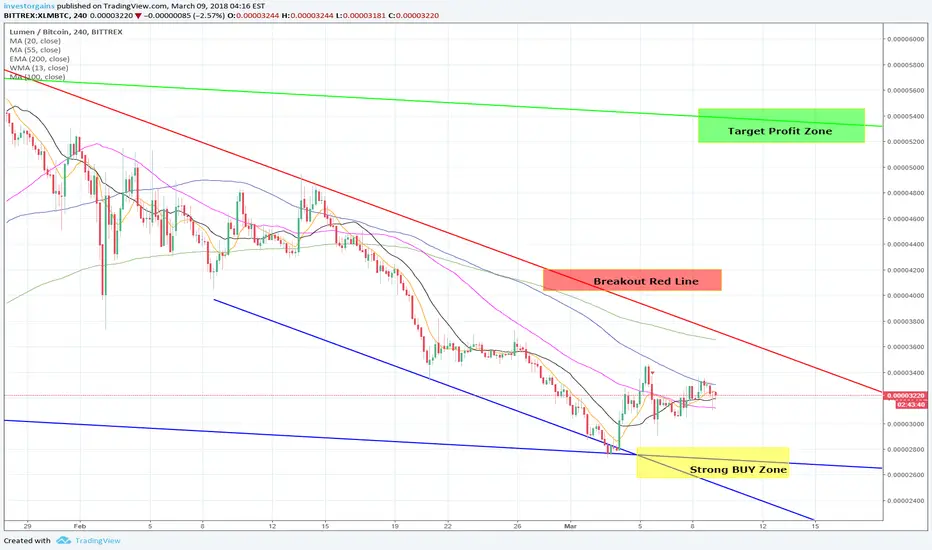
Lumen - XLMBTC - Potential 100% Profit Trade coming upXLMUSD is playing a down channel for last few weeks. Now its time for reversal. BUY on Support Lines and Yellow Zone.
Expecting to breach Red Line Resistance on the TOP.
Profit Target Green Zone.
Potential 100% Profit Trafe in Medium Term : XLMUSD
We will close our SHORT Call now
$XLM needs time too cool off and continue with his market cycle.This is not a financial advice. Is just for fun and entertainment


XLM to 1800 Satoshis Then All Time HighHey Everyone, I have been calling this XLM move since mid January. We are most likely going to get to the 1800 Satoshis level and only then MOON to All Time High (Around 9000 satoshis). This is yet another good example of how Fundamental Analysis doesn't always work. We've only seen good news for XLM in the last month or so and yet it is still going doing. The reason behind it is simply because BTC is too strong and is dropping so everything else is.
Please follow, like and comment if you agree!

Not enough volume. Stellar going down to 3000 and below.I wish STRBTC would keep on going up but at the moment, there isn't enough volume to keep going up. The 3hr/2hr/1hr are all over bought. The 4hr/6hr Stoch RSI are becoming overbought.

Stellar returns from the bottomCoin of the day is Stellar (Lumens)
The pair pushed upwards denoting new bottom at 0.0000275 level. 100-days EMA also played a supporting role, albeit with a small penetration.
Now the pair established an uptrend direction and held it. Nonetheless, we can’t identify a complete turnaround pattern as long as the Global Trend Line Resistance will hold.
Hence, targets for the near-term is 0.000035 level and Global Trend Line Resistance.
From the downside 0.0000333 level and 100-days EMA will play as a support.

XLM Lumen about to breakout to the upsideIt appears that Lumen XLM is about to break out and move higher. I've set a target of $0.77 for mid to late April. This relies a bit on BTC price action to support the overall altcoin market as well. The price action is shown in the triangle formation to be squeezed into a narrow band of selling with declining volume. The chart would indicate that this selling pressure is about exhausted and the next move is up. Looking at the Elliot waves it seems that the move is confirmed. Also the Fibonacci numbers show an oversold state and provide an indication of the price movement into the future. My projection for the price is a combination of looking at the recent historical swings and the Fibonacci levels.
I have previously added XLM as a HODL (long term buy and hold) for my portfolio. From a fundamental investment viewpoint, XLM ticks all the boxes and is a solid project that is in production with a great team behind it. As always, I am using 10% or less of my holdings for trading and the rest are in long term hold. I do not use leverage/margin and I do not recommend it.
You may subscribe to my Free newsletter for more detailed information.
All statements and expressions I offer are my opinions, and not meant as investment advice or solicitation. Information provided is not personal investment advice. Seek guidance from a professional investment adviser before trading or investing. Trading crypto currencies can be a potentially profitable opportunity for investors. You should carefully consider your investment objectives, level of experience, and risk appetite. Most importantly, do not invest money you cannot afford to lose.


Lumens...You've Come A Long Way And There Is Only One DecisionI'll be honest. That entire correction was/is weak. Anyone one who bought at the top, had no stop loss (hard or soft), or HODL'd got hurt. But the entire crypto market is setting up. Kinda hurts to put money in right now after such an abrupt and ripping take from the bears.
Long investment strategy, however, with the current analysis, I am seeing slightly lower prices (which is very good). Lumens is one of my favorites, my baby, my long--but I will drop in a second if it turns on me. But it has held a value I never imagined. I only do TA because the FA is above my pay grade and ability. But definitely a coin I and many others are watching.
Educational Analysis People.
--longmoney

Stellar Lumen Bull Run coming upOnce the awesome oscillator signals bear trend reversal, Stellar will start a Bull run.
Also from the Fundamental side; there will be some good news coming to Stellar's way.

Stellar is close to the February lowsDespite the breakthrough of Global Angle Resistance, which supposed to mean the end of the downward tendency and a starting point of the bullish movement, STRUSD drew the Head And Shoulders figure in the resistance zone (probably caused by the fixation of profits by Traders who invested on the 0.26 levels) and went down.
Judging by the fact that the pair stopped falling in the support zone, above the 0.333 support, these levels are still attractive for buyers.
Nonetheless, the situation looks bearish and to consider further grows I would like to see how the price crosses new Angle resistances, corrected by the recent breakthrough of the Global Angle Resistance. Otherwise, the bias stays bearish and too close to the February low, the breakthrough of which borders with the collapse of the coin.

2 Reasons Why XLM Makes Me WetHello my favorite followers!
How are you?
I'm good, but XLM is hot!
I update my chart of XLM. I love this coin. It has a lot of potential. XLM is on multiple exchanges.
XLM dropped to his consolidation level and going down again to square up at 0.0001875 area.
After this, XLM should go up.
XLM is turning me on ;)
Add me on telegram: web.telegram.org


Who's ready for a stellar cup of lumens???Based on what I've seen, Stellar lumens is not closing under this support line in red going up.... BIG CUP AND HANDLE FORMING ON THE TREND...BUY NOW ! HODL! Even wit bitcoins drops STELLAR continues to move its on direction how it wants... when it wants.... get ready!

interSTELLAR (XLM)BINANCE:XLMBTC is an open-source payment distribution infrastructure and makes use of it's "leapfrog technology” to connect individuals, payment systems and banks throughout the world. StellarLumens has a primary focus on the developing nations. It facilitates transactions of multiple currencies and assets reliably and efficiently for just fractions of a penny, using a cryptocurrency known as Lumens to bridge between sender and receiver. StellarLumens is decentralized and is also a non-profit
First off, I love this coin and this company and the team behind it. I believe in what they are doing and think it can bring some real change to the world. I am definitely long on this coin however for now and what I am reading in the charts say it is possible going to drop further. BINANCE:XLMBTC is currently right on the support line and in a downward channel. We need to see BINANCE:XLMBTC bound off the support and make its way back to the top of the channel. IF it breaks below this support zone we could see it fall to it's lowest of the year and back to numbers in late 2018. We need to watch to see what BINANCE:XLMBTC does in the next few days to see if it will bounce off the support or fall below.
With StellarLumens having partnered with IBM and Tempo, Stellar’s credentials are definitely looking impressive. In an increasingly globalised world, it could very well be the future of banking. This is definitely one to keep an eye on!!
Happy Trading :)
Much Love
DustyPH
***This information is not a recommendation to buy or sell***
*Please leave a comment and let me know what you think!


XLM/BTC 2/22/2018XLM is currently testing various levels of support. This includes the 61.8% fib retracement level, the second standard deviation of the pitchfan and the support level of 3330 Satoshis. This, right off the bat, believes me that the price is in an area where retracement is inevitable. In addition to this, the price has just completed its head and shoulders pattern by reaching this price level. If these are accurate, the price is expecting a price reversal as mentioned earlier, the bullish push that will ensue from this is expected to last until at least the price of 4071 Satoshis (Target 1). This level is characterized by the shorter term 61.8% fib retracement level and is surrounded by the leading span A and B of the Ichimoku cloud which will provide a bit more resistance (arguably). If this price level is broken the next target level is expected to be along the trendline that was used to create the head and shoulders pattern. Along this trendline are the fib retracement levels of 38.2% in both the short term and long term which will provide heavy resistance which is where I expect another reversal.
Important Resistance Levels: 5233, 4814
Important Support Levels: 3330, 3054
DISCLAIMER
WITH THIS CONTENT CRYPTOCURRENCY CAPITAL LLC OR ITS AFFILIATES DO NOT PROVIDE INVESTMENT, TAX, LEGAL OR ACCOUNTING ADVICE. THIS MATERIAL HAS BEEN PREPARED FOR INFORMATIONAL PURPOSES ONLY AND IS NOT INTENDED TO PROVIDE, AND SHOULD NOT BE RELIED ON FOR, TAX, LEGAL, ACCOUNTING OR INVESTMENT ADVICE. YOU SHOULD CONSULT YOUR OWN INVESTMENT, TAX, LEGAL AND ACCOUNTING ADVISORS BEFORE ENGAGING IN ANY TRANSACTION AT YOUR OWN RISK.
CONFLICTS OF INTEREST
GIVEN THE NATURE OF THE FUND’S BUSINESS MODEL, IT IS NOT POSSIBLE TO FORESEE AND PREVENT ALL POSSIBLE CONFLICTS OF INTEREST THAT MIGHT ARISE OVER THE LIFESPAN OF THE COMPANY. AT THE TIME MATERIAL WAS PUBLISHED, CRYPTOCURRENCY CAPITAL LLC, ITS AFFILIATES, OR ITS PRINCIPALS, MAY HOLD LONG/SHORT POSITIONS IN THIS PARTICULAR COIN.
Written by:
Arham Bheda
Senior Research Analyst


$XLM Long Term PredictionWell, everybody knows its practically impossible to predict long term Bitcoin charts but I still have fun doing it. I see a potential Double Bottom Formation forming which indicates a reversal of the current trend. Big rounded bottom shape could mean we see a move similar to Bitcoin before breaking ATH earlier this year. Will be really fun trading this coin over the next couple months!
