CHFJPY FREE SIGNAL|SHORT|
b]✅CHFJPY taps the H2 supply array and shows displacement as bearish orderflow confirms a potential reversal cascade. A corrective pullback into the imbalance is likely before delivering downside toward the target zone.
—————————
Entry: 194.40
Stop Loss: 194.63
Take Profit: 194.15
Time Frame: 2H
—————————
SHORT🔥
✅Like and subscribe to never miss a new idea!✅
M-forex

EUR-NZD Free Signal! Sell!
Hello,Traders!
EURNZD Price broke through the supply zone, confirming bearish orderflow as the breakout shifts structure lower. A clean mitigation of the origin block suggests continuation toward the downside target.
--------------------
Stop Loss: 2.0286
Take Profit: 2.0159
Entry: 2.0236
Time Frame: 4H
--------------------
Sell!
Comment and subscribe to help us grow!
Check out other forecasts below too!
Disclosure: I am part of Trade Nation's Influencer program and receive a monthly fee for using their TradingView charts in my analysis.

GOLD breaks above $4,190, time to exit accumulation4,190 USD/oz is a temporary step forward, with price testing the upper boundary amid thin liquidity (holiday period) and sharply rising expectations of Fed easing. However, confirming an uptrend requires a daily close above the stronger technical resistance zone (around 4,216 USD) and sustaining that level.
Reasons not to rush to confirm a “breakout from the accumulation range”
• The 4,190 USD level appeared during a low-liquidity session, making it prone to “false breaks” caused by thin trading.
• Recent volatility has been driven largely by monetary policy expectations (FedWatch ~80% probability of a December rate cut) rather than any immediate fundamental shift in gold’s supply–demand balance. Expectations can reverse quickly if Fed outlook or economic data changes.
• Geopolitical scenarios (Ukraine, Middle East) and central bank gold demand provide medium–long-term support, but these are “slow” drivers and cannot replace the need for technical confirmation to start a new bull phase.
Elements supporting a breakout (if sustained)
• Dovish comments from Fed officials (Waller, Daly, Williams) continue to reinforce rate-cut bets, while news about the potential Fed Chair candidate (Hassett) increases expectations of easier policy.
• Stable physical demand from Asia (India has recently kept importing strongly at ~14.7B USD) and steady official purchases by central banks.
• Rising global risk sentiment (shift into safe-haven assets) may push gold above 4,200 if accompanied by stronger Fed-easing signals.
Warning factors for a pullback (downside risks)
• Unexpectedly strong U.S. economic data (labor, retail sales) may reduce rate-cut expectations, pushing USD/yields higher and pressuring gold lower.
• Thin holiday liquidity increases the risk of gaps and exaggerated moves.
Outlook:
If policy conditions and geopolitics continue to support (dovish Fed + geopolitical risk), gold has a high probability of breaking out from the accumulation range and starting a true bullish cycle before/early 2026. In the short term (a few sessions to a few weeks), the market remains vulnerable to fake-outs.
Technical Analysis – OANDA:XAUUSD
Gold price has surpassed the 4,190 USD/oz zone—a positive sign but not yet enough to confirm a new uptrend.
Structurally, price remains within the medium-term ascending channel, holding above the trendline and above the short-term MA21 (~4,056 USD).
Notable Fibonacci levels:
• 0.236 ≈ 4,128 USD
• 0.382 ≈ 3,973 USD
The 3,970–4,000 USD zone remains a major support shield.
RSI is recovering from the neutral region (not overbought), showing the uptrend has a foundation but hasn't accelerated.
Necessary condition:
Hold above 3,972–4,000 USD and avoid breaking below the ascending channel trendline.
Sufficient condition (confirmation of a new bullish cycle):
A daily close above 4,216 USD/oz (Fib resistance zone / intraday peak).
Accompanied by:
• RSI breaking above 55–60
• Price holding above MA21 with a successful retest
If these conditions appear together, the probability of moving toward 4,300 — 4,380 USD/oz increases significantly.
Short-term bearish reversal scenario:
Failure to hold 3,972 USD opens the door to a deeper correction toward 3,846 USD (Fib 0.5) and then 3,720 USD (Fib 0.618).
Risk management note:
Volatility is still heavily driven by Fed news and geopolitics. Keep position sizes small, set clear stop-losses, and avoid holding large positions during policy events.
Trade Ideas (as provided)
SELL XAUUSD at 4213 – 4211 ⚡️
• Stop Loss: 4217
• Take Profit 1: 4205
• Take Profit 2: 4199
BUY XAUUSD at 4134 – 4136 ⚡️
• Stop Loss: 4130
• Take Profit 1: 4142
• Take Profit 2: 4148

GOLD retreats slightly, market gains bets on easing cycleOANDA:XAUUSD edged slightly lower after a strong rally yesterday, as the market continued to expand expectations that the Federal Reserve will begin its rate-cutting cycle as early as December. This development occurred despite positive U.S. economic data, indicating that the main support for gold now comes more from monetary policy expectations than from growth signals.
U.S. Treasury yields fell and the U.S. Dollar weakened, with the DXY index down 0.20% to 99.60, helping gold maintain its recovery momentum. Although initial jobless claims fell to 216,000 — the lowest since April — and durable goods orders rose more strongly than expected, these data had little impact on rate-cut expectations.
According to FedWatch, the probability of a Fed rate cut at the December meeting remains near 85%, a sharp increase from below 30% last week.
Geopolitical conditions, however, are shifting in a direction less supportive of gold. Signs suggest Russia and Ukraine are moving closer to a de-escalation agreement, with consultations in Geneva and positive remarks from both sides reducing the geopolitical risk premium that has supported gold for months. A Russian adviser told Al Jazeera that the U.S. plan contains “many positive aspects,” implying that diplomatic progress may be approaching.
Even so, the Fed’s policy outlook remains the dominant driver. JPMorgan Chase has reversed its forecast and now expects the Fed to cut rates in December instead of delaying until January. Michael Feroli’s economics team cited dovish comments from key Fed officials — especially New York Fed President Williams — as the reason for the shift. JPMorgan had previously expected the Fed to stay put after the September jobs report.
A new variable also attracting attention is the selection process for the next Fed Chair. Bloomberg reports that White House economic adviser Kevin Hassett — seen as dovish — has emerged as a leading candidate. The likelihood of a more dovish Fed leadership further strengthens expectations of rate cuts, pressuring the dollar and supporting gold. Treasury Secretary Bessant said the nomination could be announced before Christmas.
Overall, markets perceive that the key question now is how quickly the Fed can implement the rate-cutting cycle. Karl Schamotta of Corpay noted that markets are leaning toward expectations of more aggressive easing. In a similar move, Deutsche Bank raised its 2026 gold price forecast to 4,450 USD/oz, based on steady investment inflows and rising central bank gold-reserve demand.
While geopolitical risks appear to be easing, the outlook for U.S. monetary policy continues to be the primary driver shaping gold’s direction in the short and medium term.
Technical Analysis OANDA:XAUUSD
Gold price is maintaining the main uptrend on the daily timeframe, still moving within the ascending channel established since August. The latest session closed around 4,147 USD/oz, trading above the short-term MA21 and approaching the technical resistance zone at 4,128 (Fib 0.236) and the major resistance at 4,216 USD.
• Structure: Series of higher lows + rising channel intact → underlying trend remains bullish.
• Key support: 3,972–4,000 USD (Fib 0.382 + channel lower boundary/MA21). If this zone holds, the bullish outlook remains valid.
• Short-term resistance: 4,128 USD (Fib 0.236). A breakout above this level opens the path toward 4,216 USD and beyond.
• Momentum: RSI rebounded from the neutral zone → buying pressure has returned but remains moderate; no clear bearish divergence.
• Conclusion: Market structure remains bullish, but confirmation is needed via a breakout above 4,128 USD to validate a new bullish cycle.
Summary:
The main trend is still upward, but the market is awaiting a confirmed breakout of the 4,128–4,216 USD zone to enter a strong bullish phase. If price falls below 3,972–4,000 USD, the plan should be reassessed due to the risk of a pullback toward the 3,846 zone (Fib 0.5).
Trading Plan
SELL XAUUSD — 4195–4193 ⚡️
Stop Loss: 4199
Take Profit 1: 4187
Take Profit 2: 4181
BUY XAUUSD — 4109–4111 ⚡️
Stop Loss: 4105
Take Profit 1: 4117
Take Profit 2: 4123

USDCAD: Bullish Forecast & Bullish Scenario
The analysis of the USDCAD chart clearly shows us that the pair is finally about to go up due to the rising pressure from the buyers.
❤️ Please, support our work with like & comment! ❤️

GBPAUD will Rise.GBPAUD showing weakness on the 4h timeframe pullback. Lower time frames confirming a return back up a few hours into the NY session.

NZDCAD: Long Trading Opportunity
NZDCAD
- Classic bullish pattern
- Our team expects retracement
SUGGESTED TRADE:
Swing Trade
Buy NZDCAD
Entry - 0.8008
Stop - 0.8000
Take - 0.8021
Our Risk - 1%
Start protection of your profits from lower levels
Disclosure: I am part of Trade Nation's Influencer program and receive a monthly fee for using their TradingView charts in my analysis.
❤️ Please, support our work with like & comment! ❤️

GBPCAD Will Explode! BUY!
My dear followers,
This is my opinion on the GBPCAD next move:
The asset is approaching an important pivot point 1.8488
Bias - Bullish
Technical Indicators: Supper Trend generates a clear long signal while Pivot Point HL is currently determining the overall Bullish trend of the market.
Goal - 1.8551
About Used Indicators:
For more efficient signals, super-trend is used in combination with other indicators like Pivot Points.
Disclosure: I am part of Trade Nation's Influencer program and receive a monthly fee for using their TradingView charts in my analysis.
———————————
WISH YOU ALL LUCK

XAU/USD | Gold hit $4200, Is It Time to Fall Again? (READ)By analyzing the #XAUUSD chart on the 4 hour timeframe, we can see that after the previous analysis, gold moved exactly as expected. Even with the low volatility during Thanksgiving, price still managed to hit both the $4190 and $4200 targets.
Once gold entered the supply zone at $4208 to $4244, it started to pull back and is now trading around $4196.
As we approach the final hours of the session, we need to watch how price reacts to its key supply and demand levels. This analysis will be updated soon.
Please support me with your likes and comments to motivate me to share more analysis with you and share your opinion about the possible trend of this chart with me !
Best Regards , Arman Shaban

GBP/USD Signals Trend Shift – Impulsive Upside ExpectedThe chart shows that GBP/USD has completed a full W–X–Y corrective pattern, with the final wave (y) and its C wave forming a clean bottom near the long-term support line. From that low, price has started a strong upward move, which looks like the beginning of a new impulsive Wave 1. The current pullback toward the 0.382–0.618 Fibonacci zone is typical behavior for a Wave 2 retracement before the next strong rally. As long as the price stays above the invalidation level at 1.30094 (the wave (y) bottom), the bullish scenario remains valid. This suggests that GBP/USD is preparing for a larger Wave 3 push to the upside.
Stay tuned!
@Money_Dictators
Thank you :)

EURCAD: Bullish Continuation is Expected! Here is Why:
Looking at the chart of EURCAD right now we are seeing some interesting price action on the lower timeframes. Thus a local move up seems to be quite likely.
Disclosure: I am part of Trade Nation's Influencer program and receive a monthly fee for using their TradingView charts in my analysis.
❤️ Please, support our work with like & comment! ❤️

GBPUSCHello Traders! 👋
What are your thoughts on GBPSUD?
GBP/USD has broken out of its descending channel and is now pulling back to retest the broken structure.
Once the pullback to the broken level is completed, the pair is expected to resume its upward movement toward the marked target level.
As long as price holds above the broken channel, the bullish scenario remains valid.
Don’t forget to like and share your thoughts in the comments! ❤️

EURUSD: Long Trade Explained
EURUSD
- Classic bullish setup
- Our team expects bullish continuation
SUGGESTED TRADE:
Swing Trade
Long EURUSD
Entry Point - 1.1557
Stop Loss - 1.1547
Take Profit - 1.1577
Our Risk - 1%
Start protection of your profits from lower levels
Disclosure: I am part of Trade Nation's Influencer program and receive a monthly fee for using their TradingView charts in my analysis.
❤️ Please, support our work with like & comment! ❤️

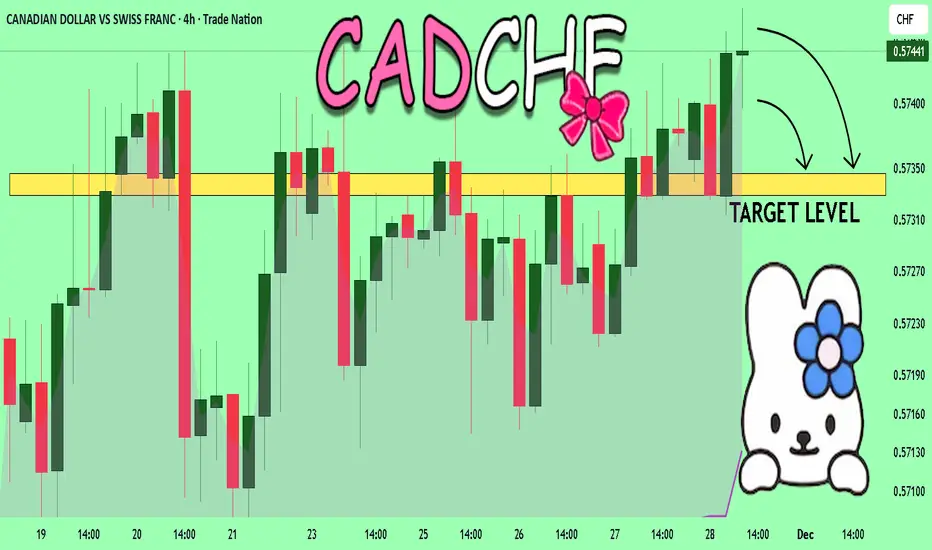
CADCHF What Next? SELL!
My dear friends,
Please, find my technical outlook for CADCHF below:
The instrument tests an important psychological level 0.5744
Bias - Bearish
Technical Indicators: Supper Trend gives a precise Bearish signal, while Pivot Point HL predicts price changes and potential reversals in the market.
Target - 0.5734
About Used Indicators:
Super-trend indicator is more useful in trending markets where there are clear uptrends and downtrends in price.
Disclosure: I am part of Trade Nation's Influencer program and receive a monthly fee for using their TradingView charts in my analysis.
———————————
WISH YOU ALL LUCK
GOLD Sellers In Panic! BUY!
My dear friends,
Please, find my technical outlook for GOLD below:
The price is coiling around a solid key level - 4164.3
Bias - Bullish
Technical Indicators: Pivot Points Low anticipates a potential price reversal.
Super trend shows a clear buy, giving a perfect indicators' convergence.
Goal - 4176.6
Safe Stop Loss - 4157.5
About Used Indicators:
The pivot point itself is simply the average of the high, low and closing prices from the previous trading day.
Disclosure: I am part of Trade Nation's Influencer program and receive a monthly fee for using their TradingView charts in my analysis.
———————————
WISH YOU ALL LUCK

Gold Buyers Regain Momentum — Aiming for 4,240 RetestHello traders! Let’s break down the current XAUUSD structure. Gold is trading within a broad ascending structure after forming a strong local bottom around the Support Line, where buyers entered the market and started to push the price higher. This upward movement follows a long corrective phase, during which the price respected the diagonal Support Line multiple times — confirming the presence of a stable bullish trend. Earlier, XAUUSD broke out of the Buyer Zone (4,110–4,120), retested it, and successfully held above it. This zone now acts as a key demand area and the primary level where buyers continue defending the trend. A previous bearish attempt failed here, forming a fake breakout and leading to a new bullish impulse. The price is now approaching the descending Resistance Line, which has repeatedly pushed gold lower during the recent correction. A clean breakout above this trendline may open the way for the price to move toward the major Resistance Level at 4,240.00, which also aligns with the first take-profit area (TP1). This Resistance Level has acted as a strong reaction zone multiple times, causing sharp pullbacks and marking the boundaries of the Seller Zone. Buyers will likely face significant opposition here once again. If gold respects the Buyer Zone and maintains trading above 4,110, the bullish scenario remains intact, and the price may push toward TP1 → 4,240. A confirmed breakout above this level would signal continuation toward higher targets within the broader bullish structure. However, if XAUUSD fails to hold the Buyer Zone and breaks below 4,110, the bullish outlook becomes invalid. In this case, the price may revisit the lower trendline or enter a deeper correction toward previous support areas. For now, the structure remains moderately bullish, with buyers dominating as long as the price stays above demand and respects the ascending Support Line. Please share this idea with your friends and click "Boost" 🚀

GOLD ANALYSIS 11/28/20251. Fundamental Analysis:
a) Economy:
• USD:
The USD is slightly weakening after the holiday period; low market liquidity means the decline is not strong. Investors are waiting for new signals from next week’s data. Gold may spike unexpectedly if Japan intervenes in the Yen, causing USD weakness.
• U.S. Stock Market:
U.S. equities were closed for Thanksgiving. The general trend remains slightly positive with mild risk-on flow, but not strong enough to push gold in the opposite direction.
• FED:
The Fed maintains a “cautious” stance with no new signals. The scenario still leans toward keeping interest rates unchanged, which provides mild support for gold. A change in the Fed Chair increases the probability of rate cuts, which is supportive for gold.
• TRUMP:
The Trump administration continues to move toward corporate tax cuts and promoting domestic production. This creates medium-term pressure on the USD → indirectly supporting gold.
• Gold ETF – SPDR:
SPDR made no buys or sells; holdings remain unchanged. This reflects a wait-and-see sentiment, with no major capital inflow into gold yet.
b) Geopolitics:
No significant developments in the last 24 hours. Global conflicts remain simmering but not strong enough to create a major boost for gold during the holiday session.
c) Market Sentiment:
• The market is still in a sideways state with mild risk-on sentiment.
• Capital has not fully flowed back into gold, so any upside moves mainly come from technical factors rather than fundamental news.
2. Technical Analysis:
The 15-minute chart shows:
• Price has broken out of the 4,155–4,170 accumulation zone with strong upward momentum.
• RSI is rising steeply and has entered extreme overbought → short-term uptrend is intact but a slight correction is expected.
• Price structure has just formed an accumulation pattern.
• Technical target based on range box and projection: 4,207.
• EMA 20–50 are sloping upward, confirming bullish momentum.
Note: Morning breakouts are often retested → watch for BUY entries at the breakout zone.
RESISTANCE: 4,193 – 4,207
SUPPORT: 4,136 – 4,096
3. Yesterday’s Market (27/11/25):
• GOLD traded almost sideways within 4,143 – 4,170 throughout the day due to low liquidity from Thanksgiving.
• SPDR stayed out; the market is waiting for U.S. data to return.
• The accumulation structure lasted 24 hours → this morning’s breakout followed the pattern precisely.
4. Strategy for Today (28/11/25):
🪙 SELL XAUUSD | 4235 – 4233
SL: 4239
TP1: 4227
TP2: 4221
🪙 BUY XAUUSD | 4162 – 4164
SL: 4158
TP1: 4170
TP2: 4176

DXY bottomed and is starting the new Bullish Leg.The U.S. Dollar index (DXY) has been trading within a Channel Up since the October 01 Low last week even broke above its 1D MA200 (orange trend-line) for the first time since March 05 2025.
Technically, that is confirmation for the long-term continuation of the uptrend. As long as the 1D MA50 (blue trend-line) holds, we expect DXY to start the new Bullish Leg of the Channel Up as yesterday it hits its bottom.
There is a high symmetry between the last three Bullish Legs but since the 'weakest' one has been +2.17%, we have a Target at 101.100. As you can see, that would even test the 1W MA50 (red trend-line), which is the natural long-term Resistance of the market.
Notice also the 1D RSI bounce on its 2-month Support Zone as well as the just formed Bullish Cross on the 4H MACD. All perfectly aligned with bottom formations signaling buy opportunities.
---
** Please LIKE 👍, FOLLOW ✅, SHARE 🙌 and COMMENT ✍ if you enjoy this idea! Also share your ideas and charts in the comments section below! This is best way to keep it relevant, support us, keep the content here free and allow the idea to reach as many people as possible. **
---
💸💸💸💸💸💸
👇 👇 👇 👇 👇 👇

NZDUSD: Bullish Push to 0.593?FX:NZDUSD is eyeing a bullish rebound on the daily chart , with price approaching a key support zone near cumulative sell liquidation, converging with downward short-term and long-term trendlines that could spark upside momentum if buyers defend the level amid recent consolidation. This setup hints at a reversal opportunity after the downtrend, targeting higher levels with strong risk-reward.🔥
Entry between 0.56060–0.56780 for a long position (entry at current levels with proper risk management is recommended). Target at 0.59300 . Set a stop loss at a close below 0.55680 , yielding a risk-reward ratio of approximately 1:2.5 . Monitor for confirmation via a bullish candle close above entry with rising volume, leveraging the pair's potential recovery post-pullback.🌟
Fundamentally , NZDUSD is holding near 0.5723 as of November 28, 2025, after surging to 0.5715 following the RBNZ's 25 bps rate cut to 2.25% on November 27, with signals of no further easing ahead amid resilient labor markets and inflation concerns. The pair has risen about 2.65% since late last week from a low of 0.55910 on November 20, driven by renewed NZD strength and rising US rate cut bets that could weaken the USD further, though forecasts suggest testing support near 0.5675 with volatility persisting due to diverging central bank policies. 💡
📝 Trade Setup
🎯 Entry (Long):
0.56060 – 0.56780
🎯 Target:
• 0.59300
❌ Stop Loss:
• Daily close below 0.55680
⚖️ Risk-to-Reward:
• ~1:2.5 overall
👇 Share your thoughts below! 👇

EURUSD Approaching a Key Buy ZoneQuick Summary
EURUSD is approaching a potential buy zone near 1.15370 where the pair is expected to take liquidity below the low at 1.15474 before showing a bullish reaction The likely target after the rebound is the break of the descending trendline on the H4 timeframe with the demand zone aligning with the 61 Fibonacci level
Full Analysis
The pair is gradually moving toward an important area around 1.15370 This zone represents a potential point where strong buying pressure may appear The current movement seems focused on collecting liquidity below the low at 1.15474 and once this liquidity is taken the probability of a bullish reaction becomes higher
If the price reacts from this level the next objective will be a move toward breaking the descending trendline on the H4 timeframe This scenario aligns with a previously formed demand zone and converges with the 61 Fibonacci level which adds more strength to the bullish continuation outlook
The main focus now is to wait for a clear reaction from the 1.15370 zone Whether it appears as a strong bounce or a shift in control toward buyers this area is likely to play a key role in guiding the next move of the pair

Types of Exotic OptionsIntroduction to Exotic Options
Exotic options are a class of financial derivatives that differ from standard "vanilla" options in terms of their structure, payoff, or underlying conditions. While vanilla options include basic calls and puts with straightforward exercise and payoff structures, exotic options introduce additional features, making them more flexible but also more complex. These options are commonly used for hedging, speculation, or structuring custom financial products to meet specific investor needs.
The term "exotic" broadly covers any option with characteristics that deviate from standard European or American options. Exotic options can be tailored to address particular market views, risk tolerances, or regulatory requirements. Their payoff structures often depend on multiple factors, such as the path of the underlying asset, multiple underlying assets, or the timing of exercise.
Exotic options are usually classified based on their payoff structure, underlying conditions, or exercise style. Let’s explore the most common types.
1. Barrier Options
Barrier options are options whose existence or payoff depends on whether the underlying asset reaches a specified price level, called the barrier, during the option’s life.
Knock-In Options: These options become active only if the underlying asset hits a predefined barrier price. If the barrier is never reached, the option expires worthless.
Example: Up-and-In Call – activates only if the asset rises above the barrier.
Knock-Out Options: These options cease to exist if the underlying asset hits the barrier. Knock-out options are often cheaper than standard options because the barrier introduces additional risk of early termination.
Example: Down-and-Out Put – becomes void if the asset falls below the barrier.
Barrier options are useful for hedging or speculative strategies when investors anticipate that the underlying asset will remain within a certain range or move to specific levels.
2. Asian Options
Asian options, also called average options, are options where the payoff depends on the average price of the underlying asset over a certain period rather than the price at maturity.
Average Price Options: The payoff is based on the difference between the average price of the underlying asset and the strike price.
Average Strike Options: The strike price itself is determined based on the average price of the underlying during the option’s life.
The averaging feature reduces the risk of market manipulation and extreme price fluctuations near maturity. Asian options are widely used in commodity markets, such as oil or metals, where prices can be volatile.
3. Lookback Options
Lookback options provide the holder with the advantage of “looking back” over the life of the option to determine the optimal payoff. The strike price is determined based on the maximum or minimum price of the underlying asset during the option’s life.
Lookback Call Option: Payoff is based on the difference between the underlying asset’s maximum price during the option’s life and the strike price.
Lookback Put Option: Payoff is based on the difference between the strike price and the minimum asset price during the option’s life.
Lookback options eliminate the risk of mistiming the market and are often used by investors with precise views on price movements but uncertain timing.
4. Digital (Binary) Options
Digital or binary options provide a fixed payoff if a certain condition is met at maturity and zero otherwise. The condition is usually the underlying asset crossing a predetermined level.
Cash-or-Nothing Option: Pays a fixed cash amount if the asset price meets the condition.
Asset-or-Nothing Option: Pays the value of the underlying asset if the condition is met.
These options are popular in speculative markets because of their simple, all-or-nothing payoff structure. However, they carry high risk and can be sensitive to even minor market fluctuations.
5. Compound Options
Compound options are options on options. Essentially, they give the holder the right to buy or sell another option at a predetermined price on or before a certain date.
Call on Call: Right to buy a call option.
Put on Call: Right to sell a call option.
Call on Put: Right to buy a put option.
Put on Put: Right to sell a put option.
Compound options are frequently used in corporate finance and project valuation, especially when there are multiple stages of investment decisions or sequential financing requirements.
6. Chooser Options
Chooser options allow the holder to choose whether the option will be a call or a put at a predetermined future date. This feature provides flexibility in uncertain markets when the direction of price movement is unclear.
Typically, the holder decides after observing market conditions partway through the option’s life.
Chooser options are more expensive than standard options due to the added flexibility.
They are useful for hedging uncertain exposures or for speculative purposes when market trends are ambiguous.
7. Rainbow Options
Rainbow options derive their value from two or more underlying assets. The payoff depends on the performance of multiple assets, which can be combined in different ways:
Best-of Options: Payoff is based on the best-performing underlying asset.
Worst-of Options: Payoff is based on the worst-performing underlying asset.
Rainbow options are often used in portfolio strategies or in situations where the correlation between assets can be exploited. For instance, they can hedge multi-asset portfolios or provide exposure to multiple currencies or commodities.
8. Exotic American Options
While standard American options can be exercised anytime before expiry, exotic American options combine this flexibility with other exotic features such as barriers, lookbacks, or multiple underlying assets.
They provide advanced hedging tools for sophisticated investors.
Example: A barrier American call can be exercised any time before expiration but is void if the underlying hits a certain level.
9. Cliquet (Ratchet) Options
Cliquet options, also known as ratchet options, feature periodic resets of the strike price. The payoff is based on the sum of gains over each reset period.
Often used in structured products to guarantee a minimum return while participating in market upside.
Popular in equity-linked notes or structured investment products that offer partial protection.
10. Exotic Options in Structured Products
Exotic options are frequently embedded in structured products, combining multiple features to achieve specific investor objectives:
Yield Enhancement Products: Use barrier options to generate higher income when markets remain stable.
Principal-Protected Notes: Combine options and bonds to protect the invested capital while offering exposure to market upside.
Convertible Structured Products: Include compound or chooser options to allow investors flexibility in timing or payoff.
These products highlight the practical applications of exotic options beyond pure speculation.
Conclusion
Exotic options provide a rich toolkit for investors and risk managers. Their complex structures allow customization of risk, payoff, and market exposure that cannot be achieved with standard options. However, they also come with higher pricing complexity, lower liquidity, and increased counterparty risk.
The most commonly used exotic options include barrier options, Asian options, lookback options, digital options, compound options, chooser options, rainbow options, and Cliquet options. Each type serves a unique purpose, whether for hedging, speculation, or creating structured investment products.
By understanding the characteristics and applications of these options, investors can design strategies that align precisely with market expectations, risk tolerance, and financial goals. Exotic options are not just theoretical constructs—they are widely used in professional trading, corporate finance, and risk management.
GOLD BEARS ARE STRONG HERE|SHORT
GOLD SIGNAL
Trade Direction: short
Entry Level: 4,173.52
Target Level: 3,864.42
Stop Loss: 4,378.26
RISK PROFILE
Risk level: medium
Suggested risk: 1%
Timeframe: 1D
Disclosure: I am part of Trade Nation's Influencer program and receive a monthly fee for using their TradingView charts in my analysis.
✅LIKE AND COMMENT MY IDEAS✅

EUR/USD SHORT FROM RESISTANCE
EUR/USD SIGNAL
Trade Direction: short
Entry Level: 1.157
Target Level: 1.145
Stop Loss: 1.166
RISK PROFILE
Risk level: medium
Suggested risk: 1%
Timeframe: 1D
Disclosure: I am part of Trade Nation's Influencer program and receive a monthly fee for using their TradingView charts in my analysis.
✅LIKE AND COMMENT MY IDEAS✅
