Market Hunter: NASDAQ-NAS100 Sell OpportunityMy friends, Good morning!☀️
For US100-NAS100, I will open a SELL position between 24,988 and 25,243, targeting 23,843.📊
My friends, I share these analyses thanks to every single like I receive from you.
Your likes increase my motivation and make me want to support you in this way.🙏
I sincerely thank all my friends who support me with their likes.❤️
M-forex

NZDUSD: Another Key Level 🇳🇿🇺🇸
I have accurately predicted a pullback from a key level on NZDUSD yesterday.
Today, we have a test of another one.
I expect a pullback from that to 0.5706 level.
❤️Please, support my work with like, thank you!❤️
I am part of Trade Nation's Influencer program and receive a monthly fee for using their TradingView charts in my analysis.

Bullish bounce off key support?USD/CHF is falling towards this the support level which is a pullback support that is slightly below the 38.2% Fibonacci retracement and could bounce to the our take profit.
Entry: 0.8006
Why we like it:|There is a pullback support that is slightly below the 38.2% Fibonacci retracement
Stop loss: 0.7968
Why we like it:
There is a pullback support that lines up with the 61.8% Fibonacci retracement.
Take profit: 0.8067
Why we like it:
There is a pullback resistance level.
Enjoying your TradingView experience? Review us!
Please be advised that the information presented on TradingView is provided to Vantage (‘Vantage Global Limited’, ‘we’) by a third-party provider (‘Everest Fortune Group’). Please be reminded that you are solely responsible for the trading decisions on your account. There is a very high degree of risk involved in trading. Any information and/or content is intended entirely for research, educational and informational purposes only and does not constitute investment or consultation advice or investment strategy. The information is not tailored to the investment needs of any specific person and therefore does not involve a consideration of any of the investment objectives, financial situation or needs of any viewer that may receive it. Kindly also note that past performance is not a reliable indicator of future results. Actual results may differ materially from those anticipated in forward-looking or past performance statements. We assume no liability as to the accuracy or completeness of any of the information and/or content provided herein and the Company cannot be held responsible for any omission, mistake nor for any loss or damage including without limitation to any loss of profit which may arise from reliance on any information supplied by Everest Fortune Group.

Bearish drop off?USD/CAD has reacted off the support level and could drop from this level to our take profit.
Entry; 1.4059
Why we like it:
There is an overlap resistance level.
Stop loss: 1.4133
Why we like it:
There is a multi swing high resistance.
Take profit: 1.3973
Why we like it:
There an overlap support level
Enjoying your TradingView experience? Review us!
Please be advised that the information presented on TradingView is provided to Vantage (‘Vantage Global Limited’, ‘we’) by a third-party provider (‘Everest Fortune Group’). Please be reminded that you are solely responsible for the trading decisions on your account. There is a very high degree of risk involved in trading. Any information and/or content is intended entirely for research, educational and informational purposes only and does not constitute investment or consultation advice or investment strategy. The information is not tailored to the investment needs of any specific person and therefore does not involve a consideration of any of the investment objectives, financial situation or needs of any viewer that may receive it. Kindly also note that past performance is not a reliable indicator of future results. Actual results may differ materially from those anticipated in forward-looking or past performance statements. We assume no liability as to the accuracy or completeness of any of the information and/or content provided herein and the Company cannot be held responsible for any omission, mistake nor for any loss or damage including without limitation to any loss of profit which may arise from reliance on any information supplied by Everest Fortune Group.

XAUUSD – H1 uptrend channel, short-term downside risk increasingXAUUSD – H1 uptrend channel, short-term downside risk increasing Brian – Prioritize short selling at the channel peak, wait to buy back at lower support
I. Strategy Summary Gold is trading in an uptrend channel on H1, but the rise around 4.160 shows signs of weakening, increasing short-term correction risk.
Preferred Scenario: Short sell at the channel peak 4.162–4.164, targeting support areas 4.145 – 4.130 – 4.115 – 4.100.
After the correction, the 4.100–4.080 area may become the foundation for the next rise in the larger trend.
Important price areas to watch: 4.139 – 4.127 – 4.110 – 4.088.
II. Macro Context & News 27/11
02:00 – Fed releases Beige Book This document updates the Fed branches' assessment of the US economic situation.
Describing slower growth, cooling price pressures will further reinforce expectations that the Fed will soon cut interest rates → supporting gold.
Conversely, if the Beige Book describes the economy as still “resilient,” the market may temporarily slow down pricing in rate cuts → causing a short-term adjustment for gold.
19:30 – ECB releases October meeting minutes
If the minutes lean towards the scenario of keeping high interest rates longer, the EUR may be supported, indirectly affecting the USD and gold inflows.
However, the impact is usually not as strong as US data, mainly affecting the overall risk-on/risk-off sentiment.
General Context: Gold has surpassed 4.160 USD/oz as the market increasingly expects the Fed to cut interest rates as early as December, reducing the appeal of interest-bearing assets and increasing the allure of gold – a non-yielding asset. This creates a support foundation for the medium-term uptrend, but after a hot rise, technical adjustments on H1 are normal.
III. Technical Structure – H1 uptrend channel
The price is within the H1 uptrend channel, with rising peaks and troughs, but the upper area near 4.160 coincides with:
The upper boundary of the price channel. The “Sell POC” area on the chart – where liquidity and sell orders are concentrated.
Preferred scenario on the chart: The price may slightly rebound to the POC area 4.162–4.164, then be rejected and slide to the important support area around 4.110 before extending the adjustment down to 4.100–4.080.
The lower trendline of the uptrend channel also acts as a short-term buy area if a clear candle reaction appears.
Notable price areas on H1: Resistance: 4.162–4.164 (channel peak + POC). Intermediate support: 4.139 – 4.127 – 4.110. Deep support: 4.088 – 4.080 – 4.100 (area that may form the bottom for the next rise).
IV. Trading Plan 1. Preferred Scenario – Short sell at the channel peak Idea: Short sell when the price rebounds to the upper boundary of the H1 uptrend channel and POC 4.162–4.164, expecting a correction to support.
Sell: 4.162–4.164 SL: 4.168 TP targets: TP1: 4.145 TP2: 4.130 TP3: 4.115 TP4: 4.100
This is a counter-move order in the uptrend channel, only targeting a short-term correction, not a major trend reversal scenario.
2. Supplementary Scenario – Short buy at support trendline Idea: When the price hits the lower trendline of the H1 uptrend channel and a nice candle reaction appears, consider a short-term buy according to the channel, prioritizing areas:
4.139 – 4.127 – 4.110 – 4.088
Specific Entry/SL levels will depend on the actual price reaction at the trendline, but the general principle:
Buy close to the trendline,
SL placed below the immediate support area,
TP aimed at the middle of the channel or the nearest resistance.
V. Risk Management & Notes
Do not open new positions right before or at the time of the Beige Book and ECB minutes release, as volatility may suddenly increase, widening spreads.
The sell order at 4.162–4.164 is a short-term counter-trend order in the uptrend channel, requiring moderate volume and strict adherence to SL 4.168.
If the price clearly breaks and holds above the 4.170 area, the H1 correction scenario weakens – in that case, stay out, wait for a new structure instead of trying to maintain a sell view.

Bullish rise?GBP/USD has reacted off the support level which is a pullback support and could potentially rise to the 1st resistance.
Entry: 1.3214
Why we like it:
There is a pullback support level.
Stop loss: 1.3100
Why we like it:
There is a pullback support.
Take profit: 1.3454
Why we like it:
There is a swing high resistance.
Please be advised that the information presented on TradingView is provided to Vantage (‘Vantage Global Limited’, ‘we’) by a third-party provider (‘Everest Fortune Group’). Please be reminded that you are solely responsible for the trading decisions on your account. There is a very high degree of risk involved in trading. Any information and/or content is intended entirely for research, educational and informational purposes only and does not constitute investment or consultation advice or investment strategy. The information is not tailored to the investment needs of any specific person and therefore does not involve a consideration of any of the investment objectives, financial situation or needs of any viewer that may receive it. Kindly also note that past performance is not a reliable indicator of future results. Actual results may differ materially from those anticipated in forward-looking or past performance statements. We assume no liability as to the accuracy or completeness of any of the information and/or content provided herein and the Company cannot be held responsible for any omission, mistake nor for any loss or damage including without limitation to any loss of profit which may arise from reliance on any information supplied by Everest Fortune Group.

Swing high resistance ahead?EUR/USD is rising towards the resistance level which is a swing high resistance and could reverse from this level and drop to our take profit.
Entry: 1.1649
Why we like it:
There is a swing high resistance that aligns with the 100$ Fibonacci projection.
Stop loss: 1.1699
Why we like it:
There is a resistance level at the 127.2% Fibonacci extension.
Take profit: 1.1554
Why we like it:
There is a pullback support level.
Enjoying your TradingView experience? Review us!
Please be advised that the information presented on TradingView is provided to Vantage (‘Vantage Global Limited’, ‘we’) by a third-party provider (‘Everest Fortune Group’). Please be reminded that you are solely responsible for the trading decisions on your account. There is a very high degree of risk involved in trading. Any information and/or content is intended entirely for research, educational and informational purposes only and does not constitute investment or consultation advice or investment strategy. The information is not tailored to the investment needs of any specific person and therefore does not involve a consideration of any of the investment objectives, financial situation or needs of any viewer that may receive it. Kindly also note that past performance is not a reliable indicator of future results. Actual results may differ materially from those anticipated in forward-looking or past performance statements. We assume no liability as to the accuracy or completeness of any of the information and/or content provided herein and the Company cannot be held responsible for any omission, mistake nor for any loss or damage including without limitation to any loss of profit which may arise from reliance on any information supplied by Everest Fortune Group.

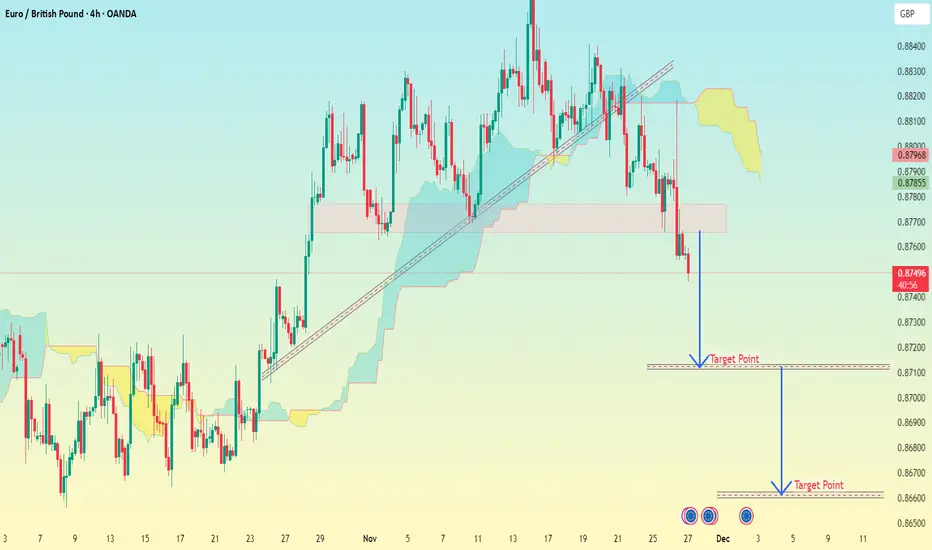
EUR/GBP 4H Chart Pattern.EUR/GBP short targets based on My chart (4H timeframe):
EUR/GBP – Sell Targets
Price right now is near 0.8750 and clearly breaking below support.
✅ Target 1 (Short-Term): 0.8710 – 0.8705
This aligns with my first horizontal marked zone.
✅ Target 2 (Main / Mid-Term): 0.8655 – 0.8645
This matches your second target zone at the bottom.
Bonus Levels (If momentum stays strong):
0.8625
0.8600
Stop-Loss Suggestion
Above broken support zone: 0.8785 – 0.8795
Quick Summary
Trend: Bearish
Bias: Sell on pullbacks
TP1: 0.8710
TP2: 0.8655
BTC/USD – 2H Chart Pattern..📊 BTC/USD – 2H Technical Breakdown
What my chart shows:
A clean breakout above a long descending trendline
Strong bullish impulse candle
Price breaking above the Ichimoku Kumo (cloud) → momentum flip bullish
A rectangular consolidation zone below price (accumulation zone)
My chart already indicates a “Target Point” around ≈ $102,000
BTC currently around $91,200–$91,300
This setup suggests bullish continuation after trendline reversal.
---
🎯 BTC/USD Targets Based on This Structure
TARGET 1 — Immediate breakout extension
➤ $94,500 – $95,000
Why?
First clean liquidity pocket above current price
Matches prior micro-structure breakdown
Short-term bullish continuation zone
---
TARGET 2 — Momentum continuation zone
➤ $98,000 – $99,000
Why?
Major psychological resistance
Last swing imbalance before my marked target
Often acts as a magnet after a trendline breakout
---
TARGET 3 — The Major Target I Plotted
➤ $101,500 – $102,500
Why?
This matches the “Target Point” shown in your image
Aligns with higher-timeframe unfilled liquidity
Strong resistance from historical price memory
Typical completion of a breakout projection (measured move)
---
🛑 Invalidation / Risk Zone
➤ Breakdown below $88,500 – $89,000
Would pull BTC back into the previous consolidation range
Weakens bullish continuation expectations
---
📌 Summary Table
Target Price Zone Reason
Target 1 $94.5K – $95K First liquidity zone
Target 2 $98K – $99K Momentum continuation
Target 3 $101.5K – $102.5K Major measured-move target (my chart)
Invalidation $88.5K – $89K Re-entry into consolidation box

BTC/USD (1H Timeframe) ...📌 BTC/USD (1H Timeframe) – Target Analysis
My chart shows:
Price moving above an ascending trendline
Price breaking above the Ichimoku cloud
A clean space above for an upward move
This setup indicates bullish continuation.
---
🎯 BTC Target (Based on my Chart)
✔ Main Target
$91,500 – $92,000
This matches the “Target Point” my marked and is a valid resistance zone based on the chart structure.
---
📈 Why This Target Is Valid
Price is holding above my trendline support
Price has broken out of the cloud, indicating bullish momentum
No major resistance between $87,500 → $91,500
---
📌 Suggested Trade Plan
Entry: Already near breakout zone ($87,000 – $87,600)
Stop-Loss: Below trendline / cloud → $85,800 – $86,200
Take Profit: $91,500 – $92,000

GBP/JPY – 1H Chart Pattern..📊 GBP/JPY – 1H Professional Technical Analysis
MY chart shows:
A long rising trendline
Price recently rejected near 207.00
Price is pulling back toward the trendline
I have already marked two potential “Target Points” on the chart
Ichimoku cloud is forming support but price is weakening
This looks like a potential corrective decline toward structure support.
---
🎯 Targets Based on my Chart & Structure
TARGET 1 — Shallow Pullback (Trendline Re-test)
➤ 205.80 – 206.00
Why:
Matches the first target marked on my chart
Trendline retest + top edge of your highlighted zone
Strong structural support
---
TARGET 2 — Break of Trendline → Deeper Correction
➤ 205.00 – 205.20
Why:
I have this drawn on my chart
This is the first major horizontal support below the trendline
Also aligns with Kijun + prior consolidation base
Good liquidity zone
---
TARGET 3 — Full Breakdown Objective (Major Target)
➤ 203.20 – 203.50
Why:
This matches the lowest "Target Point" my marked
This is the cleanest imbalance + untouched demand zone
If trendline fully breaks and momentum accelerates down
Strong area for institutional liquidity sweep
---
📌 Summary Table
Target Price Zone Reason
Target 1 205.80 – 206.00 Trendline retest
Target 2 205.00 – 205.20 First major support zone
Target 3 203.20 – 203.50 Deep correction / demand zone
---
🛑 Invalidation (Bullish Defend Zone)
If GBP/JPY breaks back above 206.90–207.10, the downside idea weakens and a re-test of highs becomes more likely.

GBP/USD – 4H Chart PatterN..📊 GBP/USD – 4H Professional Technical Breakdown
1. Market Structure
Price has broken a long-term descending trendline.
A clean bullish breakout from a multi-week consolidation zone.
Ichimoku cloud has turned bullish, with price far above the Kumo → strong momentum.
2. Momentum
Current candle expansion shows impulsive bullish orderflow.
No visible resistance until significantly higher → market is in “airspace.”
---
🎯 Professional Target Zones (Educational Technical Levels)
Target 1 – Nearest Logical Upside
➤ 1.3300 – 1.3330 (Short-term liquidity target)
Why?
Minor imbalance fill
Psych level 1.3300
Closest resistance cluster
---
Target 2 – Momentum Continuation
➤ 1.3370 – 1.3400
Why?
Past structural turning point
Round number magnet
Matches previous volume node on 4H
---
Target 3 – Major Resistance Zone (my chart’s “Target Point”)
➤ 1.3450 – 1.3500
Why?
Strong historical resistance
Weekly supply zone
Follows the projection shown in my chart (blue arrow target)
---
Target 4 – Extended Bullish Objective (If momentum remains extremely strong)
➤ 1.3600 – 1.3650 (Advanced target)
Why?
Weekly imbalance above
Completion of breakout structure
Expanding Ichimoku projection supports this distance
---
🛑 Invalidation / Risk Levels
These help understand where the upside idea weakens:
Key invalidation zone (support)
➤ 1.3180 – 1.3200
Re-entry into the old consolidation box would weaken the bullish continuation idea.
📌 Summary (Professional Format)
Level Type Notes
1.3300–1.3330 Target 1 First liquidity zone
1.3370–1.3400 Target 2 Momentum continuation
1.3450–1.3500 Target 3 (Major) Matches my chart target
1.3600–1.3650 Extended Target Only if trend continues
1.3180–1.3200 Invalidation Break below = weakens bullish bias

GBP/CAD - H1 - UK Budget Boosts!📝 Description & Technical Setup FX:GBPCAD
GBP/CAD is trading inside a strong Ascending Broadening Wedge, showing bullish momentum with higher highs & higher lows.Price is currently holding above the trendline and Ichimoku support, indicating continued upward strength.
We expect a bullish continuation toward the next resistance levels after price breaks and sustains above the minor consolidation.
🟩 Resistance Levels
1st Resistance: 1.86736
2nd Resistance: 1.87198
🔥 Fundamental Update – 27 Nov 2025
1️⃣ UK Budget Surplus Boosts GBP - The UK government's Budget provided more extra money than expected, allowing the government to cover expenses & debts more comfortably.
➡ This increases fiscal stability, boosting investor confidence in the Pound.
#gbpcad #forex #forextrading #priceaction #technicalanalysis #chartanalysis #fxsignals
#tradingviewanalysis #forexsetup #ukbudget #poundsterling #canadiandollar
⚠️ Disclaimer
This is not financial advice.
Market conditions can change rapidly — always manage your risk & use stop-loss.
🙏 Support the Analysis
If you found this helpful, please Like ❤️ & Comment 💬 — it motivates me to post more high-quality setups daily!
Disclosure: I am part of the Headway Influencer Program for my chart analysis.

GBP/USD Bulls Hold Control, Eyes Set on 1.3200Hello everyone,
Currently, GBP/USD is benefiting from expectations that the Fed will cut rates soon, while the BoE maintains a stable policy. Recent statements from Fed officials have reinforced GBP’s strength and applied pressure on USD. Additionally, upcoming US macro releases, such as retail sales and Q3 GDP, could continue to drive GBP higher.
Technically, GBP/USD is in a clear uptrend on the H4 chart, with higher lows and higher highs — a sign that buyers remain dominant. Green FVG zones below provide support and prevent deep declines, while the Ichimoku Cloud also confirms the uptrend: price sits above the cloud, with the cloud ahead thick and sloping upwards.
My forecast:
📈 Price may pull back slightly to 1.3150 (green FVG support) before continuing towards 1.3200, testing the recent highs and potentially moving further if buying momentum persists.
This bullish scenario should only be reconsidered if price breaks below 1.3150.

Gold Is Preparing for Its Next Major BreakoutHello everyone,
Looking at the chart — and combining it with how fast macro signals are shifting — gold feels like a machine that’s just been recharged. In only two sessions, the price surged more than 120 USD even while the US Dollar Index stayed above 100. That’s a very clear sign that capital is choosing gold before the Fed makes any move.
The market is now pricing in nearly an 83% chance that the Fed will cut rates by 0.25% on 10 December. This is no longer a vague expectation. Fed officials like Waller and Williams have softened their tone, signalling willingness to support cuts if the data doesn’t run too hot. When expected interest rates fall, gold essentially steps onto a “fast lane”: lower holding costs and stronger inflows from both defensive and speculative money.
That’s why I’m leaning toward one scenario: gold continues to rise. If the price pulls back to 4,140–4,130 or even 4,120, I see these moves as healthy retracements — not signs of reversal. Once buying pressure returns, I expect gold to break above 4,160, move toward 4,200, and potentially expand into the 4,230–4,250 USD/oz region.
What about you? Are you waiting for a pullback or planning to trade the breakout?

EUR/USD: Awaiting Strong Uptrend from Fed Cuts & Ukraine TalksWith promising news that the Fed may soon cut interest rates, the USD is facing downward pressure. At the same time, negotiations surrounding Ukraine are providing significant support for the euro. Combined with the EUR/USD chart on the H4 timeframe, this presents an excellent opportunity for us to expect a strong uptrend for this currency pair.
Chart Analysis and Technical Signals
Currently, the price of EUR/USD is sitting in a key support zone around 1.1500. This area is confirmed by strong support from the EMA 34 and 89 lines. In the current context, the price is expected to move upwards, with the next target being the 1.1600 level, a significant resistance zone.
We can see that after the price retraced to the 1.1500 support zone, if the price reacts well and does not break below 1.1520, this would be the ideal signal to open a buy position.
Trading Strategy:
Potential Buy Zone: When the price retraces to the 1.1500 level.
Take Profit Target: Around 1.1600.
Stop Loss: Below 1.1500.

GBP/JPY Set to Break 206.500 – Bullish Momentum StrongThe GBP/JPY chart shows a clear bullish structure with strong buying momentum being sustained. Since November 21, 2025, the price has stayed above the upward trendline , continuing to form higher lows and higher highs. The strong support zone is around 205.100, while the main resistance is at approximately 206.500.
Buy signals:
Upward trendline: The trendline provides a strong foundation for the next movement.
Lower timeframes: The 2-hour and 1-hour timeframes show strong buying pressure, confirming the bullish trend and the strong rebound after testing the support zone.
Next scenario:
With the current price at 205.500 and approaching 205.900, GBP/JPY may continue to target 206.500 in the short term. If it maintains above the support zones and continues receiving buying pressure, GBP/JPY is likely to break through resistance levels and extend its bullish trend.
Outlook:
The current bullish trend, supported by the strong demand zone and confirmed by lower timeframes, indicates the potential for continued strong upward movement.

EURUSD My Opinion! BUY!
My dear friends,
Please, find my technical outlook for EURUSD below:
The instrument tests an important psychological level 1.1515
Bias - Bullish
Technical Indicators: Supper Trend gives a precise Bullish signal, while Pivot Point HL predicts price changes and potential reversals in the market.
Target - 1.1553
About Used Indicators:
Super-trend indicator is more useful in trending markets where there are clear uptrends and downtrends in price.
Disclosure: I am part of Trade Nation's Influencer program and receive a monthly fee for using their TradingView charts in my analysis.
———————————
WISH YOU ALL LUCK

EURJPY A Fall Expected! SELL!
My dear friends,
EURJPY looks like it will make a good move, and here are the details:
The market is trading on 181.10 pivot level.
Bias - Bearish
Technical Indicators: Supper Trend generates a clear short signal while Pivot Point HL is currently determining the overall Bearish trend of the market.
Goal - 180.59
Recommended Stop Loss - 181.39
About Used Indicators:
Pivot points are a great way to identify areas of support and resistance, but they work best when combined with other kinds of technical analysis
Disclosure: I am part of Trade Nation's Influencer program and receive a monthly fee for using their TradingView charts in my analysis.
———————————
WISH YOU ALL LUCK

EURAUD Technical Analysis! SELL!
My dear subscribers,
EURAUD looks like it will make a good move, and here are the details:
The market is trading on 1.7884 pivot level.
Bias - Bearish
Technical Indicators: Both Super Trend & Pivot HL indicate a highly probable Bearish continuation.
Target - 1.7835
About Used Indicators:
The average true range (ATR) plays an important role in 'Supertrend' as the indicator uses ATR to calculate its value. The ATR indicator signals the degree of price volatility.
Disclosure: I am part of Trade Nation's Influencer program and receive a monthly fee for using their TradingView charts in my analysis.
———————————
WISH YOU ALL LUCK

ANDNZD WILL FALL|SHORT|
✅AUDNZD has broken down from the higher-timeframe supply with strong displacement, confirming bearish order-flow. A shallow corrective retrace may form before algos drive price toward the next sell-side liquidity target below. Time Frame 3H.
SHORT🔥
✅Like and subscribe to never miss a new idea!✅

AUDUSD: Market Sentiment & Forecast
Our strategy, polished by years of trial and error has helped us identify what seems to be a great trading opportunity and we are here to share it with you as the time is ripe for us to sell AUDUSD.
Disclosure: I am part of Trade Nation's Influencer program and receive a monthly fee for using their TradingView charts in my analysis.
❤️ Please, support our work with like & comment! ❤️

USDCHF: Bullish Continuation & Long Trade
USDCHF
- Classic bullish formation
- Our team expects pullback
SUGGESTED TRADE:
Swing Trade
Long USDCHF
Entry - 0.8041
Sl - 0.8030
Tp - 0.8062
Our Risk - 1%
Start protection of your profits from lower levels
Disclosure: I am part of Trade Nation's Influencer program and receive a monthly fee for using their TradingView charts in my analysis.
❤️ Please, support our work with like & comment! ❤️
