GOLD MARKET ANALYSIS AND COMMENTARY - [Nov 24 - Nov 28]This week, the international OANDA:XAUUSD price continued to hold above the support level of 4,000 USD/oz, but the risk of price decline is increasing due to geopolitical tensions and expectations that the FED will cut interest rates at the December meeting is not enough to create a strong rebound for gold prices.
The gold price next week may continue to fluctuate in a narrow range, waiting for US economic data to clarify the FED's interest rate reduction roadmap.
Retail sales and producer price index (PPI) reports, along with other data due next week, could help us get a better idea of the US economic situation. If the US economic data is below expectations, it could increase expectations for a Fed rate cut in December, pushing gold back above $4,100/oz next week. However, if these data continue to reduce expectations for a Fed rate cut, gold could break the important support level of $4,000/oz next week, opening the door to $3,845-$3,800/oz.
However, in the long term, gold prices are still expected to continue to rise as central banks continue to buy, although the pace of buying may slow down due to the high gold price. Moreover, gold has proven its value, even when compared to other stores of value such as cryptocurrencies, due to the sharp decline of bitcoin and many other cryptocurrencies. Therefore, the appeal of gold is still very large and has no rivals in the financial investment environment.
📌Technically, on the H4 chart, an important support level is established around the 4,000 USD/oz threshold. If this level is broken, the gold price is at risk of falling deeply to 3,900 or even 3,850 USD/oz. In case the gold price forms a double bottom pattern at 4,000 and breaks through the 4,132 resistance level, there is a chance to recover above the 4,200 USD/oz threshold.
SELL XAUUSD PRICE 4176 - 4174⚡️
↠↠ Stop Loss 4180
BUY XAUUSD PRICE 3964 - 3966⚡️
↠↠ Stop Loss 3960
M-forex

ETHUSD W1 - Swing PositionETHUSD W1
We might be starting the bullish continuation here in the Crypto space after such an aggressive correction. We have marked on a 618 correction from previous swing low to swing high price.
Swing low price of $1400, to a swing high price of $5000, a huge extension seen from April 2025 through to end of Aug 2025. We have indicated various prices of interest, working out every $500.
Falling just shy of $2500, this may have been the lowest price we expect to. Lets see what this week brings.

GBPUSD IN DAILY TIMEFRAME IS BEARISH TOO.
Daily timeframe:
In the daily timeframe, analyzing GBP becomes a bit difficult because it is showing unusual behavior.
Considering the bearish outlook, there are four possible scenarios — and based on the points below, I consider scenarios 1 and 2 more likely:
1.If the US Dollar Index (DXY) continues its upward trend and manages to break the important resistance ahead of it.
2.Weekly timeframe.
3.Monthly timeframe: Since we are at the end of the month, we can expect the monthly candlestick trend to have a stronger impact on price this week.

EURUSD: Targets focus on declines to 1.1480 support levelHello everyone, here is my breakdown of the current Euro setup.
Market Analysis
EURUSD continues to trade within a clear Downward Channel, maintaining a strong bearish structure characterized by consistent lower highs and lower lows. Early in the chart, the pair formed a prolonged Range Phase, signaling indecision before sellers eventually took control and pushed the price downward. After breaking below the range, EURUSD repeatedly retested the Resistance Area around 1.1550, where the market showed strong bearish reactions. Each bounce into this resistance zone resulted in a clear rejection, proving that sellers consistently defend this area. The chart also highlights multiple Breakout attempts, all of which failed to sustain upward continuation, confirming a lack of bullish strength. Additionally, the chart shows the formation of a Triangle Pattern, with price reacting between the Triangle Resistance Line and the Triangle Support Line. Despite temporary recoveries, every move upward was limited and capped by descending trendline pressure.
Currently, EURUSD broke below the minor structure support again, demonstrating that bearish momentum remains dominant. Price is now heading toward the Support Zone near 1.1480, which aligns with both horizontal demand and the Triangle Support Line. This confluence makes it a key level to watch. As long as EURUSD trades below the 1.1550 Resistance Area and stays inside the Downward Channel, the bearish structure remains intact. Any bullish recovery is likely to be corrective rather than trend-changing unless buyers manage to break above major resistance.
My Scenario & Strategy
I expect EURUSD to continue edging lower toward the 1.1480 Support Zone, following the recent rejection from resistance. A minor upward correction may occur, potentially retesting broken support or the Triangle Resistance Line, but such a move would likely be short-lived without strong bullish confirmation.
A confirmed breakdown below 1.1480 would open the path for deeper bearish continuation within the Downward Channel. Only a solid breakout above 1.1550, backed by strong buying pressure, would challenge the prevailing bearish trend. For now, selling the pullbacks remains the more favorable strategy while price stays below major resistance.
That's the setup I'm tracking. Thank you for your attention, and always manage your risk.

XAUUSD: Price Holds Triangle Support, Aiming for $4,120Hello everyone, here is my breakdown of the current Gold setup.
Market Analysis
XAUUSD is trading within a broad symmetrical triangle structure, where price continues to respect both the Triangle Resistance Line and the Triangle Support Line. After a strong bullish rally inside the Upward Channel earlier, Gold reached the Resistance Area around $4,120–$4,130, where a sharp reversal occurred. This zone has consistently acted as a major supply level, triggering multiple corrections in recent sessions. Following the breakout below the Upward Channel, XAUUSD entered a consolidation phase supported by the Support Zone near $4,000, which aligns with the lower triangle boundary. This level has proven to be a key reaction zone, showing strong buyer interest each time price tested it.
Currently, Gold attempted another bullish push after bouncing from the Triangle Support Line. Price is now approaching the Resistance Area once again, but buyers face strong selling pressure around $4,080–$4,120, which overlaps with both horizontal resistance and the descending triangle boundary. A break and close above the Triangle Resistance Line would confirm bullish continuation and likely lead to a retest of higher liquidity levels near $4,180–$4,200. As long as XAUUSD stays above the $4,000 Support Zone, the broader structure remains bullish. However, sustained failure to break the resistance area may result in another corrective move back toward the Triangle Support Line.
My Scenario & Strategy
From my perspective, as long as Gold holds above $4,000, the bullish bias remains intact.
My near-term target (TP1) is the $4,120 Resistance Area, with potential extension toward $4,160–$4,200 if buyers manage a clean breakout above the triangle resistance. I will look for long entries on pullbacks toward the Triangle Support Line or the Support Zone around $4,000–$4,020, especially if bullish rejection patterns appear.
If XAUUSD breaks below the $4,000 level, the bullish setup becomes invalid and deeper correction toward $3,960–$3,920 may follow. For now, price action favors a bullish continuation setup, provided support continues to hold.
That's the setup I'm tracking. Thank you for your attention, and always manage your risk.

EURUSD Weakens at Resistance — Pullback Toward 1.1480 ExpectedHello traders! Let’s break down the current EURUSD structure. EURUSD continues to trade inside a broad descending channel, where both the resistance and support lines have been respected multiple times, forming a steady sequence of lower highs and lower lows. Each touch of the upper boundary resulted in a clear Turned Around reaction, confirming the strength of seller control within the overall bearish trend. Earlier, the pair entered a range phase in the left section of the chart, where price consolidated before breaking to the downside. This breakout accelerated bearish momentum, pushing EURUSD toward the lower half of the channel. Subsequent attempts at recovery formed shallow corrections, each aligning with the mid-channel dashed trendline, signaling persistent downward pressure. Recently, price approached the Buyer Zone near the 1.1480–1.1500 region, which also overlaps with the broader Support Level and the lower boundary of the descending channel. This area has previously acted as a strong reaction zone, and buyers are once again attempting to hold this level. At the moment, the EURUSD pair is showing early signs of a potential corrective rebound, with the price aiming for the nearest resistance level around 1.1540, which also coincides with the seller's zone. This region previously acted as support, and is now expected to serve as a barrier for a retest. As long as the pair remains below the descending resistance line, the broader trend remains bearish. A short-term correction to the level around 1.1540 is likely if buyers continue to defend the support level. However, a deviation from the resistance cluster could trigger renewed selling pressure, potentially sending EURUSD back to the channel bottom for another reaction. In my opinion, the price will move towards TP1 with a target of 1.14800. A confirmed break above the descending resistance line would be the first sign of a possible bullish shift, opening the door for a stronger recovery. Please share this idea with your friends and click "Boost" 🚀

EURUSD: Support & Resistance Analysis for Next Week 🇪🇺🇺🇸
Here is my latest support and resistance analysis
for EURUSD for next week.
Consider these structures for pullback/breakout trading next week.
❤️Please, support my work with like, thank you!❤️
I am part of Trade Nation's Influencer program and receive a monthly fee for using their TradingView charts in my analysis.

US30 BEARS ARE GAINING STRENGTH|SHORT
US30 SIGNAL
Trade Direction: short
Entry Level: 46,264.6
Target Level: 45,574.0
Stop Loss: 46,722.1
RISK PROFILE
Risk level: medium
Suggested risk: 1%
Timeframe: 4h
Disclosure: I am part of Trade Nation's Influencer program and receive a monthly fee for using their TradingView charts in my analysis.
✅LIKE AND COMMENT MY IDEAS✅

NASDAQ Week 32 OutlookOn the US Nas 100 1-hour chart, a bearish breakout from a symmetrical triangle suggests downward momentum. The Fair Value Gap at 23,500.0 is a pivotal level—watch for a breakout and retest here to confirm sell entries. Aim for the target at 22681.1, with a stop-loss at 23,740.4 to protect against adverse moves.

USDJPYAccording to the current quarter, price has been below the average. There was a sign of weakness on the week on 11/09/25 and since then, price has some bullish momentum going on with a more recent pullback. I want to see if price can test the current target which is near a previous resistance. If not, remember that trading is simply a game of probabilities.

NZDCADAccording to the current quarter, price has been below the average. There was a sign of weakness on the week on 11/16/25 and since then, price has some bullish momentum going on. I want to see if price can test the current target. If not, remember that trading is simply a game of probabilities. It's not much to grab according to my target but I have to stick to my strategy.

GBPUSDAccording to the current quarter, price has been below the average. Price is also at a level where the third and fourth quarter ago from the current has averaged. There was a sign of weakness on the week on 11/2/25 and since then, price is a very small range zone. I want to see if price can test the current target. If not, remember that trading is simply a game of probabilities. It's not much to grab according to my target but I have to stick to my strategy.

EURNZDAccording to the current quarter, price has been above the average. There has been two signs of weakness on the week of 11/09/25 and 11/16/25. Since the week of the 9th, there seems to be a range play going on. I want to see if price can test the current target. If not, remember that trading is simply a game of probabilities.

CADCHF According to the current quarter, price has been below the average. There was a sign of weakness on the week on 11/2/25 and since then, price is testing a resistance zone. I want to see if price can test the current target. If not, remember that trading is simply a game of probabilities.

Emini Nasdaq 100. Important Areas to look for and Weekly outlookCME_MINI:NQ1!
Highlighted the important levels. what to look for how we can approach the next week in terms of higher timeframe reference points

GBPUSD MOVE DOWN AHEAD|SHORT|
✅GBPUSD is retracing into 2H supply after a clean sell-side sweep. A rejection here would confirm bearish displacement, opening the way for price to seek sell-side liquidity at the marked target zone.Time Frame 2H.
LONG🚀
✅Like and subscribe to never miss a new idea!✅

GBPAUD FREE SIGNAL|SHORT|
✅GBPAUD ran buy-side into 4H supply and delivered a sharp rejection, confirming bearish displacement. With order flow shifting lower, price is expected to seek sell-side liquidity at the marked target.
—————————
Entry: 2.0307
Stop Loss: 2.0351
Take Profit: 2.0240
Time Frame: 4H
—————————
SHORT🔥
✅Like and subscribe to never miss a new idea!✅

AUD-NZD Bearish Bias! Sell!
Hello,Traders!
AUDNZD reacted to the horizontal supply after sweeping buy-side liquidity, showing bearish displacement. If rejection holds, price is likely to move lower toward the sell-side liquidity at the marked target level.Time Frame 2H.
Sell!
Comment and subscribe to help us grow!
Check out other forecasts below too!
Disclosure: I am part of Trade Nation's Influencer program and receive a monthly fee for using their TradingView charts in my analysis.

GBPCHF SUPPLY AREA AHEAD|SHORT|
✅GBPCHF is approaching the 4H supply where buy-side liquidity sits. A rejection from this zone could trigger bearish displacement, sending price lower toward the sell-side liquidity resting at the marked target level. Time Frame 4H.
LONG🚀
✅Like and subscribe to never miss a new idea!✅

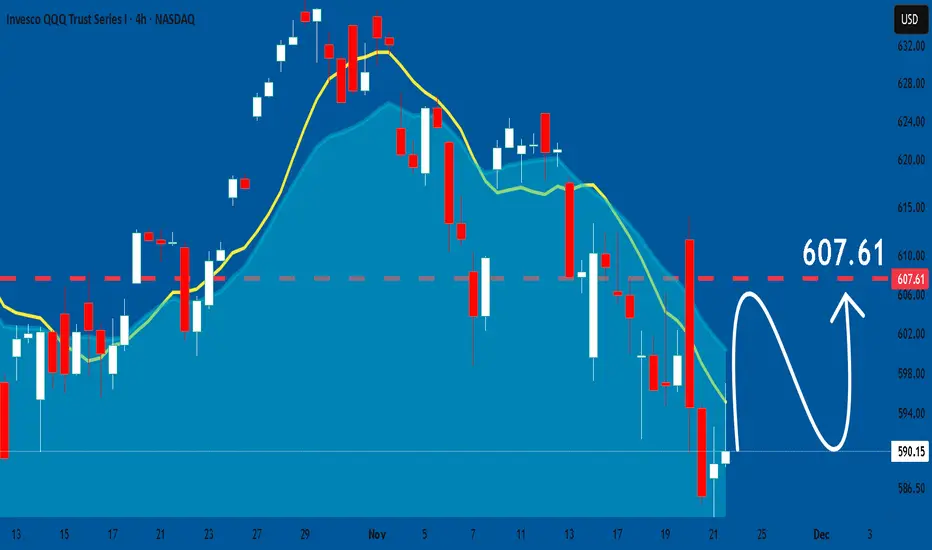
QQQ: Growth & Bullish Forecast
The analysis of the QQQ chart clearly shows us that the pair is finally about to go up due to the rising pressure from the buyers.
❤️ Please, support our work with like & comment! ❤️
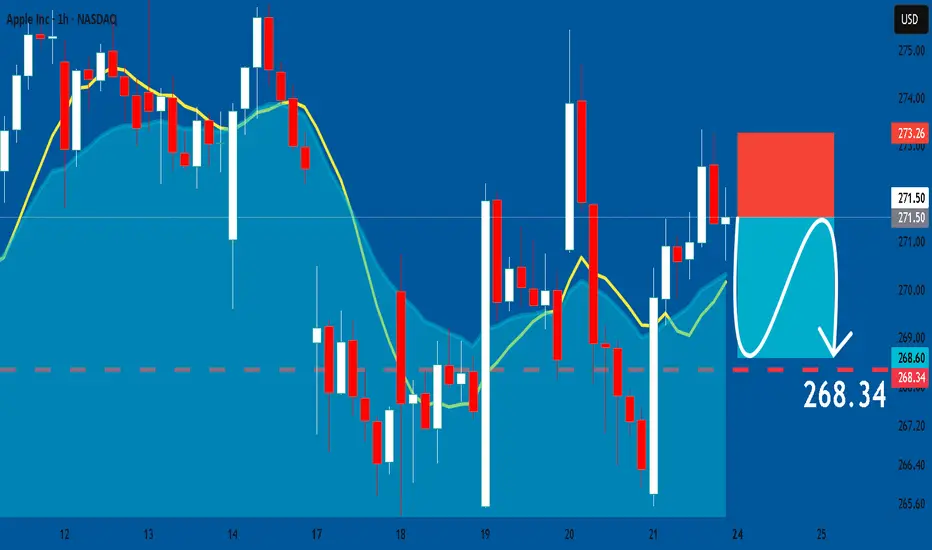
APPLE: Trading Signal From Our Team
APPLE
- Classic bearish formation
- Our team expects pullback
SUGGESTED TRADE:
Swing Trade
Short APPLE
Entry - 271.49
Sl - 273.26
Tp - 268.34
Our Risk - 1%
Start protection of your profits from lower levels
Disclosure: I am part of Trade Nation's Influencer program and receive a monthly fee for using their TradingView charts in my analysis.
❤️ Please, support our work with like & comment! ❤️
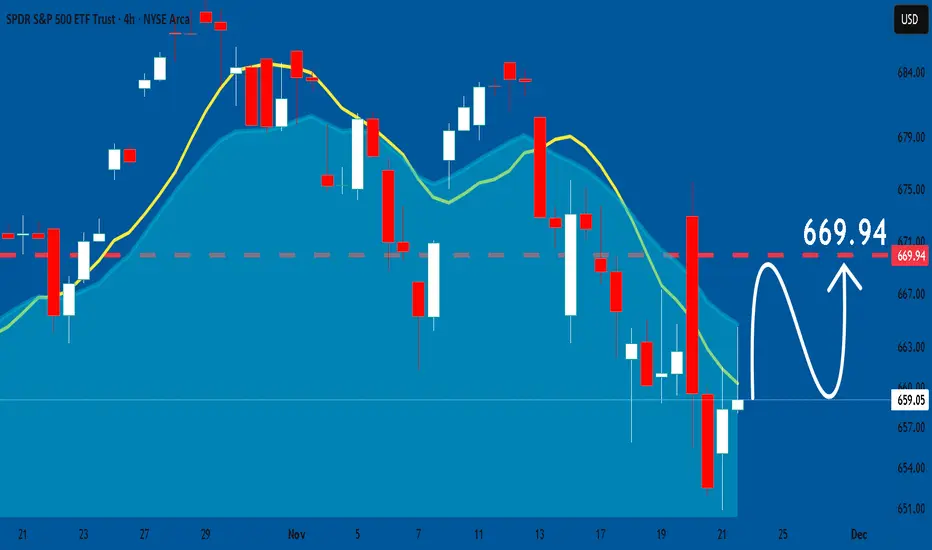
SPY: Will Start Growing! Here is Why:
Looking at the chart of SPY right now we are seeing some interesting price action on the lower timeframes. Thus a local move up seems to be quite likely.
Disclosure: I am part of Trade Nation's Influencer program and receive a monthly fee for using their TradingView charts in my analysis.
❤️ Please, support our work with like & comment! ❤️
EURUSD: Long Signal with Entry/SL/TP
EURUSD
- Classic bullish setup
- Our team expects bullish continuation
SUGGESTED TRADE:
Swing Trade
Long EURUSD
Entry Point - 1.1515
Stop Loss - 1.1509
Take Profit - 1.1527
Our Risk - 1%
Start protection of your profits from lower levels
Disclosure: I am part of Trade Nation's Influencer program and receive a monthly fee for using their TradingView charts in my analysis.
❤️ Please, support our work with like & comment! ❤️
