The 3 KEYS to Trading SUCCESSToday we will discuss about the 3 Keys I believe are required for succeeding in trading.
When you enter into the trading field, you quickly understand that it’s not just about charts and setups — it’s about mastering yourself mentally.
There are 3 keys that separate those who last from those who don’t in Trading:
( 1 ) Psychology
( 2 ) Risk Management
( 3 ) Consistency
Every single one is equally important, but how you balance them determines your long-term outcome when trading.
1 ) Psychology — Master Your Mind Before You Master the Market
Trading, the mental game disguised as a financial one displaying 1s and 0s winners and losers. The market, the charts, the currency, they do not care who you are, what you think, or how badly you want to win.
It simply exposes your strengths and weaknesses in the world of psychology .
Most traders lose, this is not because they lack knowledge, but because they cannot control their emotions, feelings — fear of losing, fear of missing out, greed after a win, hesitation after a loss, anxiety, frustration, impatience.
Every emotional outburst leads to poor decision-making: closing early, revenge trading, over-leveraging, or ignoring your plan, right after you told yourself you were going to lock in and turn $100 into $1000000.
To master psychology:
( 1 ) Detach from the outcomes/end-result. Focus on executing well, not whether a trade wins or loses. Follow your plan.
( 2 ) Think of probability. Every setup, every trade must have an edge — not a guarantee.
( 3 ) Accept losses as part of the process. Losses are tuition fees in this business. Every loss is a win, because there is a lesson to be learned.
( 4 ) Stay grounded. Journaling, mindfulness, and post-trade reflection go a long way. Keep track of trades and review them during down time.
When your mindset stabilizes, when your thoughts are calm, your trading skills become consistent. The charts don’t change — you do.
In terms of training your mindset, see my previous post below which explains the difference between a Trader and Gambler. This is an excellent article for those who want to BECOME a trader.
2. Risk Management — Protect Before You Profit
If psychology keeps your calm, risk management keeps you alive.
This is the part most traders skip — until they learn the hard way and blow their own capital, or 10 fundeds in a row.
Your number one job as a trader is not to make money. It’s to protect capital so you can focus on staying in the game long enough for your strategy and edge to play out well.
Practical risk rules:
( 1 ) Never risk more than 1–2% of your capital on a single trade. (If you do, you increase the emotions of greed)
( 2 ) Always know your max loss before entering — no guessing, if you do not? Your loss, your fault.
( 3 ) Use stop-losses logically, not emotionally. Set them at resistances or supports. Key levels.
( 4 ) Avoid over-leveraging. Leverage magnifies both wins and mistakes. Higher the leverage, higher the risk.
( 5 ) Don’t chase. Missed trades are better than blown accounts. Record them down and log emotions.
Good risk management doesn’t make you rich overnight — but poor risk management will make you broke instantly .
You don’t need huge wins to grow; you just need small, controlled losses and consistent execution throughout your trading journey.
3. Consistency — Discipline Over Drama
Consistency is the glue that holds everything together, risk management to Psychology.
It’s easy to stick to your plan for a week; but it is hard to do it for months without deviation and drifts. But that’s exactly what separates traders who make it from those who burn out.
Consistency means:
( 1 ) Showing up daily, sticking to a fixed plan of study, back testing, assessing.
( 2 ) Following your trading plan with discipline.
( 3 ) Reviewing your trades honestly — both wins and losses. (Are YOU doing THIS?)
( 4 ) Avoiding impulsive changes just because of one bad day. Take a break if the loss affects you badly.
Progress in trading is slow and often invisible. You might not notice improvements week to week but look back after six months of focused consistency — and you’ll realize how far you have come. Remember, slow and steady wins the race. This is a game of Tortoise v Rabbit. Push fast and hard and you will make mistakes – be slow and steady and you will win the race.
Stepping back to view the bigger picture
Trading success isn’t luck — it’s the result of compound discipline, calculated trades and timing.
( 1 ) Psychology gives you control.
( 2 ) Risk management gives you longevity.
( 3 ) Consistency gives you results.
When you align all three, everything starts to click.
You don’t need to master the market — just master your mindset, your risk, and your routine . The profits follow naturally.
Thank you all so much for Reading. I hope this post becomes beneficial to you!
M-forex

Technical Outlook for USD Index, EUR/USD, GBP/USDWhile my bias for the US dollar index remains bearish on the higher timeframes, a near-term bullish setup may have emerged. And that could see a pullback on EUR/USD and possible GBP/USD.
Matt Simpson, Market Analyst at City Index and Forex.com.

Gold Pulls Back in Technical Correction, No Reversal Signal YetHello everyone,
Gold has entered a corrective phase after reaching the historical peak at 4,380–4,400 USD/oz. Selling pressure has emerged, triggering a strong bearish candle and sending price back to retest the 4,220–4,240 USD zone — also the lower boundary of the Kumo cloud on the Ichimoku system, acting as short-term support. At the moment, gold is attempting a slight recovery around 4,265 USD but still trades inside the Kumo cloud, suggesting a sideways correction after an overheated rally. On the H1 chart, the bullish structure has temporarily weakened with a sequence of Lower Highs and Lower Lows forming. The 4,280–4,310 USD area is a red Fair Value Gap (FVG) zone, currently serving as the nearest resistance where sellers may re-enter. Meanwhile, the thick Kumo cloud continues to reflect persistent corrective pressure, especially as recent declines were supported by rising volume — confirming profit-taking at peak levels.
From a fundamental perspective, this retracement is a healthy “cool-down” following nine consecutive weeks of gains. Gold surged nearly 25% in just two months — an exceptionally rare move in history — so profit-taking was inevitable. Additionally, sentiment has been influenced by the Federal Reserve’s lack of clear commitment regarding the timing of rate cuts. Recent US macro data such as CPI and retail sales exceeded expectations, giving the Fed justification to maintain a cautious stance. This has boosted the US Dollar Index (DXY) back toward 106.5, while the US 10-year Treasury yield has moved near 4.1%, reducing gold’s appeal as a non-yielding asset. Risk sentiment has also improved as geopolitical tension between the US and China cooled and the US government avoided a shutdown, prompting some safe-haven flows to rotate out of gold. Several analysts agree that this pullback is constructive for the broader trend, with Alex Kuptsikevich from FxPro noting that gold was “overbought” and needed a rebalancing phase, while Phillip Streible of Blue Line Futures reiterated that the long-term trend remains bullish.
In the short term, gold may continue to move within the 4,220–4,280 USD range, with a potential retest of the 4,210–4,220 USD zone — the lower boundary of the Kumo cloud. If buyers step back in and price breaks above 4,285 USD, a rebound toward the 4,300–4,315 USD FVG resistance zone is likely before the market decides its next direction. Only a confirmed break below 4,200 USD would reinforce further downside toward 4,150 USD. Conversely, holding above 4,200 USD would suggest gold is still in a healthy consolidation phase and retains the potential to revisit 4,300–4,350 USD in the coming sessions.

USD/JPY - Outlook🧭 USD/JPY – Outlook
🕰️ Top-Down Bias
HTF still shows bearish structure 🐻 from the upper channel resistance near 152.00, rejecting a major zone after that last liquidity grab up top.
STF is ranging, trying to hold above the 150.00 mark — but momentum’s fading and sellers might be warming up.
🧱 Technical Breakdown
Weekly : Price tagged major resistance and failed to break higher. Room for continuation lower toward the 144–142 zone (confluence of weekly demand + SSL).
Daily : Still in a broad ascending channel. Any push below 149.50 could open the path to 145 and deeper demand below 140.
8H : Clear rejection from upper MTF trendline → expecting pullback to Target 1 (149), Target 2 (147), and possibly Target 3 (145) if momentum picks up.
Structure note: HTF still bearish, STF neutral/ranging = watch for break of short-term support to confirm the shift.
🎯 Trade Zones
Sell Zone: 151.50–152.00 (liquidity sweep area)
Targets : 149.00 🥇 | 147.00 🥈 | 145.00 🥉 | 140.00 (final HTF demand)
Invalidation : 152.50 clean break & hold
⚙️ Risk Management
Keep stops above structure highs — price may sweep liquidity before reversing.
Watch DXY for extra confirmation before committing size 💡
🔖 Summary
HTF supports bearish price action, while STF is still ranging with unclear direction. Expect HTF momentum to take over soon — eyes on 149.00 breakdown for the next big leg down.

Bearish drop off?EUR/JPY has rejected off the resistance level which is a pullback resistance that lines up with the 38.2% Fibonacci retracement and could drop from this level to our take profit.
Entry: 176.19
Why we like it:
There is a pullback resistance level that lines up with the 38.2% Fibonacci retracement.
Stop loss: 177.74
Why we like it:
There is a swing high resistance level.
Take profit: 173.73
Why we like it:
There is a pullback support that is slightly above the 78.6% Fibonacci retracement.
Enjoying your TradingView experience? Review us!
Please be advised that the information presented on TradingView is provided to Vantage (‘Vantage Global Limited’, ‘we’) by a third-party provider (‘Everest Fortune Group’). Please be reminded that you are solely responsible for the trading decisions on your account. There is a very high degree of risk involved in trading. Any information and/or content is intended entirely for research, educational and informational purposes only and does not constitute investment or consultation advice or investment strategy. The information is not tailored to the investment needs of any specific person and therefore does not involve a consideration of any of the investment objectives, financial situation or needs of any viewer that may receive it. Kindly also note that past performance is not a reliable indicator of future results. Actual results may differ materially from those anticipated in forward-looking or past performance statements. We assume no liability as to the accuracy or completeness of any of the information and/or content provided herein and the Company cannot be held responsible for any omission, mistake nor for any loss or damage including without limitation to any loss of profit which may arise from reliance on any information supplied by Everest Fortune Group.

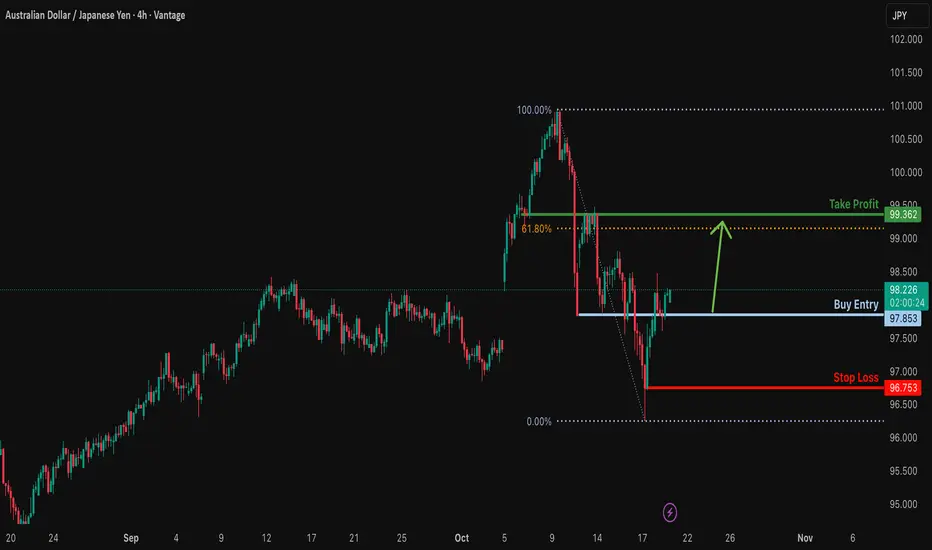
Bullish reversal setup?AUD/JPY has bounced off the support level, which is a pullback support and could rise from this level to our take profit.
Entry: 97.85
Why we like it:
There is a pullback support level.
Stop loss: 96.75
Why we like it:
There is a swing low support level.
Take profit: 99.36
Why we like it:
There is a pullback resistance level that is slightly above the 61.8% Fibonacci retracement.
Enjoying your TradingView experience? Review us!
Please be advised that the information presented on TradingView is provided to Vantage (‘Vantage Global Limited’, ‘we’) by a third-party provider (‘Everest Fortune Group’). Please be reminded that you are solely responsible for the trading decisions on your account. There is a very high degree of risk involved in trading. Any information and/or content is intended entirely for research, educational and informational purposes only and does not constitute investment or consultation advice or investment strategy. The information is not tailored to the investment needs of any specific person and therefore does not involve a consideration of any of the investment objectives, financial situation or needs of any viewer that may receive it. Kindly also note that past performance is not a reliable indicator of future results. Actual results may differ materially from those anticipated in forward-looking or past performance statements. We assume no liability as to the accuracy or completeness of any of the information and/or content provided herein and the Company cannot be held responsible for any omission, mistake nor for any loss or damage including without limitation to any loss of profit which may arise from reliance on any information supplied by Everest Fortune Group.
Bullish bounce off?NZD/JPY has bounced off the support level, which is a pullback support and could rise from this level to our take profit.
Entry: 86.26
Why we like it:
There is a pullback support level.
Stop loss: 85.60
Why we like it:
There is a swing low support level.
Take profit: 87.45
Why we like it:
There is an overlap resistance that lines up with the 138.2% Fibonacci extension.
Enjoying your TradingView experience? Review us!
Please be advised that the information presented on TradingView is provided to Vantage (‘Vantage Global Limited’, ‘we’) by a third-party provider (‘Everest Fortune Group’). Please be reminded that you are solely responsible for the trading decisions on your account. There is a very high degree of risk involved in trading. Any information and/or content is intended entirely for research, educational and informational purposes only and does not constitute investment or consultation advice or investment strategy. The information is not tailored to the investment needs of any specific person and therefore does not involve a consideration of any of the investment objectives, financial situation or needs of any viewer that may receive it. Kindly also note that past performance is not a reliable indicator of future results. Actual results may differ materially from those anticipated in forward-looking or past performance statements. We assume no liability as to the accuracy or completeness of any of the information and/or content provided herein and the Company cannot be held responsible for any omission, mistake nor for any loss or damage including without limitation to any loss of profit which may arise from reliance on any information supplied by Everest Fortune Group.

GBP/CAD Looks Set To Mean RevertA two-bar bearish reversal pattern (dark cloud cover) has formed around the monthly D1 pivot, suggesting that momentum could temporarily shift lower. Bears may look to fade retracements within the reversal zone and maintain a short-term bearish bias while prices remain below last week’s high.
The 20-day EMA, 50-day EMA, and monthly pivot point could serve as downside targets for bears — or potential swing-low zones for bulls to monitor.
A break below 1.8550 would signal a deeper correction or potentially a trend reversal in progress.
Matt Simpson, Market Analyst at City Index and Forex.com

Potential Reversal Ready To Flip AU On Its "Head"Price on OANDA:AUDUSD is almost complete with forming the Right and final Shoulder of the potential Inverted Head and Shoulders Pattern!
Once Price has visited the Neckline of the Pattern, it will be Confirmed and will suggest that Price is looking to head higher!!
Once Confirmed, we will want to wait for a Valid Breakout and a Retest to generate potential Long Opportunities to take up to the next Resistance @ .6620!

Bears Looking To "Correct" Price Gap on EJHere we can see OANDA:EURJPY after many attempts of testing the Rising Support as Support, has broken down below it suggesting not much Support may come from it!!
This comes after Price had made a series of events that would seem a Correction is at hand.
Once Price made the Low (Point A) @ 174.812, Bulls were unable to make a Higher High and settled for a Lower High (Point B) at the 50% Retracement Level @ 176.384.
With the Low being the Confirmation Point for the potential Correction, once Price is able to Break Down below, this will Validate the Set-Up and will generate Short Opportunities to take Price down to the next Support Level which happens to be at the 1.236 Extension of 172.508!

EURAUD to find buyers near market price?EURAUD - 24h expiry
There is no clear indication that the upward move is coming to an end.
Although we remain bullish overall, a correction is possible with plenty of room to move lower without impacting the trend higher.
Risk/Reward would be poor to call a buy from current levels.
A move through 1.7900 will confirm the bullish momentum.
The measured move target is 1.8025.
We look to Buy at 1.7850 (stop at 1.7775)
Our profit targets will be 1.8000 and 1.8025
Resistance: 1.7900 / 1.7950 / 1.8000
Support: 1.7850 / 1.7800 / 1.7775
Risk Disclaimer
The trade ideas beyond this page are for informational purposes only and do not constitute investment advice or a solicitation to trade. This information is provided by Signal Centre, a third-party unaffiliated with OANDA, and is intended for general circulation only. OANDA does not guarantee the accuracy of this information and assumes no responsibilities for the information provided by the third party. The information does not take into account the specific investment objectives, financial situation, or particular needs of any particular person. You should take into account your specific investment objectives, financial situation, and particular needs before making a commitment to trade, including seeking, under a separate engagement, as you deem fit.
You accept that you assume all risks in independently viewing the contents and selecting a chosen strategy.
Where the research is distributed in Singapore to a person who is not an Accredited Investor, Expert Investor or an Institutional Investor, Oanda Asia Pacific Pte Ltd (“OAP“) accepts legal responsibility for the contents of the report to such persons only to the extent required by law. Singapore customers should contact OAP at 6579 8289 for matters arising from, or in connection with, the information/research distributed.

AUDUSD FREE SIGNAL|SHORT|
✅AUDUSD price will soon enter the supply zone and may show a corrective reaction. A short-term pullback could confirm the retest, aligning with the next downside target near 0.6500. Time Frame 2H.
SHORT🔥
✅Like and subscribe to never miss a new idea!✅

AUDCAD SUPPLY LEVEL AHEAD|SHORT|
b]✅AUDCAD is approaching a previously defined supply zone where institutional orders are likely positioned. A reaction from this area could trigger short-term bearish flow toward the 0.9130 objective, completing a liquidity draw to the downside. Time Frame 2H.
SHORT🔥
✅Like and subscribe to never miss a new idea!✅

EUR-AUD Bearish Breakout! Sell!
Hello,Traders!
EURAUD After breaking below the horizontal supply area, price confirmed bearish intent with a strong displacement candle. The market is now likely to revisit the imbalance zone below, targeting the 1.7840 region.Time Frame 5H.
Sell!
Comment and subscribe to help us grow!
Check out other forecasts below too!
Disclosure: I am part of Trade Nation's Influencer program and receive a monthly fee for using their TradingView charts in my analysis.

EURUSD Tests 1.1650EURUSD is attempting to hold above 1.1650. If it succeeds, there’s a chance for a bounce toward 1.17. So far, the setup seems a 50-50, but a risk-reward ratio of around 2.1 makes a long entry justified, at least for me.

EURNZD BEARISH BREAKOUT|SHORT|
✅EURNZD pair has confirmed a clean breakout below the key level, signaling potential continuation toward the 2.0240 target area. Price has already taken out internal liquidity and is now likely to expand further as sellers remain in control. Time Frame 2H.
SHORT🔥
✅Like and subscribe to never miss a new idea!✅

NZD-USD Free Signal! Sell!
Hello,Traders!
NZDUSD Price will soon be reacting from a horizontal supply area to collect liquidity. Smart money may look to drive price lower toward the internal sell-side liquidity resting near 0.5740. Expect continuation if the level holds.
-------------------
Stop Loss: 0.5758
Take Profit: 0.5741
Entry: 0.5751
Time Frame: 3H
-------------------
Sell!
Comment and subscribe to help us grow!
Check out other forecasts below too!
Disclosure: I am part of Trade Nation's Influencer program and receive a monthly fee for using their TradingView charts in my analysis.

EURUSD Channel Down topped. Sell Signal.The EURUSD pair has been trading within a 1-month Channel Down since the September 16 High and last Friday it got rejected on its top and just above the 4H MA200 (orange trend-line). As long as it doesn't break higher, this is technically the pricing of the new Lower High.
Lower Highs tend to initiate Bearish Legs within such patterns. The two already formed before have declined by around -2.00%. As a result, our Target is 1.15000, which again will be valid as long as no new High is made.
-------------------------------------------------------------------------------
** Please LIKE 👍, FOLLOW ✅, SHARE 🙌 and COMMENT ✍ if you enjoy this idea! Also share your ideas and charts in the comments section below! This is best way to keep it relevant, support us, keep the content here free and allow the idea to reach as many people as possible. **
-------------------------------------------------------------------------------
💸💸💸💸💸💸
👇 👇 👇 👇 👇 👇

XAU/USD | First LONG, then SHORT! (READ THE CAPTION)By analyzing the Gold (XAUUSD) chart on the 15-minute timeframe, we can see that gold hit all targets between $4,300 and $4,350 and even rallied to $4,380.99, marking a new all-time high (ATH)!
After that, gold started to correct below $4,300, briefly dipping to $4,258 before bouncing back above $4,285. I expect that if the price moves into the $4,300–$4,317 zone, we may see a negative reaction or rejection from this area.
If that scenario plays out, gold could drop toward $4,250 as its first key target.
Keep a close eye on these levels — and if you have questions about gold’s trend, feel free to leave a comment using the link below!
Please support me with your likes and comments to motivate me to share more analysis with you and share your opinion about the possible trend of this chart with me !
Best Regards , Arman Shaban

NZDCAD: Weak Market & Bearish Forecast
The price of NZDCAD will most likely collapse soon enough, due to the supply beginning to exceed demand which we can see by looking at the chart of the pair.
Disclosure: I am part of Trade Nation's Influencer program and receive a monthly fee for using their TradingView charts in my analysis.
❤️ Please, support our work with like & comment! ❤️

USDCAD: Bearish Continuation & Short Signal
USDCAD
- Classic bearish formation
- Our team expects fall
SUGGESTED TRADE:
Swing Trade
Sell USDCAD
Entry Level - 1.4040
Sl - 1.4047
Tp - 1.4028
Our Risk - 1%
Start protection of your profits from lower levels
Disclosure: I am part of Trade Nation's Influencer program and receive a monthly fee for using their TradingView charts in my analysis.
❤️ Please, support our work with like & comment! ❤️

EURGBP My Opinion! BUY!
My dear subscribers,
This is my opinion on the EURGBP next move:
The instrument tests an important psychological level 0.8683
Bias - Bullish
Technical Indicators: Supper Trend gives a precise Bullish signal, while Pivot Point HL predicts price changes and potential reversals in the market.
Target - 0.8699
About Used Indicators:
On the subsequent day, trading above the pivot point is thought to indicate ongoing bullish sentiment, while trading below the pivot point indicates bearish sentiment.
Disclosure: I am part of Trade Nation's Influencer program and receive a monthly fee for using their TradingView charts in my analysis.
———————————
WISH YOU ALL LUCK

EURUSD Massive Long! BUY!
My dear friends,
Please, find my technical outlook for EURUSD below:
The instrument tests an important psychological level 1.1649
Bias - Bullish
Technical Indicators: Supper Trend gives a precise Bullish signal, while Pivot Point HL predicts price changes and potential reversals in the market.
Target - 1.1677
Recommended Stop Loss - 1.1633
About Used Indicators:
Super-trend indicator is more useful in trending markets where there are clear uptrends and downtrends in price.
Disclosure: I am part of Trade Nation's Influencer program and receive a monthly fee for using their TradingView charts in my analysis.
———————————
WISH YOU ALL LUCK
