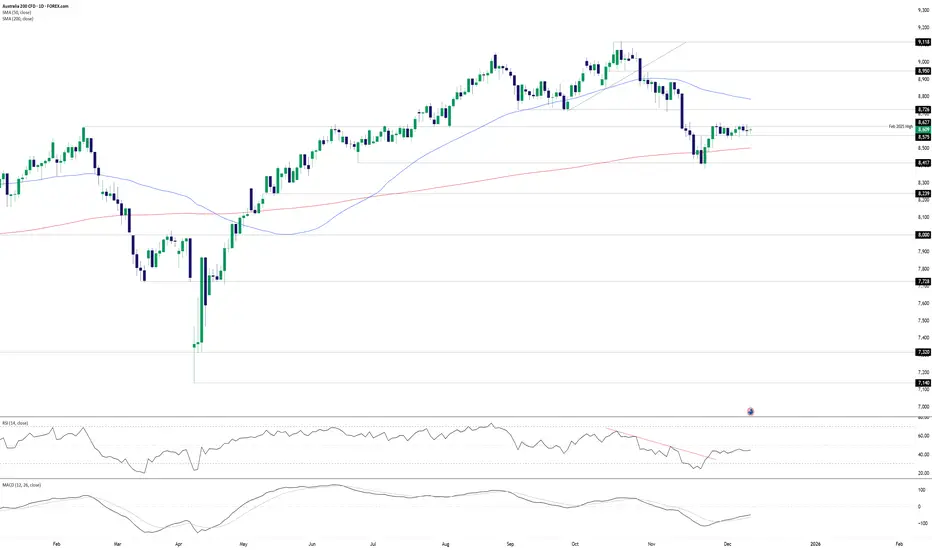
Breakout Risk Builds Before RBAOur ASX 200 contract continues to trade within a narrow range heading into the RBA’s December rate decision, with sellers active above the February high of 8,627 while buyers are lurking on dips below 8,575. Despite multiple probes through both levels over the past fortnight, there has been no close beyond them since 25 November—and that attempt failed.
While there’s no guarantee the RBA decision will deliver a range break, it does present a risk event with the potential to do so. With a well-defined range in play, a sustained breakout in either direction would allow trades to be set targeting a retest of higher or lower levels.
Should the price break and close above 8,627, longs could be established with a stop beneath the level, initially targeting 8,726 given it previously acted as support earlier this year. Conviction in the setup would be bolstered by a close above 8,650.
Conversely, a sustained break beneath 8,575 would flip the setup, with shorts established below the level and a stop above. The 200DMA or 8,417 screen as potential targets. Conviction would grow should the price close beneath the December MTD lows.
Momentum indicators lean marginally bearish on directional bias, though the overall signal is more neutral, placing emphasis on price action. Also note we’re approaching what is traditionally a strong seasonal period for Australian stocks in the second half of December.
Good luck!
DS
M-oscillator
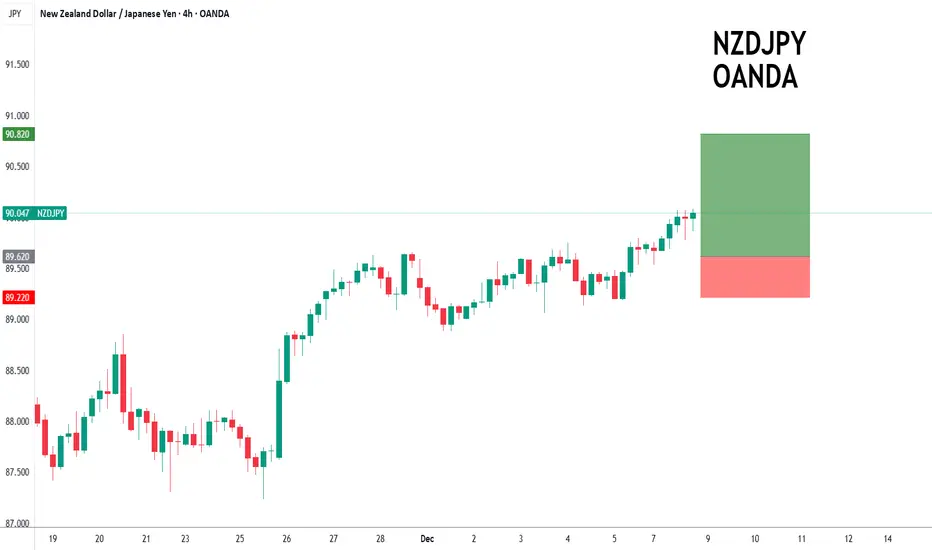
NZDJPY intraday dips continue to attract buyers.NZDJPY - 24h expiry
Intraday dips continue to attract buyers and there is no clear indication that this sequence for trading is coming to an end.
88.88 has been pivotal.
20 4hour EMA is at 89.62.
The RSI is trending higher.
Dip buying offers good risk/reward.
We look to Buy at 89.62 (stop at 89.22)
Our profit targets will be 90.82 and 91.02
Resistance: 90.07 / 90.50 / 91.00
Support: 89.60 / 89.06 / 88.88
Risk Disclaimer
The trade ideas beyond this page are for informational purposes only and do not constitute investment advice or a solicitation to trade. This information is provided by Signal Centre, a third-party unaffiliated with OANDA, and is intended for general circulation only. OANDA does not guarantee the accuracy of this information and assumes no responsibilities for the information provided by the third party. The information does not take into account the specific investment objectives, financial situation, or particular needs of any particular person. You should take into account your specific investment objectives, financial situation, and particular needs before making a commitment to trade, including seeking, under a separate engagement, as you deem fit.
You accept that you assume all risks in independently viewing the contents and selecting a chosen strategy.
Where the research is distributed in Singapore to a person who is not an Accredited Investor, Expert Investor or an Institutional Investor, Oanda Asia Pacific Pte Ltd (“OAP“) accepts legal responsibility for the contents of the report to such persons only to the extent required by law. Singapore customers should contact OAP at 6579 8289 for matters arising from, or in connection with, the information/research distributed.
Hammer Candle Sparks Bullish HopesCoiling within a falling wedge and having printed a hammer candle on the daily timeframe last Friday, a resumption of the broader bullish trend in CHF/JPY may soon be on the cards. However, with RSI (14) and MACD turning neutral on directional bias, confirmation of the bullish signal would be preferred before considering long setups.
192.70 is a level worth keeping an eye on during Monday’s session, coinciding with the high set on 30 October where the price bounced strongly following a failed downside break on Friday. Should we see a retest of the level followed by another bounce, it would strengthen conviction about establishing long positions, creating a setup where entry could be made above the level with a stop beneath it or Friday’s low to protect against an extension of the latest pullback.
The first topside level of note for bulls would be the November downtrend, currently around 194.00. If the pair were to break and hold above this level, it would signal a potential return to the November high of 195.73, putting both it and horizontal resistance at 194.57 on the radar as other bullish targets.
Of course, should CHF/JPY resume its push lower, it would open the door for bearish setups, especially if we see a close beneath 192.70. If that were to eventuate, shorts could be established on the break with a stop above for protection, targeting the influential 50DMA where the price has bounced on six separate occasions since August when breached. A sustained move beyond that level would put 190.54 resistance and uptrend support dating back to February on the radar for bears.
Good luck!
DS

Franc Under PressureEUR/CHF has closed above the 200DMA for the first time since August and is now pressing against resistance at 0.9370, providing a level to build trades around depending on how near-term price action evolves. With RSI (14) pushing higher but not yet overbought, upside strength is building, favouring longs over shorts in terms of directional bias. With MACD confirming the bullish message, the overall signal is strengthened.
Should the pair push above 0.9370 and hold there, longs could be established with a stop beneath the level for protection, targeting 0.9400 initially, with 0.9447 the next option after that.
If the bullish move over the past month stalls at 0.9370, the setup could be flipped, with shorts set beneath the level and a stop above for protection. 0.9350, 0.9320 and the 50DMA screen as potential targets, depending on desired risk-reward from the trade.
With the Swiss National Bank (SNB) interest rate decision looming on Wednesday, it presents a major risk event for traders to be aware of. While the SNB is widely expected to keep its policy rate at 0%, it may come down to signalling on whether taking it into negative territory remains a possibility next year. To this point, the SNB has indicated the bar for doing so is elevated, so any watering down of that assessment may lead to further weakness in the franc.
Good luck!
DS

XAGUSD Long Positioning Headed into FOMCLooking H1 time frame wise closest demand zone around 57.900 is right below Irochimoku cloud, RSI coming it to test and possibly bounce from 50 level, Stochastic RSI in oversold area with a 21/50 SMA cross below price. Were seeing a lot of bullish confluence here if we do end up getting that steeper pullback I would be looking for longs around 57 with a 2 candle swing conformation.

LongBtc long Hello everyone
Bullish position, Bitcoin if it breaks heavy resistance 94k and consolidates above 96k, next target 103k

Aptos Bullish Divergence: Targeting $4.3–$15 Range Aptos has stabilized above the last weekly support; currently, there is a bullish divergence on the weekly chart, so all signals point to a likely upward push. The current range to play is $4.3–$15, and the risk-reward in this case is really good. Thanks to everyone for your attention.

CRM - Minor Downtrend Line Broken!CRM - CURRENT PRICE : 260.57
CRM previously entered a downtrend following a double-top reversal , which pushed the stock into a prolonged bearish trend. However, current price action shows early signs of trend change as CRM successfully breaks above the minor downtrend line with strong momentum.
Momentum indicators are confirming the shift:
⚡RSI has turned bullish and moved decisively above 50
⚡MACD shows a bullish crossover with improving histogram
With improving trend structure and bullish indicators, CRM may continue its upward recovery. Price may extend toward 278.00 and 296.00 as long as it stays above 242.00 (near EMA 50).
ENTRY PRICE : 260.57
FIRST TARGET : 278.00
SECOND TARGET : 296.00
SUPPORT : 242.00

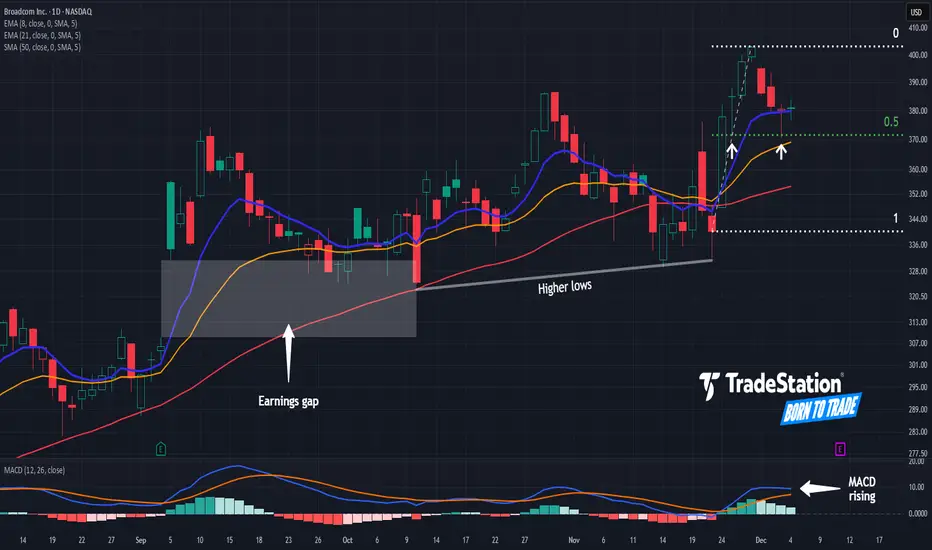
Uptrend in Broadcom? Broadcom hit a new all-time high last week, and some traders may think the chipmaker will continue to advance.
The first pattern on today’s chart is the rally between Friday, November 21, and Friday, November 28. AVGO retraced half the move and bounced, which may suggest its direction remains bullish.
Second, the 8-day exponential moving average (EMA) is above the 21-day EMA. MACD is also rising. Those signals may reflect a positive short-term trend.
Third, strong quarterly results propelled the stock upward on September 5. AVGO never filled the bullish gap, which may suggest buyers outnumber sellers.
Next, you have the series of higher lows in October and November. That could also reveal accumulation of the stock.
Finally, AVGO is an active underlier in the options market. (Its average volume of 260,000 contracts ranks 14th in the S&P 500, according to TradeStation data.) That may help traders take positions with calls and puts.
TradeStation has, for decades, advanced the trading industry, providing access to stocks, options and futures. If you're born to trade, we could be for you. See our Overview for more.
Past performance, whether actual or indicated by historical tests of strategies, is no guarantee of future performance or success. There is a possibility that you may sustain a loss equal to or greater than your entire investment regardless of which asset class you trade (equities, options or futures); therefore, you should not invest or risk money that you cannot afford to lose. Online trading is not suitable for all investors. View the document titled Characteristics and Risks of Standardized Options at www.TradeStation.com . Before trading any asset class, customers must read the relevant risk disclosure statements on www.TradeStation.com . System access and trade placement and execution may be delayed or fail due to market volatility and volume, quote delays, system and software errors, Internet traffic, outages and other factors.
Securities and futures trading is offered to self-directed customers by TradeStation Securities, Inc., a broker-dealer registered with the Securities and Exchange Commission and a futures commission merchant licensed with the Commodity Futures Trading Commission). TradeStation Securities is a member of the Financial Industry Regulatory Authority, the National Futures Association, and a number of exchanges.
Options trading is not suitable for all investors. Your TradeStation Securities’ account application to trade options will be considered and approved or disapproved based on all relevant factors, including your trading experience. See www.TradeStation.com . Visit www.TradeStation.com for full details on the costs and fees associated with options.
Margin trading involves risks, and it is important that you fully understand those risks before trading on margin. The Margin Disclosure Statement outlines many of those risks, including that you can lose more funds than you deposit in your margin account; your brokerage firm can force the sale of securities in your account; your brokerage firm can sell your securities without contacting you; and you are not entitled to an extension of time on a margin call. Review the Margin Disclosure Statement at www.TradeStation.com .
TradeStation Securities, Inc. and TradeStation Technologies, Inc. are each wholly owned subsidiaries of TradeStation Group, Inc., both operating, and providing products and services, under the TradeStation brand and trademark. When applying for, or purchasing, accounts, subscriptions, products and services, it is important that you know which company you will be dealing with. Visit www.TradeStation.com for further important information explaining what this means.
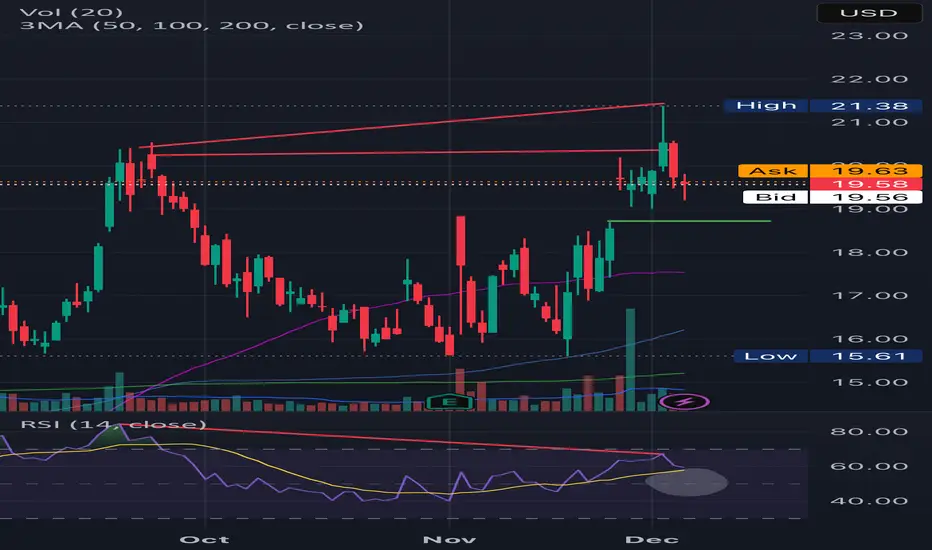
CUP AND A HANDLE - DAILY(For some reason, my published idea chart was blank… so I’m sharing it again)
As you can see there is a cup and a handle pattern forming.
At the same time RSI showing bearish divergence a strong one from the tops, and and weak one from the bodies, and price is showing a gap.
Now simply put, I can try and snipe it by waiting for a better entry after filling the gap, and perhaps cut losses at 18.15
OR as the last red candle has been denied by buyers (denied a lower price (wick)), you can enter now but tread lightly.
To me, with current market conditions, maybe I'll buy a little position, incase it went up, and add to the position to complete a full lot size (from cost basis amount) once it fills the gap.
Remember, the target price from a text books rule says it's the cup and a handle depth but from endpoint of the handle.
But to me, I'm a little worried with current market volatilities, mostly I'll take profit before it reaches full price target.
Te 2 Biggest Problems When Buying Stock Options My body is in pain.
Because I have been exercising.
Also I did yard work.
Determining the whether is not easy.
Just when you think it's raining.
It doesn't rain.
When you think it won't rain.
Then it rains.
Look at this chart.
The stochastic has crossed.
The %k above the %d
Below the 50 level.
The MACD Histogram is green.
This green is on the weekly time.
Finally the 4h entry.
The sentiment analysis is green.
This shows you that buying pressure.
The pressure is building.
This gives you a good support.
You will need support.
This support will help your broker.
How?
You see the problems are these:
⚠️ Buying on a breakout
⚠️ Brokers poor execution during a breakout.
This is what you are avoiding.
When you enter on 4hour time frame sentiment.
Will you ever be right when predicting the weather?
Will you ever be right when predicting the market sentiment analysis?
These are some questions to 🤔 about.
Rocket boost 🚀 this content to learn more.
Disclaimer ⚠️ Trading is risky please learn about risk management and profit taking strategies.
Also feel free to use a simulation trading account before you use real money.
CUP AND A HANDLE - DAILYAs you can see there is a cup and a handle pattern forming.
At the same time RSI showing bearish divergence a strong one from the tops, and and weak one from the bodies, and price is showing a gap.
Now simply put, I can try and snipe it by waiting for a better entry after filling the gap, and perhaps cut losses at 18.15
OR as the last red candle has been denied by buyers (denied a lower price (wick)), you can enter now but tread lightly.
To me, with current market conditions, maybe I’ll buy a little position, incase it went up, and add to the position completing a full lot size on cost basis amount once it fills the gap.
Remember, the target price from a text books rule says it’s the cup and a handle depth but from endpoint of the handle. But to me, I’m a little worried with current market volatilities, mostly I’ll take profit before it reaches full price target.
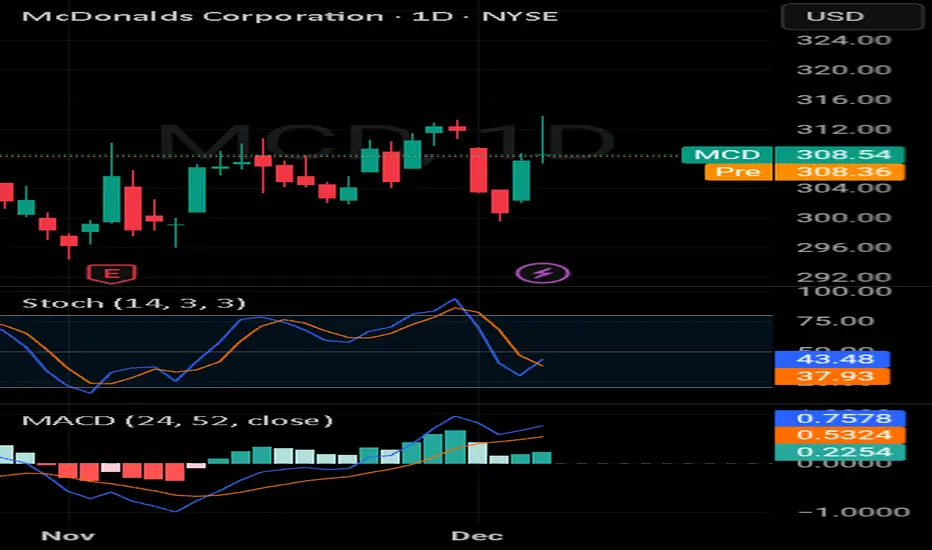
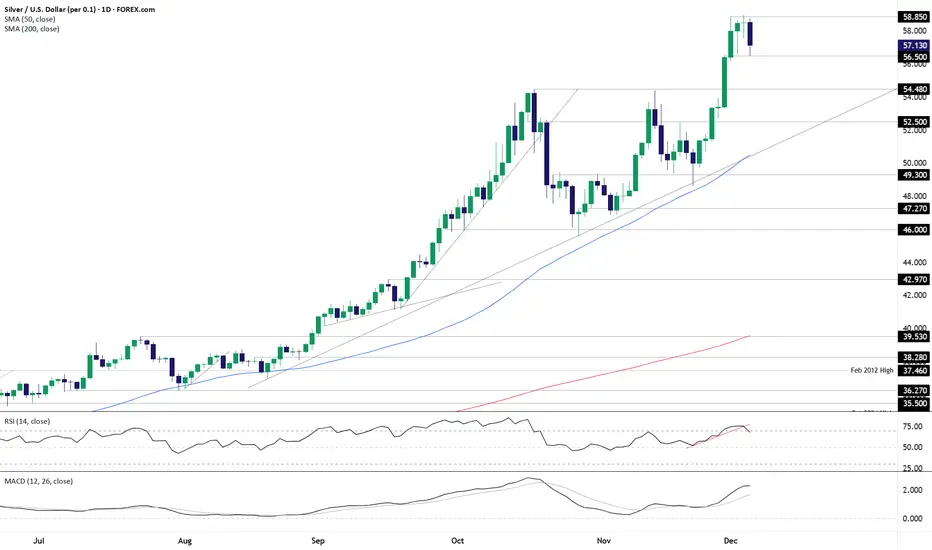
Three candles, one message: Bulls bewareSilver has completed a three-candle evening star pattern following a sharp run higher, warning of bearish reversal risk. However, before acting on the signal, it would be preferable to see the price push below $56.50 before considering short setups, providing a level where a stop could be placed above it for protection against reversal.
Downside targets to consider include $54.48, $52.50 or August uptrend support/50DMA, the latter found today at $50.48.
RSI (14) has broken its uptrend and is curling over but remains above the neutral 50 level, indicting waning upside strength. MACD provides a similar message, beginning to curl over towards the signal line while remaining firmly in positive territory. It’s not a bearish picture being provided by the oscillators, but it does provide a reason for bulls to be cautious around these levels.
While the option is there to act immediately on the bearish signal and initiate shorts at current levels, given the bullish frenzy seen in silver over recent months, risk management looms as particularly important for anyone considering bearish setups.
Good luck!
DS
EURAUD to find buyers at current market price?EURAUD - 24h expiry
The selloff is close to an exhaustion count on the intraday chart.
We expect a reversal in this move.
Risk/Reward would be poor to call a buy from current levels.
A move through 1.7650 will confirm the bullish momentum.
The measured move target is 1.7800.
We look to Buy at 1.7600 (stop at 1.7525)
Our profit targets will be 1.7750 and 1.7800
Resistance: 1.7650 / 1.7700 / 1.7750
Support: 1.7600 / 1.7550 / 1.7525
Risk Disclaimer
The trade ideas beyond this page are for informational purposes only and do not constitute investment advice or a solicitation to trade. This information is provided by Signal Centre, a third-party unaffiliated with OANDA, and is intended for general circulation only. OANDA does not guarantee the accuracy of this information and assumes no responsibilities for the information provided by the third party. The information does not take into account the specific investment objectives, financial situation, or particular needs of any particular person. You should take into account your specific investment objectives, financial situation, and particular needs before making a commitment to trade, including seeking, under a separate engagement, as you deem fit.
You accept that you assume all risks in independently viewing the contents and selecting a chosen strategy.
Where the research is distributed in Singapore to a person who is not an Accredited Investor, Expert Investor or an Institutional Investor, Oanda Asia Pacific Pte Ltd (“OAP“) accepts legal responsibility for the contents of the report to such persons only to the extent required by law. Singapore customers should contact OAP at 6579 8289 for matters arising from, or in connection with, the information/research distributed.

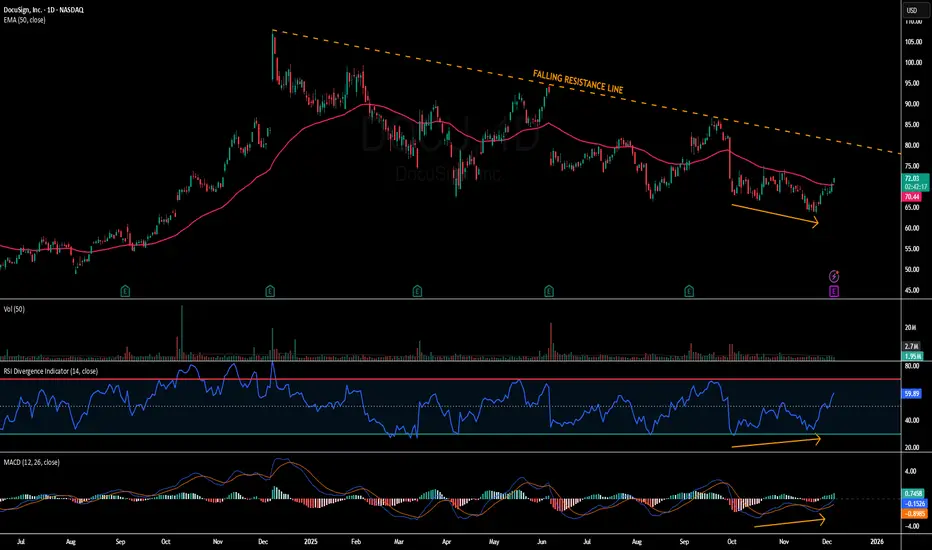
DOCU - Trendline Resistance in FocusDOCU - CURRENT PRICE : 71.87
Short-term outlook for DOCU is bullish as price moves above the EMA50, supported by RSI holding above 50 and bullish divergence in both RSI and MACD (look at orange arrows). Momentum continues to improve with a MACD bullish crossover, positioning DOCU for a move toward the long-term downtrend line. First target is $79 near trendline resistance, with a potential extension to $85, while $65 remains the key support and invalidation level.
ENTRY PRICE : 70.00 - 71.87
FIRST TARGET : 79.00
SECOND TARGET : 85.00
SUPPORT : 65.00
Bullish 0.618B Alternate Bat + Three Rising Valley AccumulationPattern Identified: Bullish Alternate Bat variant (0.618 B-point / 1.13 XA extension) with strong confluence at Potential Reversal Zone (PRZ).
Key Confluence:
Harmonic PRZ: D aligns with 1.13 XA extension
Price Action: Three rising valleys forming at PRZ - showing accumulation and higher low structure
Momentum: Bullish divergence present on MACD and RSI
Confirmation Needed:
Bullish breakout on the third valley + Volume increase on breakout

PATH - Price Reclaims 50-EMA and 200-EMAPATH - CURRENT PRICE : 14.50 - 14.70
PATH is gaining traction after reclaiming both the 50-EMA and 200-EMA, signalling a shift back into short-term bullish momentum 📈. Price strength is supported by rising RSI and an improving MACD cross, suggesting buyers are regaining control.
🔥 Bullish Points
Price reclaimed 50-EMA and 200-EMA
RSI trending above 50 → bullish momentum returning
MACD turning positive with increasing histogram
Volume uptick on recent green candles = buyers active
ENTRY PRICE : 14.50 - 14.70
FIRST TARGET : 16.00
SECOND TARGET : 17.30
SUPPORT : 13.00

BTC : Channel Breakdown RetestPrice has come back to retest the broken channel and is being rejected again. What matters now is to see if buyers can sustain follow‑through, because that will decide if this is just a relief bounce or the start of a real reversal. For now, it still looks like nothing more than a bounce.
Historically, when Bitcoin reaches oversold territory on the daily RSI, it often forms a bullish divergence rather than reversing immediately on the first oversold tag, price makes a lower low while RSI prints a higher low.
My scenario anticipates another push down in price while RSI refuses to make a new low, creating a classic bullish divergence that frequently precedes strong relief rallies.
This price action still fits my broader strategy, as the current rejection and potential bullish divergence keep the scenario alive for another leg up in December, with upside potential toward at least the 115k

EUR/AUD cracks 200DMA as bears circleDownside risks for EUR/AUD look to be building.
For the first time in 2025, the pair closed beneath the 200DMA on Wednesday, adding to the bearish signals delivered over the past week. With RSI (14) and MACD indicating building downside pressure, the message from price action and momentum indicators favours bearish setups over longs.
While its interactions with the level have been fleeting in recent times, of those that have occurred, it’s clear from the price action that traders pay attention to the 200DMA. As such, it can be used to build trade setups around.
Should the bearish break of the 200DMA stick, shorts could be established with a stop above for protection. 1.7670 saw buying over the past two days, so keep that on the radar should the price stall around the level again. If it does, consider nixing the trade. But if the bearish unwind extends, 1.7600, 1.7465 or 1.7400 provide target levels depending on your desired risk-reward.
While longs are not favoured right now, the 200DMA could also be used to build bullish setups should Wednesday’s break prove false, allowing for longs to be established above it with a stop below, targeting either 1.7750, the 50DMA or 1.7945 initially.
Good luck!
DS

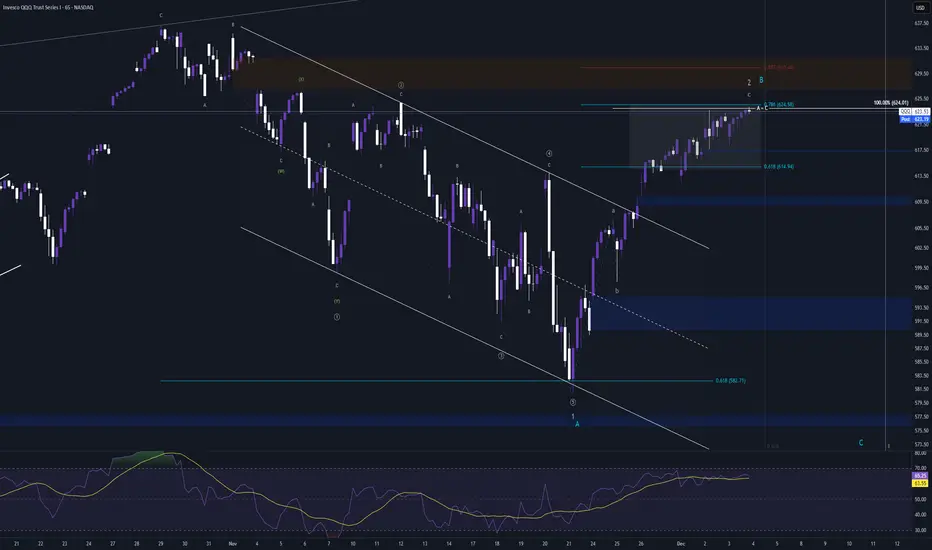
QQQ Rally Finished? A = C reachedIf the previous leading diagonal is accurate, QQQ is currently in my target zone. It was Just shy of the 78% retracement today, but in supply. If last Tuesday (11/25) was a really quick wave B then QQQ also hit A = C in the last hour of trading today and closed below it. SPY went over A=C and closed on it.
Also have bearish divergence. Time wise, we are at 61.8% of the leading diagonal.
The last 3 Thursdays before Thanksgiving were all down days, lets see if we get a repeat tomorrow!

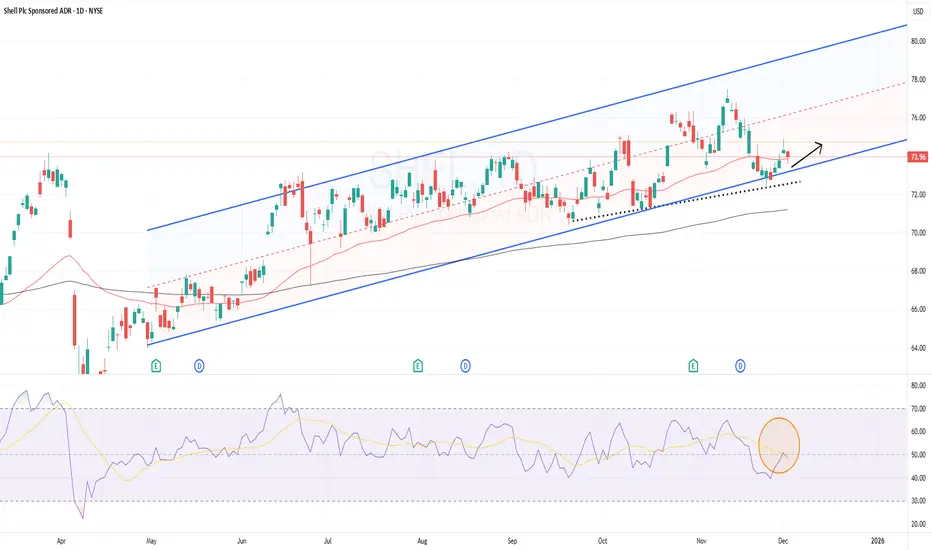
$SHEL offers a good entry point
I’m watching Shell closely — its Q3 2025 results showed strong cash flow: adjusted earnings of $5.4 billion and operating cash flow over $12 billion.
Meanwhile, the company just kicked off a fresh $3.5 billion share buyback, and continues to pay a healthy dividend, which signals confidence in its cash-generation.
On the chart — assuming technical structure holds — the setup looks attractive: price is near the lower end of its ascending channel, 50EMA remains above 200EMA, and dips have tended to bounce off support.
That said, I’m keeping an eye on oil-price volatility and macro headwinds; those could test sentiment if commodity prices slide or demand softens.
Bottom line: Shell looks like a solid dividend-plus-value play right now — I’d consider entry on a dip, with a medium-term horizon.
Possible Long Trade in USDJPY 1 HR TimframeReading raw price action has given us an impression that Buyers have taken control of the market. Advance Technical Analysis tools used.
1. Price Action Reading
2. Pitchforks
3. Market Manipulation techniques
4. Relative Strength Index
5. Frequency Shifting
