EURJPY Massive Long! BUY!
My dear friends,
Please, find my technical outlook for EURJPY below:
The price is coiling around a solid key level - 171.15
Bias - Bullish
Technical Indicators: Pivot Points Low anticipates a potential price reversal.
Super trend shows a clear buy, giving a perfect indicators' convergence.
Goal - 172.11
About Used Indicators:
The pivot point itself is simply the average of the high, low and closing prices from the previous trading day.
Disclosure: I am part of Trade Nation's Influencer program and receive a monthly fee for using their TradingView charts in my analysis.
———————————
WISH YOU ALL LUCK
M-signal

USDJPY Will Collapse! SELL!
My dear friends,
My technical analysis for USDJPY is below:
The market is trading on 147.84 pivot level.
Bias - Bearish
Technical Indicators: Both Super Trend & Pivot HL indicate a highly probable Bearish continuation.
Target - 147.33
Recommended Stop Loss - 148.06
About Used Indicators:
A pivot point is a technical analysis indicator, or calculations, used to determine the overall trend of the market over different time frames.
Disclosure: I am part of Trade Nation's Influencer program and receive a monthly fee for using their TradingView charts in my analysis.
———————————
WISH YOU ALL LUCK

EURGBP: Trading Signal From Our Team
EURGBP
- Classic bearish setup
- Our team expects bearish continuation
SUGGESTED TRADE:
Swing Trade
Short EURGBP
Entry Point - 0.8632
Stop Loss - 0.8640
Take Profit - 0.8615
Our Risk - 1%
Start protection of your profits from lower levels
Disclosure: I am part of Trade Nation's Influencer program and receive a monthly fee for using their TradingView charts in my analysis.
❤️ Please, support our work with like & comment! ❤️

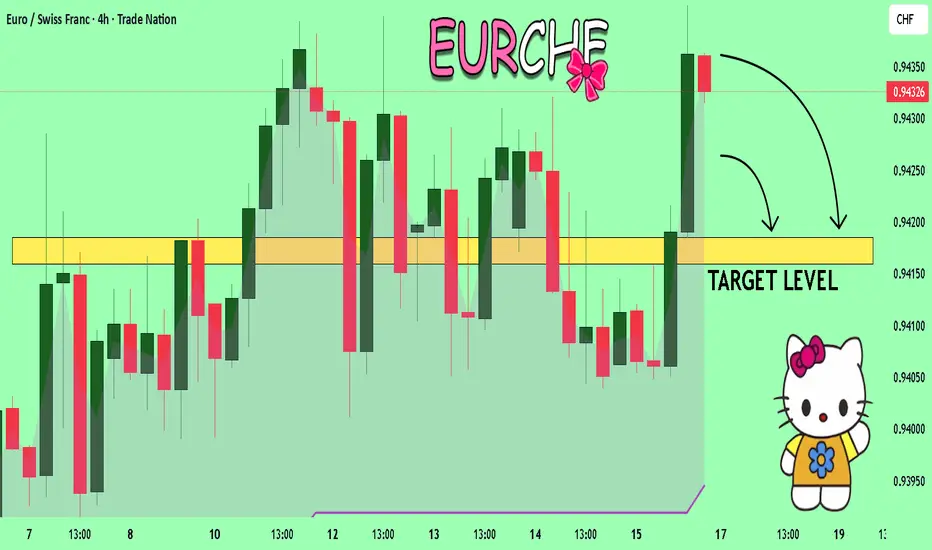
EURCHF What Next? SELL!
My dear followers,
I analysed this chart on EURCHF and concluded the following:
The market is trading on 0.9432 pivot level.
Bias - Bearish
Technical Indicators: Both Super Trend & Pivot HL indicate a highly probable Bearish continuation.
Target - 0.9418
About Used Indicators:
A super-trend indicator is plotted on either above or below the closing price to signal a buy or sell. The indicator changes color, based on whether or not you should be buying. If the super-trend indicator moves below the closing price, the indicator turns green, and it signals an entry point or points to buy.
Disclosure: I am part of Trade Nation's Influencer program and receive a monthly fee for using their TradingView charts in my analysis.
———————————
WISH YOU ALL LUCK
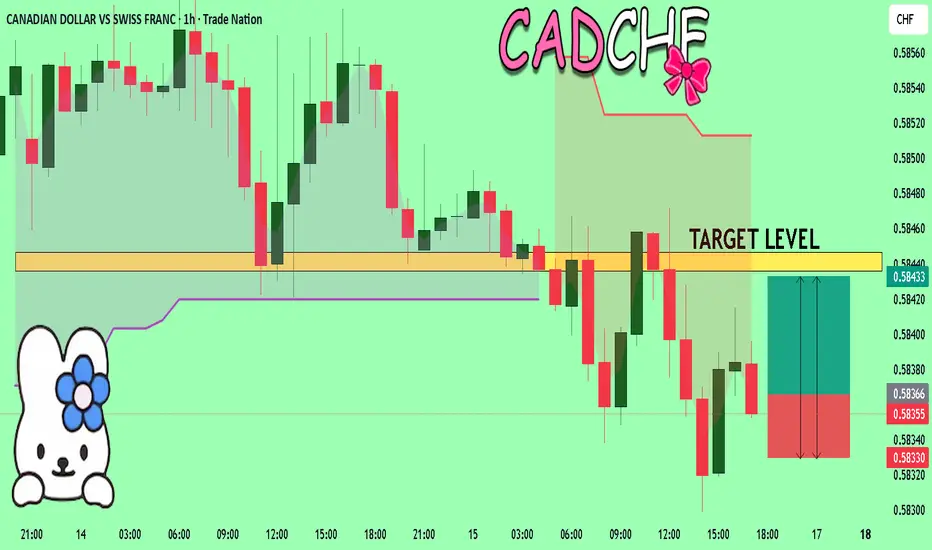
CADCHF The Target Is UP! BUY!
My dear subscribers,
This is my opinion on the CADCHF next move:
The instrument tests an important psychological level 0.5836
Bias - Bullish
Technical Indicators: Supper Trend gives a precise Bullish signal, while Pivot Point HL predicts price changes and potential reversals in the market.
Target - 0.5843
My Stop Loss - 0.5833
About Used Indicators:
On the subsequent day, trading above the pivot point is thought to indicate ongoing bullish sentiment, while trading below the pivot point indicates bearish sentiment.
Disclosure: I am part of Trade Nation's Influencer program and receive a monthly fee for using their TradingView charts in my analysis.
———————————
WISH YOU ALL LUCK
GOLD: Bullish Continuation & Long Signal
GOLD
- Classic bullish setup
- Our team expects bullish continuation
SUGGESTED TRADE:
Swing Trade
Long GOLD
Entry Point - 3335.2
Stop Loss - 3332.9
Take Profit - 3340.6
Our Risk - 1%
Start protection of your profits from lower levels
Disclosure: I am part of Trade Nation's Influencer program and receive a monthly fee for using their TradingView charts in my analysis.
❤️ Please, support our work with like & comment! ❤️

NZDJPY Sellers In Panic! BUY!
My dear friends,
NZDJPY looks like it will make a good move, and here are the details:
The market is trading on 87.169 pivot level.
Bias - Bullish
Technical Indicators: Supper Trend generates a clear long signal while Pivot Point HL is currently determining the overall Bullish trend of the market.
Goal - 87.480
About Used Indicators:
Pivot points are a great way to identify areas of support and resistance, but they work best when combined with other kinds of technical analysis
Disclosure: I am part of Trade Nation's Influencer program and receive a monthly fee for using their TradingView charts in my analysis.
———————————
WISH YOU ALL LUCK

EURUSD My Opinion! SELL!
My dear friends,
Please, find my technical outlook for EURUSD below:
The price is coiling around a solid key level - 1.1688
Bias - Bearish
Technical Indicators: Pivot Points Low anticipates a potential price reversal.
Super trend shows a clear sell, giving a perfect indicators' convergence.
Goal - 1.1662
Safe Stop Loss - 1.1701
About Used Indicators:
The pivot point itself is simply the average of the high, low and closing prices from the previous trading day.
Disclosure: I am part of Trade Nation's Influencer program and receive a monthly fee for using their TradingView charts in my analysis.
———————————
WISH YOU ALL LUCK

US30 - potential head and shoulders on 30min chartWatching the US30Cash for a potential short setup.
A head and shoulders pattern may be forming on the 30-minute timeframe. I’m still waiting for confirmation on some key variables before entering the trade.
Trade Details:
📊 Risk/Reward: 2.7
🎯 Entry: 45 224
🛑 Stop Loss: 45 261
💰 Take Profit 1 (50%): 45 141
💰 Take Profit 2 (50%): 45 084
Thanks for checking out my post! Make sure to follow me to catch the next update. If you found this helpful, give it a like 👍 and share your thoughts 💬 — I’d love to hear what you think!
Please note: This is not financial advice. This content is to track my trading journey and for educational purposes only.

The gold market is still stuck in a solid accumulation patternWorld gold prices fell after the US's key inflation report released results that were much higher than expected.
The US producer price index (PPI) in July increased by 0.9% compared to the previous month, much higher than the flat level in June and far exceeding the forecast of 0.2%. This is the strongest increase since June 2022.
This report reinforces the view of the "hawks" in US monetary policy, who do not want the US Federal Reserve (FED) to cut interest rates soon. Compared to the same period last year, the total PPI increased by 3.3% - the highest level in 5 months and exceeded the forecast of 2.5%. Core PPI (excluding food and energy) also increased by 0.9%, higher than the forecast of 0.2%.
On a year-on-year basis, the core PPI increased by 3.7% compared to the previous 2.6%. Hotter-than-expected PPI data in July only slightly reduced the chances of a 25 basis point Fed rate cut in September, but all but eliminated the possibility of a 50 basis point cut that a few investors had previously expected.
EURUSD: Long Trading Opportunity
EURUSD
- Classic bullish formation
- Our team expects growth
SUGGESTED TRADE:
Swing Trade
Buy EURUSD
Entry Level - 1.1632
Sl - 1.1615
Tp - 1.1668
Our Risk - 1%
Start protection of your profits from lower levels
Disclosure: I am part of Trade Nation's Influencer program and receive a monthly fee for using their TradingView charts in my analysis.
❤️ Please, support our work with like & comment! ❤️

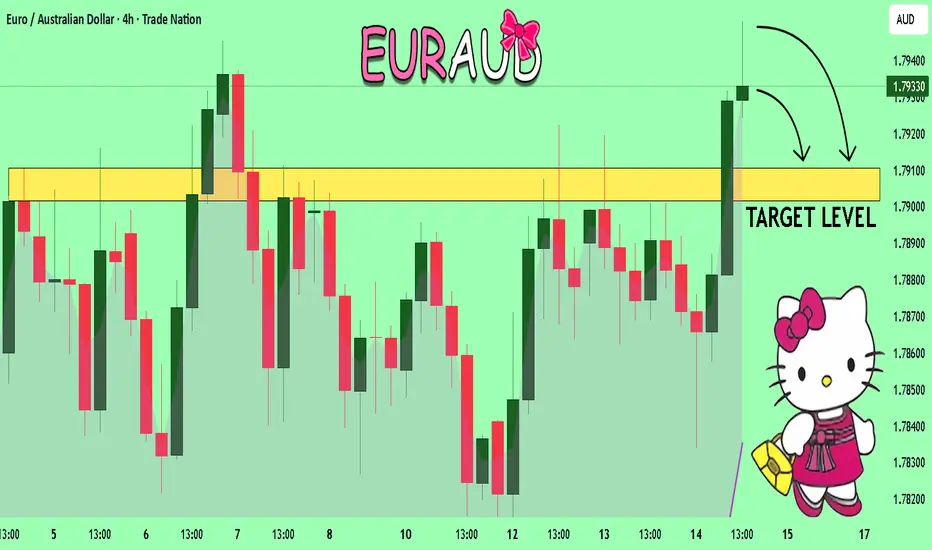
EURAUD Set To Fall! SELL!
My dear subscribers,
This is my opinion on the EURAUD next move:
The instrument tests an important psychological level 1.7938
Bias - Bearish
Technical Indicators: Supper Trend gives a precise Bearish signal, while Pivot Point HL predicts price changes and potential reversals in the market.
Target - 1.7910
About Used Indicators:
On the subsequent day, trading above the pivot point is thought to indicate ongoing bullish sentiment, while trading below the pivot point indicates bearish sentiment.
Disclosure: I am part of Trade Nation's Influencer program and receive a monthly fee for using their TradingView charts in my analysis.
———————————
WISH YOU ALL LUCK
NZDUSD: Long Trade Explained
NZDUSD
- Classic bullish formation
- Our team expects pullback
SUGGESTED TRADE:
Swing Trade
Long NZDUSD
Entry - 0.5934
Sl - 0.5929
Tp - 0.5958
Our Risk - 1%
Start protection of your profits from lower levels
Disclosure: I am part of Trade Nation's Influencer program and receive a monthly fee for using their TradingView charts in my analysis.
❤️ Please, support our work with like & comment! ❤️

NZDUSD BOY BUY SETUPWHEN PRICE break 0.5957 will be sronge signal for buying
but break 0.5954 you will should wait on price 0.5919

GOLD Technical Analysis! BUY!
My dear subscribers,
GOLD looks like it will make a good move, and here are the details:
The market is trading on 3355.1 pivot level.
Bias -Bullish
My Stop Loss - 3351.5
Technical Indicators: Both Super Trend & Pivot HL indicate a highly probable Bullish ) continuation.
Target - 3362.4
About Used Indicators:
The average true range (ATR) plays an important role in 'Supertrend' as the indicator uses ATR to calculate its value. The ATR indicator signals the degree of price volatility.
Disclosure: I am part of Trade Nation's Influencer program and receive a monthly fee for using their TradingView charts in my analysis.
———————————
WISH YOU ALL LUCK

USDJPY — Bulls on Standby for a Big Comeback!USDJPY is approaching a key confluence zone where the 🟧 daily support aligns with the long-term bullish trendline.
Price has been in a medium-term correction, but now it’s knocking on the door of a potential bullish reversal.
As long as the highlighted support holds , I’ll be looking for trend-following longs targeting a continuation of the long-term bullish structure.✅
A clear break above the short-term 🔴 channel will confirm the shift in momentum and open the door for the next 📈 impulse move.
📚 Always follow your trading plan regarding entry, risk management, and trade management.
Good luck!
All Strategies Are Good; If Managed Properly!
~Richard Nasr
Disclosure: I am part of Trade Nation's Influencer program and receive a monthly fee for using their TradingView charts in my analysis.

World gold price recoversWorld gold prices recovered, supported by the drop in the USD index to a three-week low and the decline in US Treasury bond yields in the middle of the week.
Gold and silver markets also saw buying as many Wall Street firms forecast the Federal Reserve will begin cutting interest rates in September, amid a weakening labor market and relatively low inflation.
Economists at Nomura expect the Fed to cut its key interest rate by 25 basis points at its September FOMC meeting, followed by two more cuts in December and March. The market is also pricing in this expectation, with another cut in December.
US inflation data released on Tuesday showed the core index (excluding food and energy) rose 3.1% in July compared to the same period last year, slightly higher than forecast but not considered to be worrying.

NZDJPY Will Explode! BUY!
My dear subscribers,
This is my opinion on the NZDJPY next move:
The instrument tests an important psychological level 87.665
Bias - Bullish
Technical Indicators: Supper Trend gives a precise Bullish signal, while Pivot Point HL predicts price changes and potential reversals in the market.
Target - 87.868
My Stop Loss - 87.532
About Used Indicators:
On the subsequent day, trading above the pivot point is thought to indicate ongoing bullish sentiment, while trading below the pivot point indicates bearish sentiment.
Disclosure: I am part of Trade Nation's Influencer program and receive a monthly fee for using their TradingView charts in my analysis.
———————————
WISH YOU ALL LUCK

USDCAD Set To Fall! SELL!
My dear subscribers,
My technical analysis for USDCAD is below:
The price is coiling around a solid key level - 1.3779
Bias - Bearish
Technical Indicators: Pivot Points Low anticipates a potential price reversal.
Super trend shows a clear sell, giving a perfect indicators' convergence.
Goal - 1.3755
About Used Indicators:
By the very nature of the supertrend indicator, it offers firm support and resistance levels for traders to enter and exit trades. Additionally, it also provides signals for setting stop losses
Disclosure: I am part of Trade Nation's Influencer program and receive a monthly fee for using their TradingView charts in my analysis.
———————————
WISH YOU ALL LUCK

USDJPY Under Pressure! SELL!
My dear friends,
Please, find my technical outlook for USDJPY below:
The instrument tests an important psychological level 148.39
Bias - Bearish
Technical Indicators: Supper Trend gives a precise Bearish signal, while Pivot Point HL predicts price changes and potential reversals in the market.
Target - 147.86
About Used Indicators:
Super-trend indicator is more useful in trending markets where there are clear uptrends and downtrends in price.
Disclosure: I am part of Trade Nation's Influencer program and receive a monthly fee for using their TradingView charts in my analysis.
———————————
WISH YOU ALL LUCK

EURCHF: Short Trading Opportunity
EURCHF
- Classic bearish formation
- Our team expects fall
SUGGESTED TRADE:
Swing Trade
Sell EURCHF
Entry Level - 0.9425
Sl - 0.9429
Tp - 0.9417
Our Risk - 1%
Start protection of your profits from lower levels
Disclosure: I am part of Trade Nation's Influencer program and receive a monthly fee for using their TradingView charts in my analysis.
❤️ Please, support our work with like & comment! ❤️

CADJPY Expected Growth! BUY!
My dear friends,
My technical analysis for CADJPY is below:
The market is trading on 107.09 pivot level.
Bias - Bullish
Technical Indicators: Both Super Trend & Pivot HL indicate a highly probable Bullish continuation.
Target - 107.30
About Used Indicators:
A pivot point is a technical analysis indicator, or calculations, used to determine the overall trend of the market over different time frames.
Disclosure: I am part of Trade Nation's Influencer program and receive a monthly fee for using their TradingView charts in my analysis.
———————————
WISH YOU ALL LUCK

GBPJPY The Target Is DOWN! SELL!
My dear followers,
This is my opinion on the GBPJPY next move:
The asset is approaching an important pivot point 200.10
Bias - Bearish
Safe Stop Loss - 200.28
Technical Indicators: Supper Trend generates a clear short signal while Pivot Point HL is currently determining the overall Bearish trend of the market.
Goal - 199.76
About Used Indicators:
For more efficient signals, super-trend is used in combination with other indicators like Pivot Points.
Disclosure: I am part of Trade Nation's Influencer program and receive a monthly fee for using their TradingView charts in my analysis.
———————————
WISH YOU ALL LUCK
