BTC Done corrections? I think so.Bitcoin has been on a massive downtrend, and it feels like it never ends. However, there are some good signs that the bottom could be near. First, the RSI is sooooo oversold. Usually, when the price reaches this level, it just snaps right back. The RSI is also at a key support area that held multiple times in the past. Looking at the MACD, we see bullish divergence (aka convergence). The lows get lower, but the MACD fails to get lower. That means that the bears are actually losing momentum. The volume is also picking up, which means a lot of people (and money) are showing interest.
In addition, the ABC corrections seem to be complete. I count five waves (blue) in wave C and even five subwaves (light blue; see chart below) in the fifth subwave (black) of the extended fifth wave (blue).
The fifth subwave (black) is almost exactly a 1 to 1 Extension of subwave 1 (black). That is very common fifth wave ratio and could signal the end. If I break it down even further, we see five sub-sub-sub-waves! The fifth wave is an expanding ending diagonal. What rare pattern to seal the end!
Sometimes we need to look at the big picture. We should not panic and look at the price every 5 mins if we're not day trading. We have not completed the fifth cycle wave, and I don't think we are even close to the very top.
The question is am I right? The answer is probably not. What I'm doing here is called "catching a falling knife". No one can predict the exact bottom, and I could be far from correct. There are still bearish signs. For instance, Bitcoin just broke a key support level, which happens to be the bottom line of a falling wedge. That is an extremely bad sign. Usually, you want to buy on confirmation of a breakout. That would mean Bitcoin needs break 10k.
However, for the risky and daring traders like me, this presents an interesting setup where we try to buy to bottom and make massive profits (if we're right). According to my analysis, $6230 should be around the bottom (This is just an complete guess for giggles and the memes).
Aggressive Play:
Entry: $5000-$6500
Target: $30,000
Stop:$4500
Time: Less than 6 months
Conservative Play:
Entry: Buy when Bitcoin breaks $10,000 with volume.
Target: $30,000
Stop: $9000
Time: Less that 6 months.
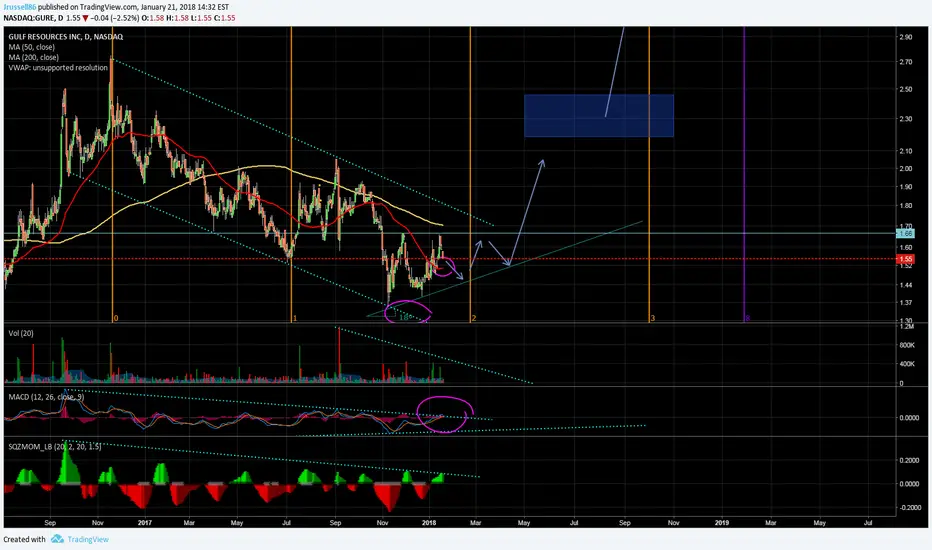
Macdivergence

Be careful with WTC - don't buy the ATHWTC has so many bearish signals right now I don't even know where to begin.
Volume divergence. WTC is rising on decreasing volume.
RSI divergence. WTC rising despite weakening RSI.
MACD divergence. WTC rising despite weakening RSI.
Then there's the elliot wave analysis, which pretty clearly shows a retrace must be imminent.
Even if you dont believe ANY of that, simple trendline analysis shows that a return to the lower trendline will occur at some point.
If you're buying this... stop.
WShort

SHORT IN EURAUDAfter broken the consolidation in 1D, the price formed an ABC Diagonal on 4H chart. We have divergence in MACD, so now I'm waiting for drop, with the target at the top of ABC.
----------------
Después de romper la consolidación en 1D, a formado en el gráfico de 4H un ABC Diagonal. Tenemos también divergencia en MACD, así que busco una caída, con un primer profit en el tope del ABC.

PLong

Ford F Positive DivergenceMinimal risk trade .5% stop loss slightly lower than the previous low at 11.88 and first target area at 12.57 with ideas of higher goals

xdn/btcpatience is the key to survival in cryptoworld. Good days are near. Need just a little more down before up. Great opportunity to buy cheap at this level.
Good Luck
XLong

Ascending triangle forming Within *8 year Symmetrical triangle.
50Dma now tilted up. *>50% Undervalued.
DCF Models put fair value @ 7.06-19.88
D/E&DA <.01; *Current Ratio≈36*
Ascending triangle forming since November brings opportunities to accumulate at safer prices. This daily formed after bouncing off bottom downtrend boundary. Ascending triangles are bullish in nature as demand line rises towards supply line, but are not reliable upward breaking patterns however they do show that sentiment may be changing and that a reversal may be near.
This Ascending triangle is forming within and near the lower boundary of an 8 YEAR symmetrical triangle.
MACD crossing above 0 on daily signalling upward momentum.


Litecoin's down time is up. UPSIDE again!?Litecoin has been down trending for some time now.
Downside is about to end, as the charts suggest.
$197 looks quite a bargain price to bounce off which is the next support level.
The next support after $197 stands at around $169 which is major and bounce of this level will be quick.
MACD has been tangled for some time bouncing back and forth the orange line and the the tangle has deepened.
RSI is converging clearly settling at around 40 from 2 oversold scenarios recently which is again a bullish sign.
Also, as the Holidays are almost up which'll also be the factor to end downtrend as the New Year begins.
Happy new year.
Let's welcome 2018 with a big bang in Crypto.
Thank you.
Happy Trading.

All cryptocurrencies due for price correctionHere is a bitcoin example.
Price has entered a falling channel which normally breaks out upward. Also, both MACD and RSI are showing divergence. Both of these added together call for a future jump up in price. As of now, price should fall to the lower supports of the channel, or that orange line in the middle.
BLong

Neo in reversal, breaking trendline soon, bullrun ahead!MACD in reversal, RSI looking good, volume is picking up.
Neo is going to break trendline soon, rising high!
Targets and timeline as indicated in the chart.
This is no financial advice,
Best of luck to you !!!
NLong

₿itcoin Cool Down and Bull TrendSeeing some small divergences on the OBV, MACD, and RSI the last push on the Bitstamp BITSTAMP:BTCUSD and Bitfinex BITFINEX:BTCUSD 15 minute. TD count shows a exhaustion cycle coming to an end soon on the 15 minute but exhaustion cycles have been unreliable on ₿TC lately. Hourly and and higher time frames don't show the divergence but do show that a cool down is needed to at least the two local support levels shown on the 15 minute PINK support lines. Volume is your friend to find which one we bounce on so stay glued to it when we approach them.
Bitfinex 15 minute indicators
Bitfinex Hourly
Bitfinex 4 hour
I am expecting a cool down and then a continuance upward. One thing to note is the volume levels have remained on par with the rally as far as the CMF is concerned. We are seeing heavy buying pressure still but do show a minor weakness in strength. I never under estimate ₿itcoin though. 27k by Near Years

AUDUSD TO BREAK RESISTANCEAUDUSD has reached both of this weeks targets while still holding a fair amount of momentum.Once again we have reached our familiar reversal zone that showed SUPPORT in early November then Resistance in late November and Early December. According to our MACD indicators we can expect a bullish divergence allowing the price to break through our targeted resistance level and rally up towards our new at around 0.76400.

GBPCHF bearish potentialBeautiful ascending channel on the daily that reacted exactly at 61.8 fib level. Also the ascending 4-hour channel with the continuous divergence on the MACD, gives good possibility for price to retest the blue bottom. In terms of fundamentals, you should be very cautious on Thursday due to Interest Rate Decisions on both currencies.
1) Never risk more than 2% of your account.
2) Try to be emotionless by applying your strategy to the pip.
3) Invest to yourself and then your capital. Try to educate yourself along with the signals and enhance your risk intelligence and your perception on how Markets work.
4) You do not have to be extremely precise to be highly profitable as long as you take the set-ups with big R/R.

Possible Expanded Flat in NZDUSDTenemos la formación ya de una corrección ABC, pero se que todavía no esta finalizada porque sigue habiendo divergencia en MACD, lo que nos confirma que será una Expanded Flat. Después de esa onda C, buscaremos una entrada en cortos en algún lugar del nuevo impulso, con un Take Profit en el -27% de Fibonacci.
-----------
We can see an ABC pattern, but I know it still not finished because there's still exist a divergence in MACD, that confirms it will be a Expanded Flat. After that C wave, I'll find an entrance in somewhere place of the new impulse, with Take Profit in -27% Fibonacci.

Perfect ending diagonal in AUDCHF, and it will go up in 3,2,1...Se nos acaba de presentar una hermosa Ending Diagonal en AUDCHF. Ya ha roto su tendencia, así que esperaré una banderita para buscar un Take Profit con Risk reward de 1 a 2.
--------------
We can see a perfect Ending Diagonal in AUDCHF. It has already broken the trend line, so I'll wait a flag to enter in long, searching a Take Profit with Risk reward of 1 to 2.

Ending Channel in EURCHFPodemos ver la formación de un ending channel, además, tenemos una fuerte divergencia en MACD, lo que indica y confirma la caída próxima en eurchf. Todavía es temprano para buscar la entrada, la semana que viene podremos encontrarla cuando haga el breakout y forme una bandera. Aproximadamente, el nuevo impulso llegará hasta el final de la flecha marcada en el gráfico.
----------------
We can see an ending channel in eurchf and, furthermore, we have a very strong divergence in MACD, that confirms the next fall in eurchf. It's still early to look for the entrance, next week we'll be able to find it, when it makes the breakout and form a flag. Approximately, the new impulse will reach the end of the arrow drawn on the chart.

1# BTC 5K or 10K ? That is the question.** Freshly in the cryptospace, Here is my coming out on what's is going with Godfather Bitcoin. Disclaimer : I am a learner ; not a technician **
-- ONE-YEAR PICTURE--
Bitcoin is in a HEALTHY, ACCELERATING BULLISH CHANNEL since March, following the exact same cycle :
1) A Quarterly 3-figures Bull Run (800% compounded YTD) that penetrates at least ONE fib level F
2) A 40% retracement from the second fib level F+1 to the fib level F-1, just between the SMA 100 & 150
I would like to confirm that it follows the last 9 month an Elliott Waves (currently ended wave 5?) & allowing ABC corrective waves. * Please correct me if i am wrong! *
-- LAST 3-MONTHS--
We are now at the consolidation phase for the (1) last bull run, started the 14th September. There are two opposites scenarios :
Scénario 1) BTC Return To 5K : RSI and MACD divergence both indicate strong bearish reversal signal et the major 8000 level ! A last quarter retracement would push BTC at the 6100 and then 5000 levels.
Scénario 2) BTC Continue To 10K : Since last week BTC price forms a Bullish Flag consolidation just below the 8000 level. that indicates upward support. Also BTC is not so overbought and DMI/MACD can support further upward movements. At the time i am writing BTC has broken the 8000 level & breakout the symetrical triangle & Bollinger squeeze at 4H and 1H.
-- WHAT AM I DOING FOR NEW YEAR ?--
Scénario 1) Track a bounce or a penetration at the 6100 level ; then Look for reversal signs & patterns Double / Triple tops / H&S ; Be prepared to BUY between 6100 and 5000 levels.
Scénario 2) Confirm 8000 level breakout at 4H ; Wait for a consolidation of the price at the Mid-8000's and track the next reversal SHORT or bull confirmation to open LONG.
PS: BTC is still fundamentaly strong : both as reserve of value for Institutionnal investors and as a reference for newcomers. I am not surprised for a Christmas at 10K
Peace out

BTC Epic Battle Long I will loose it all or HODL . This new is good for BTC .
I will bet against trends and die and get rekt probably .
PLEASE GIVE ME LIKES NEED MY 50 FOR CHAT .
-TY

Bullish Hidden DivergenceIf conservative, wait for MACD crossover before entering the trade.
I've spotted a bullish hidden divergence on BTC, along with a bollinger squeeze starting.
I expect a very strong move up in the following day or during the week.

EURTRY DAILY LOOKEURTRY --- GOLDCOLOR
EURINDEX ----TURQUOISE
SELL
MACD DIVERGENCE +
RSI + (nearly)
ADX 0 NEUTRAL
decision : neutral, must watch carefully.

AUDUSD Weekly Trade AnalysisAUDUSD > 10/8-13/17 Trade Analysis
Timeframe: 1W
Pair broke below support @ 0.7807 with MACD showing bearish divergence, expecting further decline toward 0.7727
A firm break and hold below 0.7727 would signal good possibility of further decline toward 0.7633 level.
Expecting bearish trend to continue with price needing to remain below 0.7820 for continual confirmation.
A firm break and hold above 0.7820 would indicate bearish trend is weakening. Firm break and hold above 0.7874 would serve as indication that bearish trend is complete and a reversal would come back in play.
* Personal analysis only. Please use your own rules and strategies prior to entering market.
** Forex trading involves HIGH RISK.
Before entering a trade, carefully consider your objectives, financial resources and level of experience.
