How to capture trend using MAD Indicator!📝 Description:
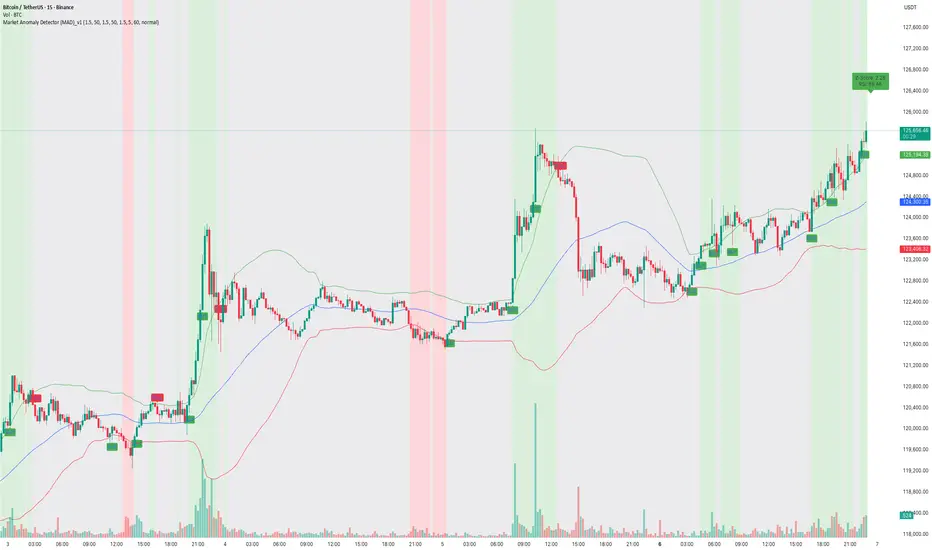
Watch how the Market Anomaly Detector (MAD) precisely captured the start of the Bitcoin breakout on the 15-minute chart — with no lag, early confirmation, and clear signals.
This BTC/USDT rally was flagged using:
• ✅ Z-Score Spike + RSI confirmation
• ✅ Volume Thrust + Trend Strength Filter
• ✅ Dynamic Zone Coloring for Visual Clarity
• ✅ Trade Cooldown Filter to avoid signal noise
💡 The green background highlights anomaly confirmation zones, while red indicates potential fakeouts or traps.
In this rally:
• The MAD indicator identified the compression breakout
• Maintained bullish zone with no false exit
• Generated a clean trend-following environment using adaptive logic.
🔍 Why MAD Works:
The MAD Indicator isn’t just about spotting anomalies — it adapts based on:
• Market volatility and relative volume
• Internal momentum using z-score logic
• Confirmation from RSI & EMAs
• A cooldown filter to prevent overtrading in choppy zones
📈 Perfect for scalpers, intraday traders, and short-term swing setups on crypto and stocks.
Madindicator
How to Use "Market Anomaly Detector (MAD)" 📊 Market Anomaly Detector (MAD) – Performance Walkthrough
🔑 Core Concept
The Market Anomaly Detector (MAD) is designed to spot both trend continuations and reversals using volatility-adaptive bands and a statistical anomaly filter.
• Trend Signals:
• ✅ Buy → when price closes above the upper (green) band.
• ✅ Sell → when price closes below the lower (red) band.
• Reversal Signals:
• 🔄 Sell → when price falls back below the upper (green) band after a breakout.
• 🔄 Buy → when price climbs back above the lower (red) band after a breakdown.
This dual-layer logic helps the indicator capture clean trending moves while also spotting failed breakouts/breakdowns.
⸻
📉 Z-Score Logic – Detecting Market Craze
The Z-Score filter measures how far price activity deviates from its normal behavior:
• 📈 Z > +1 → Market shows bullish strength / craze.
• 📉 Z < –1 → Market shows bearish strength / craze.
• ⚖️ Between –1 and +1 → Market is in neutral / low-momentum mode.
🔎 Current Snapshot (Weekend Session):
• Z-Score = –0.52 → clearly reflects very low momentum.
• Volume is also weak, as is typical during weekends.
• Despite low activity, MAD still adapts and keeps traders aligned with the actual statistical condition of the market.
⸻
🟢 Bullish Examples
• Captured breakout above 118K → 123K with clear momentum.
• Z-Score crossed +1 confirming bullish craze.
🔴 Bearish Examples
• Detected reversal near 121K → 116K with breakdown signals.
• Z-Score dipped below –1, validating the downside momentum.
⸻
🛠 How to Use
1. Look at band breakouts/breakdowns for trade triggers.
2. Watch Z-Score:
• Above +1 → only take bullish signals.
• Below –1 → only take bearish signals.
• Between –1 & +1 → reduce exposure / trade smaller size.
3. Works best on 15m / 1h / 4h with additional filters (VWAP, volume, S/R).
⸻
🎯 Summary
The Market Anomaly Detector (MAD) combines price bands with Z-Score statistics to give traders a 360° view of both market direction and market strength.
• 📊 Captures trends.
• 🔄 Detects reversals.
• ⚖️ Adapts to low-momentum phases (like weekends).
This balance makes MAD a versatile tool for traders who want to stay ahead of both momentum moves and false breakouts.
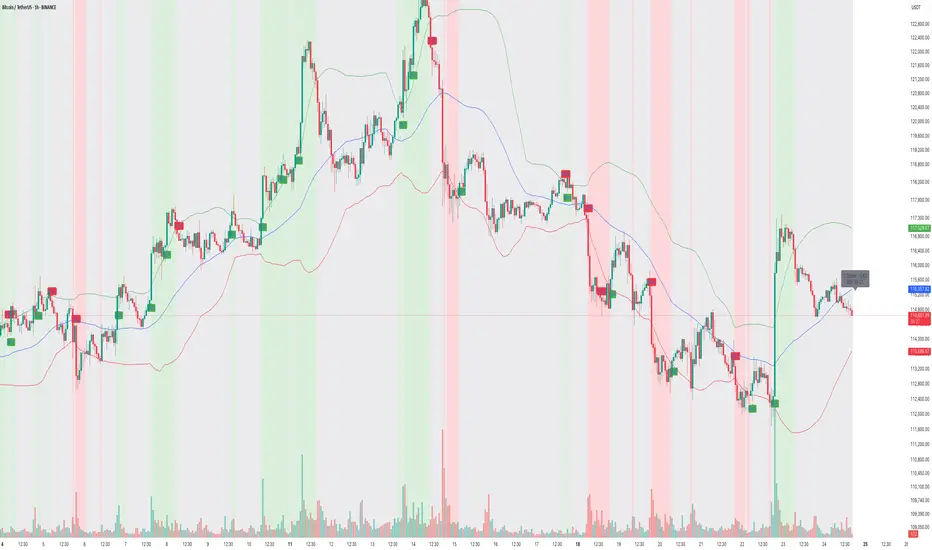
How to Capture Market Turns with Market Anomaly Detector (MAD)Overview
The Market Anomaly Detector (MAD) Indicator effectively captures market reversals , trend shifts , and volatility cycles through its distinctive visual components—the Mainline ( blue ), Upper Band ( green ), and Lower Band ( red ). This idea explores the practical performance of the MAD indicator, emphasizing its clear signals during recent market movements.
How It Works
Mainline (Blue Line)
Static reference line used to visually represent general market sentiment.
Not directly used for generating trading signals, but provides contextual information.
Upper Band (Green Line)
Serves as a critical threshold for bullish signals.
When price closes above this green band, a buy signal is generated, and the background turns green, indicating bullish sentiment.
Conversely, if price closes below the green band after initially trading above it, a sell signal is triggered, highlighting a potential reversal.
Lower Band (Red Line)
Serves as an essential threshold for bearish signals.
When price closes below the red band, a sell signal is generated, accompanied by a red background, signaling bearish momentum.
Alternatively, if price closes above the red band after initially trading below it, a buy signal is produced, pointing to a possible bullish reversal.
Performance in This Case Study
Signal Accuracy & Market Reactions
Buy signals consistently appeared after price closed above the upper (green) band, accurately predicting bullish expansions.
Sell signals were reliably produced when the price closed below the lower (red) band, accurately forecasting bearish trends.
Reversal signals, generated when the price crossed back below the upper band or above the lower band, successfully indicated shifts in market sentiment.
Volatility Dynamics
Contraction of bands during sideways market phases clearly indicated reduced volatility and market indecision.
Expansion of the bands provided timely alerts of upcoming sharp market movements.
Effective Reversal Indications
The MAD indicator clearly marked points of market exhaustion at upper and lower band extremes, providing timely entry and exit signals.
The signals effectively filtered out false breakouts by ensuring clear price action beyond band thresholds.
Key Takeaways
✅ Upper Band (Green Line): Closing above signals bullish entries; closing back below indicates bearish reversals.
✅ Lower Band (Red Line): Closing below indicates bearish entries; closing back above highlights bullish reversals.
✅ Mainline (Blue Line): Provides visual market sentiment context but is not used directly for signal generation.
✅ Band Behavior: Contraction signals low volatility periods; expansion indicates imminent significant moves.
✅ MAD Indicator demonstrated accurate and reliable market reversal and momentum shift detection in the case study provided.
