We probably boutta finna make hella coin boisListen. Bitcoin can't just crash. We boutta make finna coin. Just look at all the colorful lines I drew on my graph. Full invest amigos. We're about to make hella bank.
MAKE

Bitcoin fake out or make out? $8.3k?? [BTFD]quick chart to show some important changes with the indicators after the lil boom towards $7k
mega squeeze or does this have momentum to go higher?
gotta close above 6800 on the daily to get bulltarded dreams back again
the nice collection of rather swish indicators showing a very good signs of a change towards the upside and further gains would bring a golden cross, all good signs for TA based trading
bless ya trades :)

Make or Break for Bitcoin in week of 16th July 2018 [BTFD]Looking at four hour chart on Bitcoin/USD we see over the weekend it good bounced from around the 0.618% fib level...
The new Cycle of Power Indicator is showing a change from bearish to bullish conditions and the RSI coming into the overbought levels - this is shown by the change of colour of the line to grey
We also have a Death Cross on a 55/100MA that has just formed
So very mixed signals for bitcoin starting this week, if the 0.618% fib level holds and some buying momentum takes us up over 6800 during the week, then we may see some gains and be good for longs, firstly 6400 need to be broken and established as a floor support and solid buying action as the week starts and then going up to 6600 and above....
IF the 0.618% fib level breaks (currently around 6180 area) then most likely we will be back in power with the Bears and price will come down to touch just below $6,000, even going as low as 5800 area, now if buy support is strong and this does play out we will examine the market after we see the moves that start the week
weekday markets open 10pm GMT +1, so get used to checking the price and movement once the institutions are back on the board and moving pieces around, expect a few squeezes along the way
i'm calling neutral for this chart but im kinda leaning towards the bearish scenario, the psyche levels of 6300 and 6200 are pretty important, so keep eyes peeled on these levels of support and watch for opposite from 6600 & 6800


beautiful fibonacci hi guys whats up
The daily chart gives us more positive than the weekly timeframe by the way you have more time to make your resolution
if we look at the green resistance line we can see following signals
so it's hard to make your resolution at this point but it can be easy if >>>>>> the wave broke the green resistance line ( yellow line )
if not >>>>> ( red line )
follow me for more analysis


moving towards a major make-or-break pointafter the last rejection from the downtrend lin, we now move towards a major make-or-break point.
If we break the downtrend we could see return to the 61.8 % mark, otherwise a fallback to 50% mark is very likely.
As always: No financial advice, just some ideas!

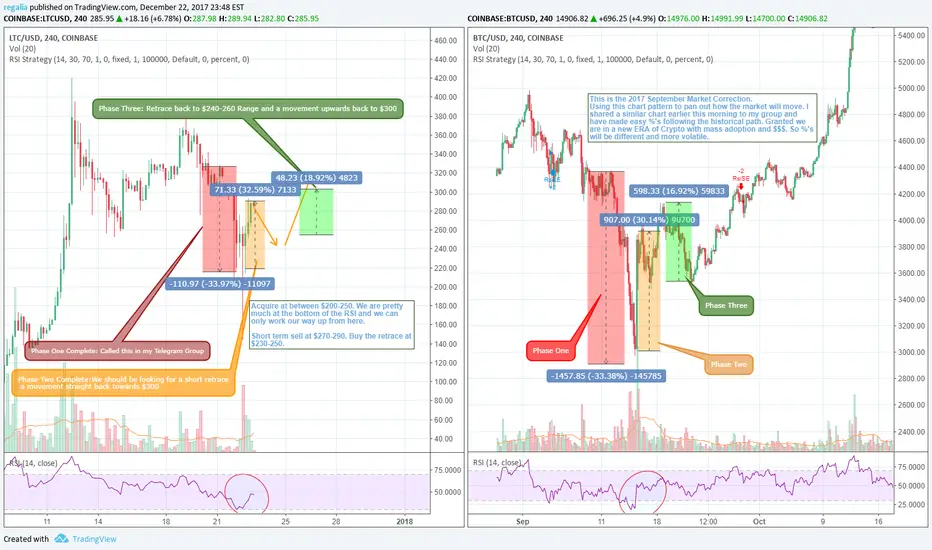
Market Corrected. Where to go from here and how to make $$$Hi Everyone,
Hope you are all doing well and have accumulated a healthy amount of coins. I am basing this current chart off of the 2017 September Market Correction to anticipate how markets move. Because if its one thing about stocks/crypto...markets always have patterns. While it is not exactly apples to apples (comparing LTC to BTC charts). LTC is currently following BTC's movements.
I have already notified my telegram group of this trade early morning and have netted today's %'s. We have already seen Phase one complete this morning, and in the tail end of Phase Two. with LTC rising to $290. Sold...retraced to $240 and on the rise to $290. What we can expect is another retrace back to $250-260 area and a final movement upwards north of $300 resuming a 45 degree trajectory growth.
I have also included my BTC chart that I dropped several hours ago which essentially states the similar theory.
Short Term Trades: Accumulate $250 and below sell at $300. Wait for Retrace, buy back in and hold for north of $300.
Long Term Trades: Anything closer to the low $200's is a great position to build and generate north of 100% ROI in the next month or so, as LTC progresses to attach previous ATH of $420 and the bigger goal of $500.
Good luck on all of your trades. I didnt explain this trade as much but feel free to PM/comment if you have any questions.
Merry Christmas & Happy New Year!
Regalia
Augur Buy signalThis is my idea on augur waiting for it to break the .00822 range
goto my youtube channel for crypto trading video www.youtube.com

How to profit online? Make Money Online There are numerous approaches to profit online now a day. Individuals who are having sound information about the web and have PC aptitudes can without much of a stretch procure cash from the web. There are various approaches to gain this online cash. We are going to talk about a portion of the focuses with the goal that you can likewise be a piece of this online salary.
Future plan tips, How To Make Money Online
You can attempt to offer things on the web. This is one of the least complex approaches to gain cash. On the off chance that you have great offering aptitudes, then you can ace yourself in gaining cash. You can create a perfect wellspring of salary for a long traverse of time.

My Blog The future plan tips From this blog site you all blog information,future plan tips,and How To Make Money Online,bookmarking site list,web submission site list,ping site list will get here.

USDCAD POTENTIAL LONGS (AGAINST TREND BUT WORTH IT)USDCAD -61.8% EXTENSION FULFILLED REACHING THE WEEKLY LOW
FALLING WEDGE ON THE 1 HOUR AND 2 HOUR CHART INDICATES A BULLISH REVERSAL COMING SOON
SEVERE 1 HOUR AND 2 HOUR MACD DIVERGENCE
ENTRY NOW OR UPON A BREAK OF THE TL OF THE WEDGE TO GO LONG ALL THE WAY TO 1.31500
MASSIVE RISK/REWARD HERE
WORTH THE RISK AGAINST THE TREND

USDJPY SHORT IDEA 1:2 USDJPy has pushed through horizontal level @ 109.68 to now test strong daily trend line currently seeing indecision.
if price can break below 109.85 showing strong continuation... looking to take short a position with stops at previous 8 hour candle high 110.48
1:2 targets

ANOTHER CHEAT CODE TO MAKE MONEY GO LONG BUY BUY BUYANOTHER CHEAT CODE TO MAKE MONEY GO LONG BUY BUY BUY

KMI -Kinder Morgan Warren Buffett keeps adding to his bets on the oil industry
Berkshire owned about 26.53 million Kinder Morgan shares worth roughly $395.9 million at year end, according to a U.S. Securities and Exchange Commission filing detailing its U.S.-listed stock investments.
Kinder Morgan is a company headquartered in downtown Houston, Texas. It is the largest energy infrastructure company in North America.
Kinder Morgan owns about 180 terminals that store and handle products such as gasoline, coal, and petroleum coke. Kinder Morgan's CO2 division provides carbon dioxide (CO2) for enhanced oil recovery projects in North America.] In 2014, a third of the natural gas that moved in the United States passed through a Kinder Morgan asset.

SP500 CRASH ?IT JUST A CHART AND U CAN PREDICT IT !
LOOK TO SP500 WEEKLY CHART
MY TARGET ON 2016 - 1600
TAKE CARE TRADERS

AUDUSD SELL LIMIT Hello , again audusd will make surprise for us !
Im waiting price around 0.7100-0.7150 for sell
Also u can put there sell limit
Good luck

