#MANA/USDT 1HOUR UPDATE BY CRYPTOSANDERS Hello, community members welcome you all to this MANA/USDT 1hr chart analysis.
mana/usdt1hour analysis and cup and handle complete and buy green zone.
leverage:-5x to 10x leverage
entry:-$1.11,$1.16
target:-60% to 80%
stoploss:-0.9910
Remember: This is not a piece of financial advice. All investment made by me is at my own risk and I am held responsible for my own profit and losses. So, do your own research before investing in this trade...
happy trading...
thank you...
MANABTC

PREPARING FOR A MANA LONG Looking at the MANA/USDT pair today, Lets get it!
Chart above us shows that we have a first wave extension impulse in play. As shown by the first fibonacci tool, we found support at the .382 region marking the end of wave 2 and made new ath's at the 1.5 fib region(just under the 1.618) for a wave 3 top before clearly getting rejected as shown by the 2nd fibonacci retracement tool.
Currently still in the correction phase of wave 4, MANA seems to be baiting everyone into buying and longing here, however the chart below shows us with the angles presented that this isnt the bottom and that we will most likely still go to the bottom of the ascending channel before getting a reversal for our wave 5 impulse
Once we confirm our Wave 4 bottom, target for our wave 5 will be the touch of the channel resistance once more and should be inline with either the 1.9 or 2.0 fib resistance, leaving us with a price target in the range of $15-20 depending on how early we can achieve that.
If you agree with this idea, leave a like and share your thoughts in the comments
Feedback is always appreciated.

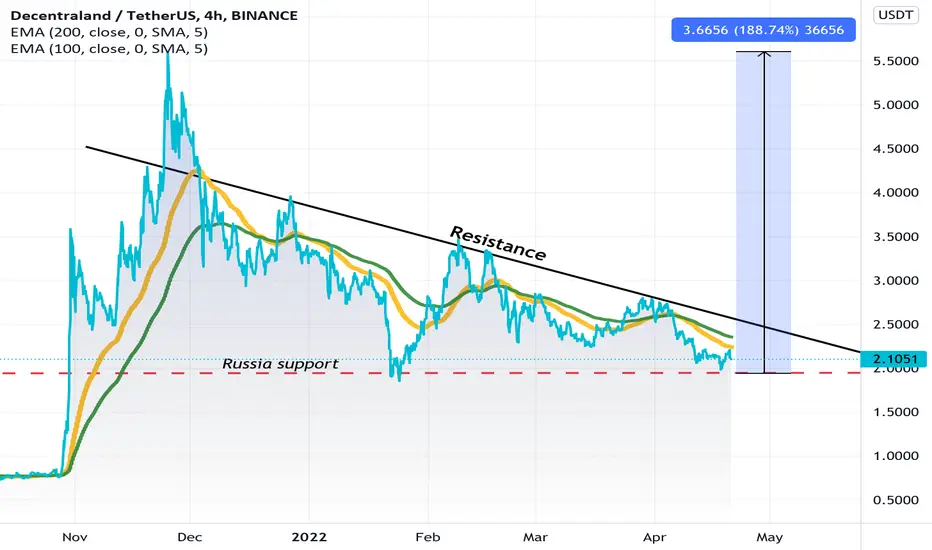
MANA MACRO ANALYSIS - (DECENTRALAND)Happy New Month Everyone.
We will be looking at MANA/USDT today.
In our past analysis we managed to predict the drop on mana and identified areas to get into a long position, however price missed by a few digits (need to learn to market buy more often). Today we will have another go at longing mana.
As you know the last analysis was based off the First Wave Extension Theory which still remains the same. You can read up on the previous analysis for more details:
Current Analysis:
Not much to explain really. Judging by the chart above, we can expect price to make new ath's this year around early July to September depending on how Bitcoin & Ethereum behave in weeks to come.
Longest duration for price to peak was the 1st wave which having the highest %growth makes sense, followed by a correction of -77%.
Wave 3&4 have had similar timeframes to conclude their tops and bottoms, as well as -70%+ corrections, so we can expect the same for wave 5.
PS: I was expecting a drop to the 1.6 region in January with 1.3 being the worst case scenario, try and keep that in mind and remain on guard. Other than that, I'm happy to average in at these prices.
If you agree pls leave a like and share your views as well in the comments.
Feedback is always appreciated.

DecentralandMANA/USDT comming pushing down trend and i waiting until 1$ and waiting for retest if not support on 1$ next target is 0.70
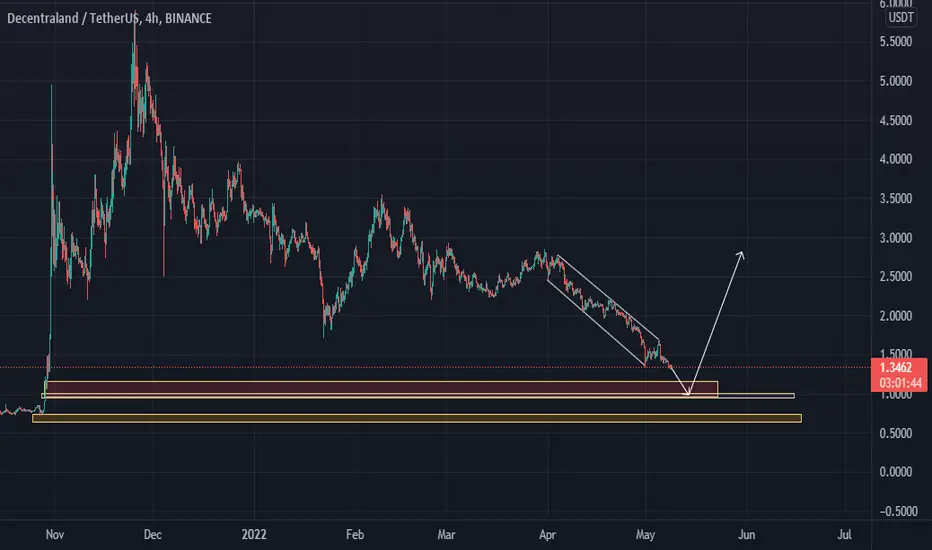
MANA/USDT ANALYSISMANA is been strongly trending downwards and reached major support zone of $1.60 - $1.70. Price looks pretty bearish, so it might gonna break below this. Price will continue the trend down till $1.08 - $1.21 major support level. No buy in #MANA until next major support.

MANA Best Time For BuyMana is currently on the important trend line support and static support and is suitable for a shopping step. If this range is maintained, the price will increase, otherwise losing this range is the second step to buy the point specified in the chart.
Its not Buy or Sell SIGNAL
DYOR
BY : Mohamad Teriz - @AtonicShark

MANA Complex Inverse Head and Shoulders Pattern We are seeing MANA printing a Complex Inverse Head and Shoulders Pattern on both MANAUSDT and MANABTC, once it breaks the neckline, we will have a very good trade opportunity with risk reward ratio of approximately 5:1
###NOT FINANCIAL ADVICE###

MANAUSDT, We are moving in downward trendHello everyone
Mana is one the most powerful project that is working on Metaverse . Before any do in market and buy anything go and check fundamental of project then gambling on your capital.
According to the chart, the price is moving in downward trend and this means that the price desire to go more down and we expect that if this downward trend wanna continue the price can reach to the PRZ Level and that point the price has support and has some movement to upwards but until the trend isnt change to upward it better to dont take any long position for long time .
Dont forget use stop loss if you wanna take short position from here and observe to your capital management
If you anyone have question can ask us to help yourself
Be lucky guys
Abtin
Previous analysis :


Decentraland (MANA) - April 9hello?
Welcome, traders.
By "following", you can always get new information quickly.
Please also click "Like".
Have a nice day.
-------------------------------------
(MANAUSDT 1W chart)
2.2 or higher: Expected to create a new wave.
(1D chart)
(buy)
- After confirming that it is supported in 2.2 or higher
(Stop Loss)
- When it falls below 2.1178 and receives resistance
(Sell)
- When resistance is received in the range of 3.2690-3.6862
- When receiving resistance near 4.9455
If it rises above 2.9026, a sharp move is expected, so trade cautiously.
------------------------------------------------------------ -----------------------------------------------------
** All indicators are lagging indicators.
Therefore, it is important to be aware that the indicator will move accordingly as price and volume move.
However, for the sake of convenience, we are talking in reverse for the interpretation of the indicator.
** The MRHAB-O and MRHAB-B indicators used in the chart are indicators of our channel that have not been released yet.
(Since it was not disclosed, you can use this chart without any restrictions by sharing this chart and copying and pasting the indicators.)
** The wRSI_SR indicator is an indicator created by adding settings and options to the existing Stochastic RSI indicator.
Therefore, the interpretation is the same as the traditional Stochastic RSI indicator. (K, D line -> R, S line)
** The OBV indicator was re-created by applying a formula to the DepthHouse Trading indicator, an indicator disclosed by oh92. (Thanks for this.)
** Support or resistance is based on the closing price of the 1D chart.
** All descriptions are for reference only and do not guarantee a profit or loss in investment.
(Short-term Stop Loss can be said to be a point where profit and loss can be preserved or additional entry can be made through split trading. It is a short-term investment perspective.)
---------------------------------

MANAUSDT 6HMANAUSDT After a deep correction in the daily time frame, it is now pressed in the triangle and is ready to move towards the desired goals.
👤SecondChanceCrypto
📅5.april.22
⚠️(DYOR)

MANA giant rising wedgeMANA / USDT
In high time frames
We can see giant rising wedge pattern
If trendline support hold for next days
Expecting a strong bounce
Keep in mind we still have strong resistance (red color ) in my chart ONLY after crossing it mana will be ready to do massive jump like in past
Best of wishes

MANA AnalysisOn the left the USD pair demonstrates very bullish behavior, the 21SMA shows growth when in contact with the larger Gaussian Channel
On the right the BTC pair also shows some bullish transition behavior, in which a previous resistance has turned support.

LONG MANAUSDT can be a good option? A good entry Point would be at the local support.
for the next breakout.
Keep watching ..!
Follow for more ..!
Give a thumbs up if you like it.

MANA ranginMANA is really ranging, on the 15min 1 hour, 4 hour. Id expect a breakout as long as bitcoin behaves.

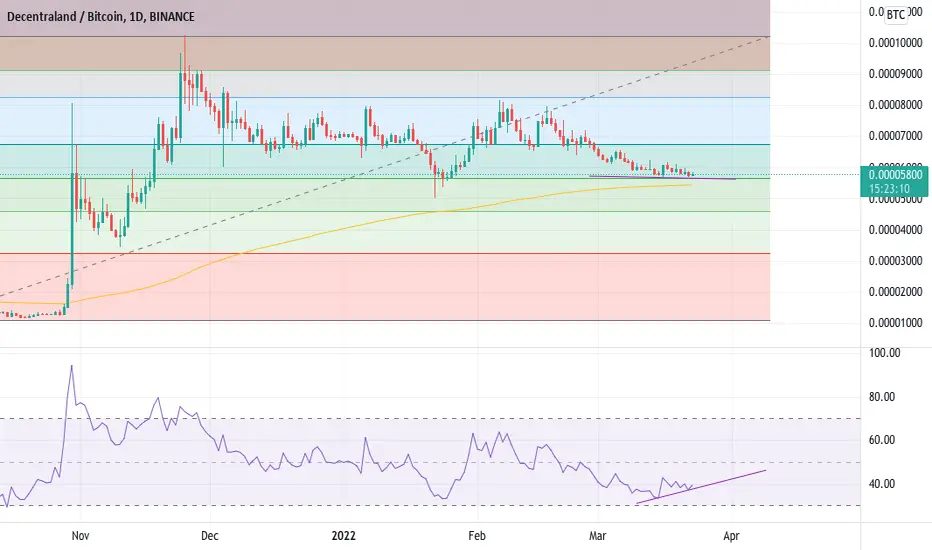
MANA/BTC pair at support?MANA/BTC pair at support?
Looks like theres a weak bullish divergence also, albeit the RSI did fully go oversold.
At the 0.5 fib not fib line lol, so the initial bull trend is still in tact.
also at the 200 ema which might serve up as support.
MANA/USDT Technical Analysis Chart#MANA/USDT TA Update:-
$MANA currently trading at $2.45
As per chart also same fractals like previous breakout.
Bullish Flag also forming.
Breakout Point = $3
If Breakout then Targets = $5/$10/$12
Support:- $2
If break down $2 then $1.70 could be best entry.
Always wait for confirmations.

MANA USDT set for a completion of wave B?We are expecting a completion on wave B from Mana
It it play out as expected then the upside
will be massive profit for us
trade with stoploss

A Small Trade With ManaIn Very uncertain Market We have Small Trade for Trying
I am Not A Financial Adviser. And All Cherts Are Just My Study. So Please Do Your Own Search before open Any Trade.
If You Like My Work Just Come and Join Me.

MANAUSDT - SETUPMANAUSDT price posting a good breakout in a short timeframe but is it sustainable? It purely depends on market sentiment and bull behavior. If they sustain they can easily target the next resistance area. If not then we could see more sideways movement.

MANA - Long Term / Outlook ⚪️Let's see how MANA is behaving.
This is a 1D chart. (Long Term)
Red area:
Key resistance, which
has been controlling the price since Nov 2021.
Blue area:
Consolidation channel
Price has been moving sideways inside this
channel and confirmed it as our safe
price range.
Green area:
Essential support
has been confirmed and tested.
Be careful because this level is being tested
again, and the market isn't strong
enough.
We might see it break down.
Support levels: $2.1879
Resistance Area: $3.5430
Bollinger Bands can work as support and resistance too. Here is an example:
The market is showing STRONG SELL volumes for MANA.
Two resistance levels push down on value, and one support level holds the price high and shows strength. The higher band can work as resistance.
The Middle Bollinger Band can push down the value, and the Lower band pushes the price up.
If the price crosses the local resistance and stays above it for confirmation, we can open our long positions, aim for the next resistance, and use it as a TP point.
The RSI shows that MANA is below the 50 levels, the center.
If you want to know how the RSI indicator works, take a look at this Educational Idea. It'll help you have better readings:
Current Market Price: $2.5565
Let me know your ideas.
Good luck.
