Buy the Rumor and Sell The NewsMarkets move before information becomes official because positioning always precedes confirmation. By the time news is released, expectations are already priced in. “Buy the rumor” describes this positioning phase, where capital reallocates based on anticipation rather than facts.
Traders who act only on confirmation arrive when risk is highest and asymmetry is lowest.
Rumors form when uncertainty exists and narrative fills the gap. Expectations about events, data, upgrades, or macro decisions begin circulating long before outcomes are known. During this phase, liquidity is thin and positioning builds gradually. Price advances not because certainty exists, but because participants want exposure before clarity removes opportunity.
As the rumor spreads, price often trends cleanly. Pullbacks are shallow, momentum holds, and dips are bought quickly. This is not because the outcome is guaranteed, but because risk is perceived as acceptable relative to potential upside.
The danger appears near confirmation. When the news becomes official, uncertainty collapses. Everyone knows the outcome, and participation peaks. Liquidity increases sharply as late buyers enter and early participants begin exiting. This is why markets frequently stall, reverse, or distribute immediately after positive news. The trade was never about the event itself. It was about positioning ahead of it.
Selling after confirmation is not manipulation. It is inventory management. Capital that entered early needs liquidity to exit. News provides that liquidity. When expectations are fully priced, continuation requires new incentive, not old information.
The practical takeaway is not to trade headlines. It is to observe behavior before them. Watch how price reacts during anticipation. Strong trends with controlled pullbacks suggest accumulation. Choppy price with sharp spikes suggests distribution forming. When confirmation arrives, reassess rather than assume continuation.
“Buy the rumor” works because markets move on expectations and pause on certainty. Traders improve when they stop reacting to news and start reading how the market positions itself in advance. The edge lies in understanding when probability is expanding and when it has already been spent.
Manipulation

Weekly starting high / sell-side liquidity zoneWe see a clear bullish trend structure at the start of the week to accumulate and reach institutional sell zones to look for sells; we have a clear accumulation that could be manipulated to generate a reversal of this trend. Furthermore, everything aligns with the other JPY analysis across other pairs, suggesting that JPY could gain strength today.

SILVERS ANTICIPATED SELL OFF / EMOTIONS OF RETAILJust look ...🤦♂️
..................................................................................................................................................................................................................................................................................................................................................................

SOLUSDT M15 Discount Reaction and Bullish Continuation Setup📝 Description
BINANCE:SOLUSDT is currently trading inside a short-term discount zone after a corrective pullback, following a previous impulsive bearish leg. Price is reacting from a 15-minute Fair Value Gap while holding above sell-side liquidity, suggesting absorption and a potential bullish continuation toward higher intraday PD arrays.
________________________________________
📈 Signal / Analysis
Primary Bias: Bullish
Preferred Setup:
• Entry: 127.08
• Stop Loss: Below 126.80
• TP1: 127.39
• TP2: 127.86
• TP3: 128.23
________________________________________
🎯 ICT & SMC Notes
• Price reacting from an unmitigated 15m FVG
• No bearish BOS confirming continuation to the downside
• Structure supports a corrective move transitioning into bullish expansion
________________________________________
🧩 Summary
CRYPTOCAP:SOL shows signs of stabilization after mitigating sell-side liquidity and respecting a short-term discount zone. As long as price remains above the 15m FVG, the bullish continuation scenario remains favored with upside targets aligned toward intraday premium zones.
________________________________________
🌍 Fundamental Notes / Sentiment
Short-term crypto sentiment remains constructive, with rotational inflows supporting high-liquidity altcoins. In the absence of negative catalysts, pullbacks into discount zones are more likely to resolve higher rather than extend lower.
________________________________________
⚠️ Risk Disclosure
Trading involves substantial risk and may result in capital loss. This analysis is for educational purposes only and does not constitute financial advice. Always apply proper risk management, predefined stop-loss levels, and disciplined position sizing aligned with your trading plan.

GBPUSD M30 HTF FVG Rejection and Bearish Continuation Setup📝 Description
GBPUSD on the 30-minute timeframe has impulsively rallied toward the higher-timeframe Fair Value Gap (H1 FVG) and is now trading in close proximity to this premium area. While price has not yet fully mitigated the FVG, the approach into this zone raises the probability of a bearish reaction and downside rotation.
________________________________________
📈 Signal / Analysis
Primary Bias: Bearish below the H1 FVG
Preferred Setup:
• Entry: 1.3527
• Stop Loss: Above 1.3541
• TP1: 1.3510
• TP2: 1.3497
• TP3: 1.3483
________________________________________
🧠 ICT & SMC Notes
• Liquidity taken above recent highs (buy-side sweep)
• No strong bullish continuation or acceptance above value
• Downside targets align with internal sell-side liquidity
________________________________________
📌 Summary
As long as price remains below the H1 FVG and fails to reclaim higher structure, the bearish continuation scenario remains favored with expectations of a rotation toward lower liquidity pools.
________________________________________
🌍 Fundamental Notes / Sentiment
With USD maintaining relative strength and no strong bullish catalysts for GBP, near-term downside pressure remains likely, especially if upcoming data supports a risk-off tone.
________________________________________
⚠️ Risk Disclosure
Trading involves substantial risk and may result in capital loss. This analysis is for educational purposes only and does not constitute financial advice. Always apply proper risk management, predefined stop-loss levels, and disciplined position sizing aligned with your trading plan.

Silver M30 HTF Liquidity Sweep and Bullish Continuation Setup📝 Description
TVC:SILVER on the M30 timeframe remains within a broader bullish structure after completing a corrective pullback into a higher-timeframe demand area. Price has respected the H1 order block and is now consolidating above value, suggesting preparation for another expansion leg to the upside.
________________________________________
📈 Signal / Analysis
Primary Bias: Bullish while price holds above the H1 order block and recent higher low
Preferred Setup:
• Entry: 94.246
• Stop Loss: Below 93.606
• TP1: 95.240
• TP2: 95.871
• TP3: 96.858 (HTF liquidity / trend continuation target)
________________________________________
🎯 ICT & SMC Notes
• Market is holding above a valid H1 order block
• Recent sell-side liquidity has already been swept
• Upside targets align with buy-side liquidity and trendline expansion
________________________________________
🧩 Summary
As long as price holds above the H1 demand zone, Silver is expected to continue its bullish rotation toward higher buy-side liquidity levels. Pullbacks into value are considered continuation opportunities rather than reversals.
________________________________________
🌍 Fundamental Notes / Sentiment
Precious metals remain supported under mixed risk sentiment and hedging flows. Any renewed weakness in the US dollar or increase in macro uncertainty may further accelerate upside momentum in Silver.
________________________________________
⚠️ Risk Disclosure
Trading involves substantial risk and may result in capital loss. This analysis is for educational purposes only and does not constitute financial advice. Always apply proper risk management, predefined stop-loss levels, and disciplined position sizing aligned with your trading plan.

SUI H4 AMD Distribution Phase, Expecting Sell-Off Toward H4 FVGs📝 Description
SUI on H4 has completed a clear AMD cycle. After a prolonged Accumulation, price expanded into Manipulation and is now trading inside the Distribution phase. Recent price behavior shows weak follow-through on the upside, signaling exhaustion rather than continuation.
________________________________________
📈 Analysis (Scenario-Based | Non-Signal)
With the market now firmly in Phase 3 (Distribution), downside probability increases.
• Failed upside continuation confirms distribution behavior
• Price rejection inside the range suggests smart money offloading
• Draw-on-price shifts toward unfilled H4 FVGs below
As long as price remains capped below the distribution high, any short-term bounce is viewed as corrective, favoring continuation lower.
________________________________________
🎯 ICT & SMC Notes
• Complete AMD structure confirmed
• Distribution phase active
• H4 FVGs below acting as downside magnets
________________________________________
🧩 Summary
SUI has transitioned into the Distribution phase of AMD, which historically precedes downside expansion. With no structural bullish confirmation, the higher-probability path favors a rotation lower toward H4 FVGs, aligning with smart-money distribution rather than accumulation.
________________________________________
🌍 Fundamental Notes / Sentiment
SUI remains risk-sensitive. With no fresh bullish catalyst and fading crypto liquidity, conditions favor the Distribution phase and a move toward lower H4 FVGs rather than continuation higher.
________________________________________
⚠️ Risk Disclosure
Trading involves substantial risk and may result in capital loss. This analysis is for educational purposes only and does not constitute financial advice. Always apply proper risk management, predefined stop-loss levels, and disciplined position sizing aligned with your trading plan.

XRPUSDT M15 Liquidity Sweep and Corrective Bullish Setup📝 Description
XRP swept short-term sell-side liquidity on M15 and is now stabilizing above the local demand zone. The current move appears corrective after the sell-off, suggesting a potential bullish reaction toward nearby imbalance levels.
________________________________________
📈 Signal / Analysis
Primary Bias: Bullish while price holds above the M15 liquidity sweep low
Preferred Setup:
• Entry: 2.063
• Stop Loss: Below 2.057
• TP1: 2.074
• TP2: 2.082
• TP3: 2.088 (M30 FVG / descending trendline reaction)
________________________________________
🎯 ICT & SMC Notes
• Clear sell-side liquidity sweep on M15
• Price holding above local demand confirms reaction potential
• Upside targets aligned with unfilled FVG levels
________________________________________
🧩 Summary
As long as price remains above the swept liquidity low, XRP is positioned for a corrective bullish move toward higher PD arrays.
________________________________________
🌍 Fundamental Notes / Sentiment
No immediate negative catalyst affecting XRP sentiment. In a neutral crypto environment, short-term liquidity-driven rebounds remain technically supported.
________________________________________
⚠️ Risk Disclosure
Trading involves substantial risk and may result in capital loss. This analysis is for educational purposes only and does not constitute financial advice. Always apply proper risk management, predefined stop-loss levels, and disciplined position sizing aligned with your trading plan.

ICHR: Algorithmic Accumulation - $25 Liquidity as DestinyThe recent, violent sell-off in ICHR, while seemingly aligned with broader market weakness, presents the classic signature of a sophisticated, high-timeframe liquidity purge. From an Interbank Price Delivery Algorithm (IPDA) perspective, this is not a fundamental breakdown but rather a calculated maneuver to engineer liquidity for a substantial repricing event to the upside.
The Grand Narrative:
The algorithm's primary directive is to seek and neutralize liquidity. On this weekly chart, the most obvious and compelling target is the pool of buy-side liquidity resting above the "Equal Highs" at approximately $25.50. These levels act as a powerful magnet for price, representing a concentration of buy-stops from breakout traders and short-sellers' stop-losses. The entire price narrative developing over the past year can be understood as a campaign to eventually raid this objective.
The Manipulation: Engineering the Fuel
To facilitate a powerful move towards the $25.50 target, the algorithm requires fuel. This fuel is the sell-side liquidity resting below the established consolidation range lows (around $16.00). The recent sharp decline was the engineered event to raid this liquidity. By driving price down aggressively, the algorithm achieves two critical objectives:
It triggers the stop-losses of existing long positions, creating a cascade of sell orders.
It induces a fresh wave of bearish sentiment, encouraging new short positions.
Large institutions can then absorb this wave of selling, accumulating their long positions at a deep discount in anticipation of the true expansionary move.
The Final Purge: One More Sweep?
It is crucial to acknowledge that the algorithm may not be finished with its accumulation. Before the true rally begins, there is a significant probability of one final, sharp sweep below the recent low near $14.50. This would be the ultimate "spring" event—a move designed to create maximum fear, cleanse any remaining weak-handed longs, and trap the last of the sellers before a violent and sustained reversal. A swift rejection from below this level would be the highest form of confirmation for the bullish thesis.
The Thesis
The current price action is interpreted as the final stage of a long-term accumulation model. The invalidation of this idea would be a sustained acceptance and weekly close below the critical lows without any sign of a powerful reclaim. The logical target, based on the algorithm's unyielding need to balance the books, remains the equal highs at $25.

Dow Jones Industrial Average H1 HTF FVG Support and Continuation📝 Description
CAPITALCOM:US30 is holding above a higher-timeframe H4/H1 demand zone after a corrective pullback from recent highs. Price respected the BPR and FVG support area and is now stabilizing, suggesting the move is corrective rather than a trend reversal.
________________________________________
📈 Signal / Analysis
Primary Bias: Bullish while price holds above the H1 BPR.
Preferred Setup:
• Entry: 49,130
• Stop Loss: Below 49,050
• TP1: 49,240
• TP2: 49,380
• TP3: 49,520 (HTF draw / higher liquidity)
________________________________________
🎯 ICT & SMC Notes
• Reaction from H4/H1 BPR confirms valid demand
• No bearish HTF BOS observed
• Upside liquidity above recent highs remains the primary draw
________________________________________
🧩 Summary
Dow Jones Industrial is consolidating above key HTF support after a controlled retracement. As long as price remains above the identified demand zone, the expectation favors continuation toward higher liquidity levels in line with the prevailing bullish bias.
________________________________________
🌍 Fundamental Notes / Sentiment
Overall risk sentiment remains supportive for equities, with no immediate macro catalyst signaling aggressive risk-off behavior. In this environment, pullbacks into HTF demand are more likely to resolve as continuation moves rather than deeper trend reversals.
________________________________________
⚠️ Risk Disclosure
Trading involves substantial risk and may result in capital loss. This analysis is for educational purposes only and does not constitute financial advice. Always apply proper risk management, predefined stop-loss levels, and disciplined position sizing aligned with your trading plan.

BTC M15 HTF FVG Rejection and Liquidity Pullback Setup📝 Description
On the M15 timeframe, BTC is trading within a broader bearish context after a strong impulsive sell. Price has retraced into a clear H1 FVG / supply zone, where sell-side interest is active again. The current bounce looks corrective rather than impulsive, suggesting a potential continuation lower toward nearby liquidity pools.
________________________________________
📈 Signal / Analysis
Primary Bias: Bearish below 90,600
Preferred Setup:
• Entry: 90,650
• Stop Loss: Above 90,800
• TP1: 90,356
• TP2: 90,027
• TP3: 89,425
________________________________________
🎯 ICT & SMC Notes
• Price reacting inside unmitigated H1 FVG
• Current move classified as a bearish pullback, not reversal
• Below-price sell-side liquidity remains intact
________________________________________
🧩 Summary
BTC is showing a classic bearish retracement into premium HTF supply. As long as price remains capped below the H1 FVG, downside continuation toward 90k and sub-90k liquidity levels remains the higher-probability scenario. Rejection from this zone strengthens the bearish case.
________________________________________
🌍 Fundamental Notes / Sentiment
US labor data supports a stronger USD, reinforcing higher-for-longer rates and weighing on risk assets. With dollar strength in play, a bearish move in Bitcoin is favored, and any short-term upside is likely corrective.
________________________________________
⚠️ Risk Disclosure
Trading involves substantial risk and may result in capital loss. This analysis is for educational purposes only and does not constitute financial advice. Always apply proper risk management, predefined stop-loss levels, and disciplined position sizing aligned with your trading plan.

BTC - Shakeout Complete… Is the Trap Set???Bitcoin just delivered a classic manipulation move into the higher-timeframe demand zone❗️ The sharp sell-off below structure flushed late longs and triggered stops, only to be quickly reclaimed.
That’s not weakness. That’s intent.
📉📈From a structural perspective , this demand zone has already proven itself before. Price reacted strongly from it in the past, and once again, buyers stepped in aggressively after the sweep. This suggests the downside move was more about liquidity than genuine trend reversal.
⁉️ Now comes the key question.
⚔️As long as BTC holds above this demand and continues to build acceptance, the focus shifts to a recovery move back into the prior structure and supply zone above. That area will be the real test, whether this bounce is just a correction, or the start of a larger continuation.
For now, patience is key. Let price show its hand near demand before committing.
Is this the reset before the next leg higher, or just a temporary relief bounce? 🤔
⚠️ Disclaimer: This is not financial advice. Always do your own research and manage risk properly.
📚 Stick to your trading plan regarding entries, risk, and management.
Good luck! 🍀
All Strategies Are Good; If Managed Properly!
~Richard Nasr

Stop Loss Killers Completed – Bullish Expansion Ahead?After three consecutive Stop-Loss Killers (SLK1, SLK2, SLK3), the market appears to have flushed out remaining buyers and collected liquidity below key lows. This structure often signals the end of a manipulation phase and the beginning of a potential bullish expansion.
With the FOMC rate-cut announcement expected this evening, the market now has both structural and fundamental conditions for an upside move. If the sweep was indeed the final liquidity grab, a rally toward the upper target zone may follow next.

BTC + POWER OF THREE (XAMD)BTC + POWER OF THREE (XAMD)
X + Accumulation + Manipulation + Distribution
X: Reversal or Continuation

BITCOIN — THE SUPPORT LINEBitcoin’s ultimate support for bulls lies between the two black lines shown above.

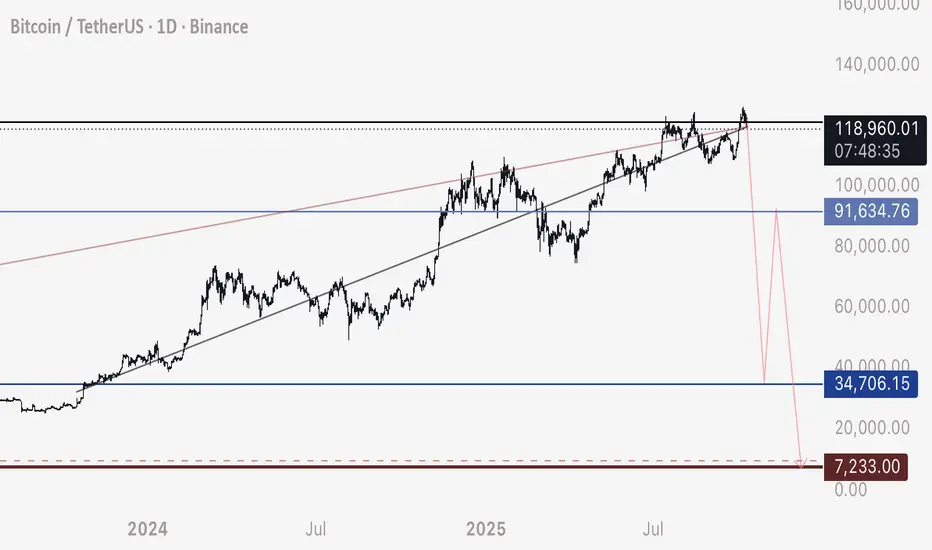
BTC - Another (Drastic) Possibility For those who have been following my bitcoin short ideas, another possibility in this movement that I urge you NOT TO DISCREDIT so easily:
We see a flash crash / wick beginning from 89,000-89,500 region - and we drop straight to sub 10,000
My expected bottom of this wick is precisely 7,250
Now why would this happen, or be possible?
DXY is breaking down a major multi year bearish structure. This means the US dollar will fall in value over the next years, and lead to one of the largest bull markets we’ve ever witnessed on stocks, equities, and securities.
Bitcoin has been steadily rising and collecting not only long position stop loss orders, but liquidation orders for all the leveraged buys (including Microstrategy).
This leaves a massive chain reaction of sell orders ready to trigger off, one into the next, below price.
As price falls, more liquidity is removed and more sell orders are filled - this equals a drop at incredible speed that does not stop until there are no more orders.
So while I have been urging a 3 way corrective drop as such:
89,500 to 34,800
34,800 to 61,000-63,000
61,000 to 8,000
It’s entirely possible we see the following:
89,500 to 8,000
Happy trading,
- DD

Bitcoin - Will History Repeat Itself Again?📈Bitcoin continues to follow a remarkably similar path to its previous market cycles. Each major bullish impulse has been followed by a controlled correction, a fakeout towards the lower trendline, and then a strong rebound toward new highs.
Looking closely at the current structure, BTC seems to be retesting the lower bound of its long-term rising channel, a pattern that played out multiple times before every major leg up.
⚔️If history repeats itself, this fakeout could mark the final shakeout before the next macro rally, with a potential reversal forming between late November and early January.
🏹From there, the next impulsive wave could push price toward the upper boundary of the channel, around the $150,000–$160,000 zone, aligning perfectly with Bitcoin’s long-term cyclical rhythm.
The big question remains: will history rhyme once again, or is this time different?
⚠️ Disclaimer: This is not financial advice. Always do your own research and manage risk properly.
📊All Strategies Are Good; If Managed Properly!
~Richard Nasr

BTC - Prepare for Wick to 35,000Here I display the long stop loss orders contained in order blocks below price.
These leveraged sell orders only fulfill when price crosses over the level, leaving a chain reaction or sell orders in the chart already - ready to trigger off one into the next.
This mechanic within crypto is what created wicks. I’m showing you here that they can be predicted and traded.
Prepare for this to happen anytime now.
- DD

Sell! (personal opinion, DYOR always)Remember — this is only my personal opinion, it’s emotional, and maybe you shouldn’t trust me. But here’s what I see happening right now.
This CRYPTOCAP:BNB pump looks extremely suspicious.
CZ has turned his back on the community he helped build, and now he seems to serve the same powers manipulating the crypto markets.
🚨 What’s going on:
On October 11th, over $400 billion (yes entired funds collapsed, the total of the liquidation is yet to be accounted for real, brace for a shocking number) in liquidations reportedly happened.
Binance allegedly reported only 5% of that — likely to hide the fact that their system failed catastrophically.
If true, Binance could be liable for massive financial damages.
💰 How it works:
CRYPTOCAP:BNB is being pumped using liquidity minted by Binance on their own CRYPTOCAP:BNB Chain.
They can mint unlimited CRYPTOCAP:USDT , creating fake buying power and distorting the market.
⚖️ What might happen next:
When justice catches up, Binance could face severe investigations and legal actions.
More traders and companies are starting to speak up — and we’ve only seen the tip of the iceberg.
If the justice system audit Binance, then they will have to remove the fake liquidity and rekt the ones who invested.
⚠️ My conclusion:
When the storm hits, CRYPTOCAP:BNB could crash beyond recognition.
Don’t be the one posting “I lost everything.”
There are safer investments — precious metals, bitcoin, solid stocks, real estate in Asia…
But CRYPTOCAP:BNB ? After what happened? It is a high risk asset considering how liable they are.
👉 Stay away until the truth unfolds.
#BNB #Binance #CryptoCrash #CZ #USDT #MarketManipulation #CryptoWarning #CryptoNews #BNBChain #Justice #CryptoInvesting #DYOR

BTC Short Update - Prepare for Wicks to these LevelsAn update on my ultimate swing short trade:
There’s a good possibility this swing will be the speed of a scalp trade, at least the first drop to 35,000
Prepare for wicks to the following lows:
Wick 1 - 34,700-35,000 bottom
Retrace Up to 77,500, reject at 77,500
Wick 2 - 7,250 to 9,000 range
Happy trading and thanks for following my ideas.
- DD

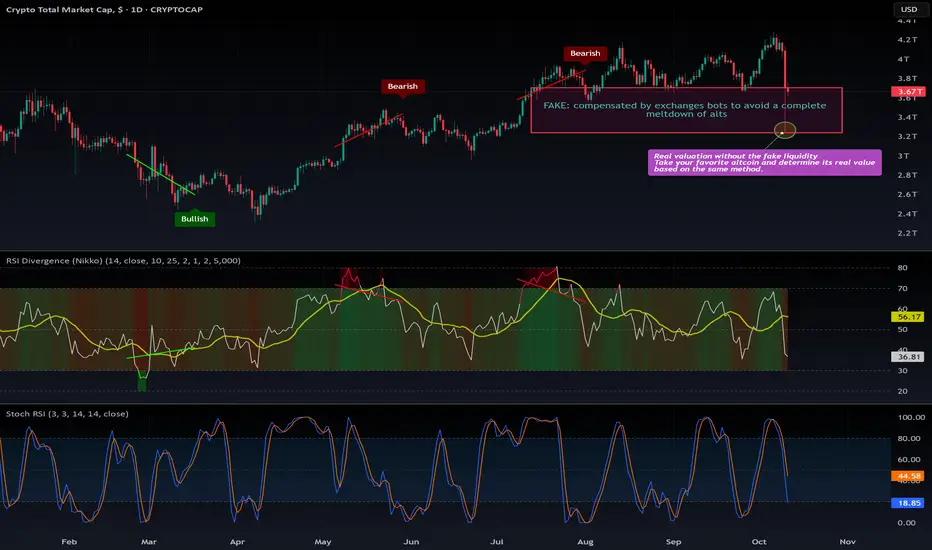
Crypto has a problem: Oct 11 crash and consequencesYes, we have a serious problem that no one really explained — so here I am, debunking this Crash and its consequences.
The entire crypto market is built on fake valuations, not backed by real money. Most of the trading volume you see is manufactured internally by centralized exchanges (CEX) to simulate healthy activity — while in reality, there are very few genuine transactions.
That’s why exchanges are constantly seeking liquidity — because trading fees alone can’t sustain their business.
On October 11th, 2025, crypto had its own dot-com moment. While Bitcoin and Ethereum survived thanks to real liquidity that could absorb the sell-off, the altcoin market collapsed.
There was simply more leverage than liquidity — meaning exchanges were offering leverage they couldn’t actually back with real funds.
So when the market crashed, there were no real buyers. Liquidity pools were wiped out, and coins like CRYPTOCAP:SUI or NASDAQ:ATOM revealed just how fake their markets were.
Did you see anyone buying the dip at -80% on spot? Of course not — because it wasn’t even possible.
Binance and other exchanges froze accounts to prevent users from scooping up altcoins at near-zero prices.
Think the exchanges made millions buying the dip? Wrong. They simply rewrote the database to avoid a catastrophic event that would’ve sent 99% of altcoins to zero.
They “purchased” the dip without spending a single dollar — just digital manipulation to preserve the illusion of value.
The truth: the entire altcoin market is propped up by fake liquidity.
Their “real” value is what you saw at the bottom of October 11th — that was the true market price, without artificial support.
Now the big question:
Can exchanges keep faking volume and valuations forever?
Or will they finally let the market crash to its real worth?
Right now, you can bet there are emergency meetings between exchanges and market makers, deciding whether to come clean or continue the illusion.
Look at the bottom price of each coin on October 11th — that’s what it’s truly worth.
Everything above that is fake inflation, fake volume, and fake confidence.
If you still have unrealized profits, take them. Turn them into real money before they vanish.
Then invest knowingly.
DYOR.
#CryptoCrash #Binance #Bitcoin #Altcoins #CryptoNews #MarketManipulation #LeverageTrading #CEX #FakeVolume #LiquidityCrisis #CryptoTruth #BTC #ETH #SUI #ATOM #DYOR #CryptoScam #TradingAlert #WallStreet #CryptoCollapse #vCrash2025 #CryptoMarket
COAI — the most manipulated coin on the market
Pair: COAIUSDT.P (perps)
Bias: Short (tactical)
Thesis TL;DR: Timeline is flashing classic manipulation tells—crowded leverage, public pleas to delist, an “unknown wallet” repeatedly selling into rips, and whipsaw liquidations both sides. I’m fading spikes into prior ATH supply with tight invalidation and scale-out targets.
Why this is a “manipulation” setup (from social timeline)
Open manipulation meme: “PAWNZI” label and multiple posts calling COAI a casino-like gamble.
Crowded leverage: Repeated notes of huge liquidations on both sides and a callout that a mass liquidation triggers near $5.83 if price nukes.
Smart seller behavior: “Unknown wallet” reportedly sells repeatedly into strength, trapping late buyers.
Public escalation: Users tagging @CZ_Binance and demanding review/delist for “price manipulation.”
Behavioral fuel: Screenshots of 292x PnL and regret posts (airdrops sold “too early” → FOMO) stoke late momentum buyers—perfect exit liquidity.
Failed short triggers: Traders trying to frontrun the short got chopped/stopped BE multiple times—signals engineered liquidity hunts before the real move.
Levels I care about
Short interest zone: $6.90–$7.20 (prior ATH pocket / squeeze fuel). Expect wicks.
Momentum pivot: $6.50 — loss/reclaim flips intraday bias.
Liquidation magnet: $5.83 (widely-circulated “mass liq” level = honey pot).
Deeper shelves: $5.60 and $5.20 — prior reaction zones where trapped longs may puke.
Trade plan (short bias)
Entry: Scale $6.90 → $7.20 on spikes; add on 15–60m structure breakdown below $6.50.
Invalidation: 4H close > $7.50 (acceptance above prior high = out, no debate).
Targets:
T1: $6.10 (first shelf; take partials, pay yourself)
T2: $5.83 (liquidation cluster—expect violent reaction)
T3: $5.60 → stretch to $5.20 if momentum accelerates
Risk: Size so that full-stop loss = ~1% account risk. If we wick >$7.35 and snap back in-range, I’ll re-engage with smaller size.
Execution notes:
Expect engineered squeezes before any trend. Let price tag your zone—don’t chase.
If $6.90 is reclaimed after a breakdown, reduce risk—possible bear trap/reset.
Watch perp funding/OI — extreme positive funding into resistance = better fade.
Narrative context (why fade)
The public narrative is doing the heavy lifting: casino vibes, “unknown wallet” selling into pumps, and open calls for Binance action.
Retail euphoria (292x screenshots, airdrop regret posts) provides late long fuel.
If the crowd is staring at $5.83 as the “big liq,” market often hunts it—either as a clean flush or a spoofed front-run to trap shorts. I’ll manage partials proactively there.

Using DXY to Predict Manipulation on BitcoinIn this post it’s important to view and relate to the linked, related idea called “DXY - Major Breakdown of Ascending Channel”
I’ll keep this short and to the point since we are actively in the war zone now.
1. Identify major patterns or structure shifts on DXY. For 8 years I’ve used these same ascending channel supports on DXY and it’s made very clear this is the way it trades, as we can duplicate the line angle and move it near infinitely to any area and see how price respects it.
2. Identify major DXY events in relation to the DXY pivot. In this case, we are witnessing a bearish retest of a major bearish signal.
3. Understand what it all means. DXY falling / correcting for 4-7 years translates to BULL MARKET of the same duration on stocks, equities, and securities.
Now you may be thinking - “Okay but that means, Bitcoin will go up then?”
WRONG
The reason is, Bitcoin and Crypto is a manipulated game and it’s all rigged and intentional.
What does this really mean then?
4. If we will see a natural bullish trend on Bitcoin for the next 4-7 years, that means the market makers want their money back. Since Bitcoin has been only moving up since late 2022, this has set up a massive chain reaction of long stop losses / sell orders, paving a path to these lower zones on my BTC chart. What this should tell you is - FLASH CRASH COMING. Manipulated crash before the true bull run.
Now you may be wondering - “No way, the world would have to see an apocalypse for 8,000 to be hit”
WRONG
Stop loss orders are in place already as a natural consequence of traders decisions over the last 3+ years. These are sell orders. Once these sell orders start filling, bitcoin will see an automatic wick down to these low levels. No active selling is required, and therefor no black swan required.
Now - If DXY was retesting a bullish pattern, I’d be longing as that signals extended bear market.
And rest assured - THIS MARKET IS ALL MANIPULATION.
We can use DXY to predict the trigger of it all.
Happy trading.
- DD