BTC Don't Blame The Whales - Its Your ShortsWow, trading in crypto currencies is a lot like being in the trenches during a war. Speaking from personal experience you can spend endless hours in the dark and the quiet when nothing is happening and suddenly BOOM it's all in your face. Just as in warfare, some of you may need to check the condition of you shorts after things go boom.
I never trade on margin and today is a perfect example why. Had I been short like so many other people, I would've been rekt, and I know a lot of guys are out there crying in their beer right now. There was massive short interest in Bitcoin prior to this move and it was begging for someone to jump on it.
I was busy doing my normal thing, some analysis and writing on another crypto, namely Cardano today when Bitcoin exploded. I've been mulling over the idea in my head for the last few days about writing an article based on the published news that George Soros has entered trading in crypto currencies. Anyone who knows anything about George Soros knows that he is a ruthless SOB that has no conscience and takes great pride in destroying other people, even his own whom he betrayed to the Nazis. One of the things in Soros long and sordid career is that he is known as the man who destroyed the English pound years ago sending the entire economy of England into a spin for his own personal profit.
Soros has company too, some big traders and funds are entering the market and some of them are also heartless manipulators who tell lies about their own intentions and then trade the opposite. Jamie Dimon, and Mark Cuban for example. Both men trash talked Bitcoin and crypto currency. Both denied they had any interest and immediately after admitted publicly that each of them was buying in the market.
The crypto currency market is undergoing an evolutionary phase where it is becoming overregulated by government entities driven by special interests who will mold the laws and regulations to their benefit just as it has been done in the stock market in the name of protecting the little guy. Particularly in this time when there is very little regulation in crypto currencies, big players like Soros can come into the market and wreak pure hell. They're pretty much undetectable except by one thing. You can usually assume that whatever they say is the opposite of what is about to happen in the market.
We all know the crypto markets have a mind of their own and don't need any help from outsiders like Soros to surprise us at a moments notice. So what is my point in writing this? You should trade intelligently keeping your cards close to your chest and stay the heck out of margin trading. Don't for one second believe 99.9% of the braggers getting rich on margin, when you set up a trade or an investment use cash - have an entry and exit plan.
What's going to happen with Bitcoin next? At this moment based on what's happened the last few hours it's kind of hard to tell. I would watch the resistance levels that are drawn on my previous charts. We blew right through 7400 which I mentioned in another article I wrote this morning before this explosion. Bitcoin touched the area of $8000. I would say there's certainly room for short-term pullback but you need to keep your eyes open for 11,600 as the next upside target. If you were already in Bitcoin this morning when it took off congratulations. For you, I would either take my short term profits or set a stop loss to protect my profits to this point on the day.
I did not have any Bitcoin in my short-term trading portfolio, so this does not apply to me personally but if I had I would've sold out by this time, and taken my profits. However, I've had a nice ride in Verge and Cardano out performing Bitcoin the last few days. See my posts.
Keep a sharp eye on the price range of 7596 two 7804 either for a reversal or a breakthrough. If we get a breakthrough to the upside watch the 8426 price level, and should we get through that I would look for us to reach 11,600.
Margintrading

(LTC) Bots, Market Manipulation, and Forced Liquidations, Oh My!Alright folks, been AWOL for a bit but today's utter chaos called for a serious look at what appears to be blatant market manipulation.
So naturally, being that this is an LTC chart one would assume we'd be taking a hard look at litecoin.....well not really, sorry folks.
I actually chose litecoin because every since the litepay debacle the project has taken an utter beating...while your ltc wallet probably took a heavy hit...it gained something beautiful from all the chaos: increased market independence.
That is key, because as we all know BTC is practically a crypto index these days, LTC always had more autonomy due to more fiat trade pairs than other alts, but now especially it is moving more freely from BTC's clutches.
This is important, because while a knee jerk sell off of BTC like we saw this morning will always see alts follow; the ETH and LTC markets dont often appear to take direct ratio downturns with BTC.
But not this time. Oh no, this time fiat heavy trade pairs took nearly an identical hit...and that my friend's smells damned fishy.
(Just a sidenote: my formal background is actually in engineering and algorithmic cycles are something I studied pretty extensively, so I'm not just pulling this out of thin air, the cycles were clear and apparent from the get go)
Anywho, all the mumbo jumbo no one cares about aside lets jump in.
The pattern:
Cycle decrease is taken from impulse move to impulse move
Primary cycle appears to be 58 bars
Cycle break was 79 bars, nothing too telling here regarding cyclic length but it is worth noting that the offset rate of decrease from impulse high to low is maintained.
Every post pump down trend angle is increasing by exactly 2 degrees every cycle
As someone whose stared at one too many cycle output charts on MATLAB, and written a number of godawful C++ scripts this just screams "lazy coder" at an exchange attempting to disguise market manipulation through bots by just simply adding simple step and rest functions to the code.
Naturaully this is all speculative as I'm not behind the wheel at Bitfinex, but I'm sorry these patterns just seem too impeccable in their execution rate and uniformity.
Now, regarding today's plummet....what was that about? Realistically its anyone's guess until an insider comes forward. In my opinion though I would assume we either saw some mass liquidation by a few whales trying to FUD the market into a landslide so they could buy up bags, or possibly some major forced margin liquidations on the exchange side. Trading with leverage is at an all time high, what do you think makes more money, fees, or liquidated margin positions? Yeah, excatly lol
In all reality I think the most likely scenario is a mix of the two.
Anywho, heres a little bit about what to watch for with litecoin in the post freefall chaos.
Although it did spend a short period below it, LTC was range bound (~$115-$120) for quite some time prior to today's plummet.
The crash dead stopped at 162% extension from the final impulse wave up
We did tag the major trend 1yr+ support but as I write this it looks as though we may close this bar above it
We'll soon be approaching 58 bars since the smackdown. It's far from guaranteed but I do suspect well see some impulsive movement in the 58-79 bar range
If we get this movement, and it occurs on a bar following a close over the long term support TARGET 1 will be the 162% extension, TARGET 2 will be ~$115 (the prior lower bound of the ranged movement)
If however we hit that impulse move below the long term trend I'd say it might be time to gear up as the bears try to pull our beloved LTC down to $108 range.
This analysis is meant for purely educational purposes, and whether you choose to trade on it or not is entirely on you!
Good luck and happy trading fellow cryptoheads!
Austin Doyle
CTO

While We wait on the 1 hour candles... Lets view w/ 5min I've recently been testing the B.B. Reversal strategy. On XBTUSD using the 5min. candles & So far has proven to be quite profitable...(I just started testing earlier today. Sooooo) Anyways The Rules are simple, Stick to the Rules, Always wait for confirmation candle and MOST Important IS To TAKE PROFITS early. I found it to be a far better strategy IF I have a predetermined 'take profit' set. using this method it around the $200 mark, but everything is situational of coarse, but with practice you'll know when the time is right. Just DO Not Get Greedy. I've found out the Hard Way. That bitcoin is a sloth, except for when the market actually moves, and I've watched too many $200+ profits get erased in a moments notice w/o warning NEVER to return...
Here are the Rules I employ: * subject to change w/o prior notice... lol
1.- Only employ this strategy using either the 5min & OR the 1 hour candles Plz
2.- Once candle breaks through the B.B. but then closes back inside the B.B. (I've highlighted examples in chart) Once the follow candle which starts inside B.B. then usually the candle willl 1st venture back outside the B.B. almost matching previous wick... Once that candle closes back inside B.B. then its confirmed to follow trend
3. take profits at Mid way of B.B. unless candles break through Half line w/ no problem, should result in complete crossing of B.B. ( from top - botttomo vice versa)
a Gud example is IF the trending candle closes prior to crossing midway point then TAKE PROFITS Bcuz possible reversal. IF trending candle closes after crossign midway, Hell I still take my profits.... then wait to jusge market at that time, If able to jump back in do so IF not NEVER chase trends. There will Always be another opportunity. Some say count your blessing. I prefer to count my profits, but thats just Me... Too each is Own...

Bitcoin 5% Scalp - LongSometimes you just gotta yolo the trigger on that 5% scalp to retest the highs.

ETC7D Linear Futures 1HRWent with the broadening wedge perspective here. Take a look at the outcomes, both bullish and bearish continuation possibilities shown. Interesting spot also factoring in the airdrop in a week. Close, close, close eyes.

AMZN GET READY TO LONGBroke through Resistance level of 1472.5800 at 21-Feb-13:30
Supported by Upward sloping Moving Average

E-mini S&P 500 short playTriangle has broken through the support line at 21-Feb-15:00. Possible bearish price movement forecast for the next 2 days towards 2674.2335.
Supported by Downward sloping Moving Average cross


$BTCUSD - Looking bearish short term, shorting opportunity$BTC has been unable to breach resistance, going sideways against it. If it continues to go sideways, eventually it will tire out and we'll drop to support; the next supports are around $7700, $6900, and $6300. Although there is no support line around the mid $6000s, it is fully possibly for a rebound around that area due to how cheap it is and close to the bottom.
On the 5m interval:

BTC margin long volume vs price on BitfinexAfter calling the recent drop from 12k to 7.9k , I got the sense that BTC hasn't bottomed yet despite many calling the bottom. So I started looking for other indicators and pieces of data that may corroborate this hunch.
Initially I started looking at the long (BITFINEX:BTCUSDLONGS) and short (BITFINEX:BTCUSDSHORTS) positions on Bitfinex as a way to gauge when to exit my margin positions. However, as I went back over the data we had (which admittedly isn't a great deal as Bitfinex only started providing the data on the 20th of August 2017), I started to notice that we topped out at around 32k of BTC longs. This coincided with a couple of major selloffs, including the last drop from 12k, and the prior one from 20k.
Im not sure if this is a glass ceiling, or a hard cap, however it seems pretty clear to me that we are seeing divergence of BTC price vs number of long positions. ie. price is going down despite an increase in longs.
I feel this provides some evidence towards the idea that we will push considerably lower due to a "long squeeze".
I also mentioned a few days back in my prior post that if we close the week below the weekly 20EMA, we will head lower to the 50MA for support.
A few days back
Now
I believe we are going down to between ~6k (+/- 500).

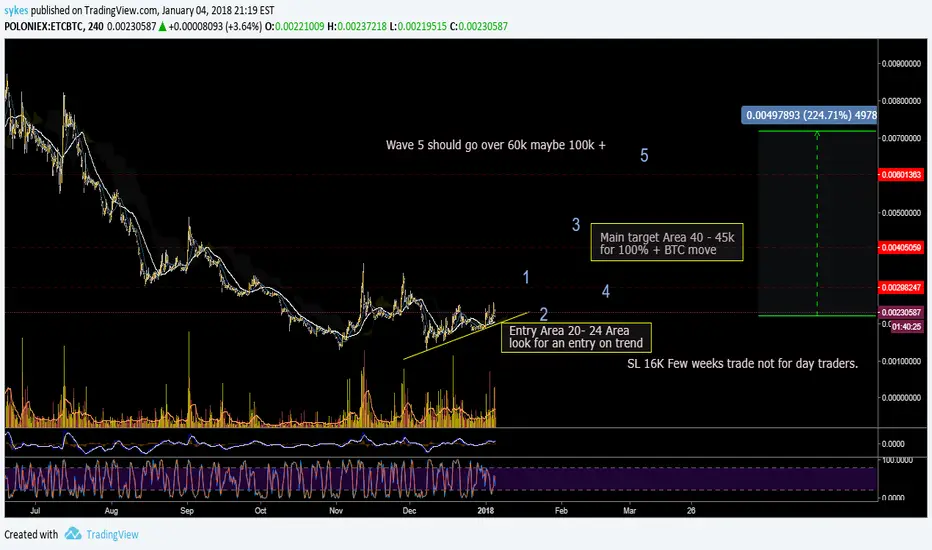
ETC - To the Moon in the first quarter.This is for the HAI charting comp. I am personally playing this one for the next couple of weeks / months.
I think we have started a new cycle with Ethereum Classic. Barring anything crazy happening and using smart stoplosses we can double or triple our BTC / Money with this coin. This is not a for people looking for quick profits. I think it is a good place to sit coins that are doing nothing for you. (I changed BTG for this)
Want to get an entry in from 20k to 24k. I will be comfortable with a stoploss of 16k (bought under 20k so 4kish SL)
Buy close to the trend. 20-24k - get a buy on the hour or 2 hour chart.
TP1 - 30K
TP2 - 40K
TP3 - 60K
SL - 3-4k from entry
Shorterm target is 28-32k
Main target is for 100% profit in the 40-45k region.
You can also take profit in that region and buy again on the retraces around the first target of 30k for wave 5.
Wave 5 I think will go past 60k,before a retrace. By that time we will have made 200% so, take profits and keep a few for some months and they could be worth $100's.
XmrUSD Short Term Long XMRZ17 reference alsoChart speaks for itsself
abc correction
now elliot impulse wave forming
small time frame show developing bullish ema
rsi bounced off its support also and is beginning uptrend
THIS IS THE ANALYSIS I WILL BE USING TO TRADE THE $XMRZ17

LTCZ17 Long play . 550% profit potential.im using 20x margin with no sl...my liquidation price is 1844
bout at .01751
price riding up off the 4 wave and up to the 5 count to complete the completetion of the 5 count on the impulse wave on correction
price also coming through the 61.8 fib so you should buy at
.01983
trading with 20x margin which means my buying power is mulitplied by 20
which is what woulld make the profit 577%


Short term XBT/USD reversal possibilityShort term reversal possibility for it's next movement upwards .
