MARI Technical Analysis: Sitting on Support - Bulls Warming UpMARI (Mari Energies Limited)
Price is currently holding above a strong horizontal support area and respecting the rising trendline, maintaining its overall bullish structure. It is also trading above the 50 EMA, a level that has historically acted as reliable dynamic support.
Buy 2 is positioned slightly lower near the support zone to secure a stronger average in case of a healthy pullback.
RSI is in sync with price — no bearish divergence. A short downward trendline breakout has already occurred, adding bullish continuation potential. Price is also reacting around the golden Fibonacci zone, adding further technical confluence.
Fundamentally, MARI remains a strong company with solid performance, giving confidence to the trend continuation outlook.
Recommended Levels
• Buy 1: 714 (CMP)
• Buy 2: 705
• Stop Loss: Closing below 685
• Take Profit 1: 760
• Take Profit 2: 790
• Take Profit 3: 870 / Ride the trend with a trailing stop
As long as price sustains above the key support zone, potential remains firmly intact.
Mari

Mari Energies Limited (4-hour chart analysis):Current Situation:
Price is at 737.98 PKR, down 0.27%
The stock appears to be in a consolidation phase after rejecting from recent highs around 805
Key Technical Observations:
Trend Structure:
Long-term uptrend remains intact, supported by the rising blue trendline (major support around 685-700)
Price is contained within an ascending channel (white lines)
Recent price action shows weakening momentum after the October spike
Support Levels:
Immediate: 725-730 (recent swing low)
Strong: 685-700 (blue trendline + channel support)
Critical: 645-650 (mid-channel support)
Resistance Levels:
Immediate: 775-780 (recent rejection zone)
Major: 805-810 (recent high)
Breakout target: 850+ if channel top is cleared
Volume Analysis:
Recent volume spike visible (circled in purple) suggests institutional activity
Current volume declining, indicating indecision
Outlook:
Neutral to slightly bearish in the short term unless 775 is reclaimed
Watch the 725-730 support; a break could lead to 685-700
A break above 780 with volume could resume the uptrend toward 850

MARIPSX MARI :: Day Level
📈 MARI Trading Recommendation
Current Market Price (CMP): PKR 685
💎 Bullish Bias: BUY & HOLD
✅ My clear view: MARI is a strong buy for long-& Mid term investors. Fundamentals are solid, and the recent dividend announcement strengthens the positive outlook.
💹 Long-Term Investors:
Enter at the current price for early entry and hold for very strong returns.
Support Levels for Accumulation (if price dips):
🔹 654 (immediate support; key level after breaking smaller range Jan–Sep 2025)
🔹 643
🔹 620
🔹 610
This allows accumulating MARI at discounted prices while maintaining a bullish long-Mid term view.
📊 Technical Outlook:
Range Bound: Since January 2024, MARI has been trading in a broader range of 590–744.
Resistance: 723–744
Support: 590–612
Smaller Positive Range: 605–654, which has been positively broken.
654 now acts as key support.
⚡ Intraday / Short-Term Traders:
Monitor daily price action carefully. Not recoomended for intraday Trading but can manag as per below:
Rule: Do not hold if the price closes below 654 with a bearish candle on the daily chart.
A break below may lead to pullbacks toward 643–610.
Target TP1: 723 TP2: 744
Pattern: Formation of a bullish flag indicating potential upward movement.
✅ Summary:
Long-Mid term: Buy & hold 💎
Short-term: Watch 654 closely ⚡
Market sentiment favors upward movement, making MARI attractive for both accumulation and swing trading.

Mari Key levelsMari is in bullish trend and buying is possible with blue lines TP and red line SL
Note: This is not a buy/sell trade call.
MARI Petroleum Company Ltd (PSX) Buy Idea✅ Buy Idea Summary
Symbol: MARI
Timeframe: Daily
Current Price: 652.96
📊 Analysis & Plan
Context:
Price has bounced from a higher-timeframe demand zone (highlighted in blue) and is currently forming a bullish structure.
Key Observations:
Swing Failure Pattern near top (distribution clue).
Liquidity Pool marked at 720 — likely target for short-term buy-side liquidity.
Strong bullish reaction after price tapped near the low of the previous range.
🛒 Entry:
At/around: 652.96 (Post price).
🎯 Target Levels:
TP1 (Partial/Intraday): 720 (Liquidity Zone)
TP2 (Major Target): 829.88
TP Final: 900.23
🛑 Stop Loss:
Below 539.13 (last swing low and structural invalidation)
📥 Reinforcement Buy Zone:
Blue Demand Area (around 460–500):
“If I got here, I will look to buy more.”
→ A key reaccumulation area if price revisits.

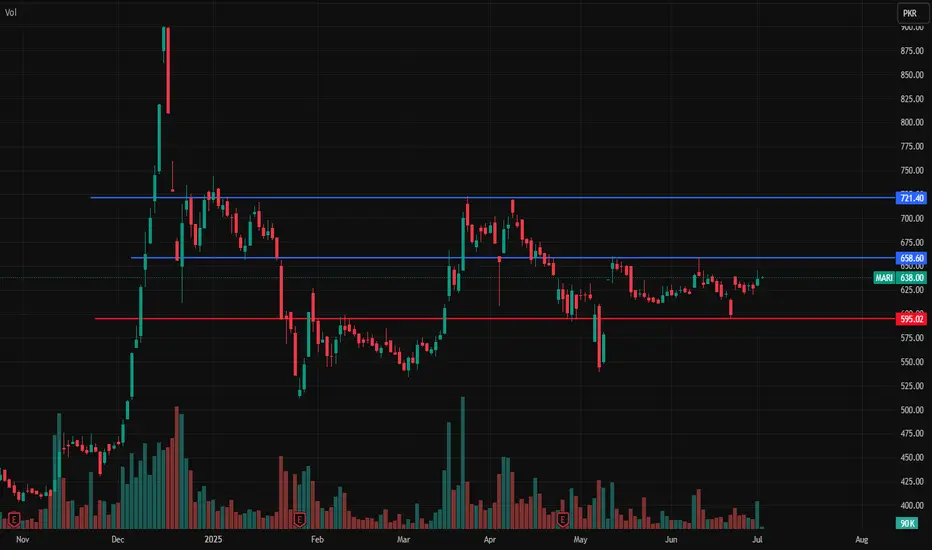
Mari Swing trading targetsMari is entered into bullish trend and entry is possible, TP1 is 660 and TP2 is 700. SL is 593.
Note: This is not a buy/sell trade call. trade at your own will and analysis. This is for education purpose.

MARI - PSX - Beginning of a Bull Run MARI is the market leader of PSX. Historically, on time cycles it has shown consolidation period of 43 days before going into a bull run spanning around 32 days. Price after making the falling wedge has broken the structure upwards and now has even crossed the recent Lower High 627.40 as well - which signals a trend reversal towards bull run.
Very good volumes are also experienced which are also confirmed by KVO which is a volume-based oscillator (blue line is almost at 60 degree angle going up). RSI is at 70 without any sign of reversal. Therefore, it would be a fair bet that we might see another cycle of bull run which should cross the previous all-time high (900.23) calculated on the basis of AB=CD or Fib based Extension tool.
A minor retrace at key levels is expected where one should book profit.
Trade Values
Buy-1: 649
Buy-2: 630 (if price dips)
TP-1: 740
TP-2: 840
TP-3: 900
TP-4: 1030
SL: 535

MARI Technical Analysis: Potential Buy Opportunity MARI presents a compelling buy setup. The stock is in a confirmed uptrend, recently bouncing off a key trendline within the crucial 0.618-0.78 Fibonacci retracement zone, a key area of support. A bullish inverted hammer candlestick, followed by another positive candle, formed at this level, suggesting renewed upward momentum. The RSI confirms this bullish sentiment, aligning with the price action. Recommended entry points are at the current market price (583) and a secondary level at 484.16. A stop-loss below 378 on a closing basis is recommended for risk management. Target profit levels are 716, 880, and an open target for potential further gains. Happy trading!

Mari is heading to 900 againMari did not drop more to below its support of 594. it dropped from its support of 666 and bounce back again and broken resistance of 666 and touched 715. It is likely to cross again 755 and heading to 900 again. Use stop loss below 666
Note: This is not a buy/sell call. Trade at your own
will.

MARI potential Buy setupReasons for bullish bias:
- Fundamentally a very strong company
- Price respecting upward trendline and is at 0.382 Fib level
- Overall a bullish trend
- Divergence also getting synched
Here are the recommended trading levels:
Buy 1: 402 (CMP is also good)
Buy 2: 384.19
Stop Loss Level: Closing below 355.8
Take Profit Level 1: 482.91
Take Profit Level 2: Open

VFF Bull Continuation Possible Soon VFF has pulled back in two legs sideways to down after a strong bull rally. The bulls have a 60% chance of a second bull leg up before there is a strong bear reversal. Last week broke below the 14 first leg down. This is where the bears need to be the strongest. This is also where strong bulls (and bears) will start looking to buy for trend continuation. However there is not yet a strong buy setup. If this week closes on its high, it could signal the end of the correction and soon enter a bull channel phase for a second leg up.
There are many bull gaps below, and the rally contained strong buying pressure. Furthermore, the sell off has not been all that strong. Last week was one of the strongest bear bars, and created a gap around 14. Since there are no previous open bear gaps, this one will likely be filled as well, and may act as an exhaustion gap. The bears need to keep the gap open and create strong follow through selling to increase their probability to 50% for a test of the bull breakout.
To learn more about how to determine the directional probability and how to structure a trade based on this with a positive traders equation, please see below.
If you found this helpful please like! Feel free to comment or ask questions.

CGC Two Sided TradingCGC is beginning to develop some two sided trading and transitioning into a broad bull channel / bull flag trading range. (All channels are a form of a slanted trading range and ultimately evolve into a large trading range). Prices are currently around the middle of the trading range, where the directional probability is close to 50/50. The high 2 buy setup a few weeks ago failed to get bull follow through. The bears want a test of the 28 low and a breakout below. The bulls want to keep the 28 breakout gap open as a sign of strength and create a higher low / large high 2. Prices will likely remain mostly sideways over the next several weeks or even months, as both sides fight for conviction and follow through in their direction.
If you found this helpful please like and share! Feel free to comment or ask questions.

Weekly breakout approaching on this marijuana REIT 1-year long consolidation. Watch close this Friday.
