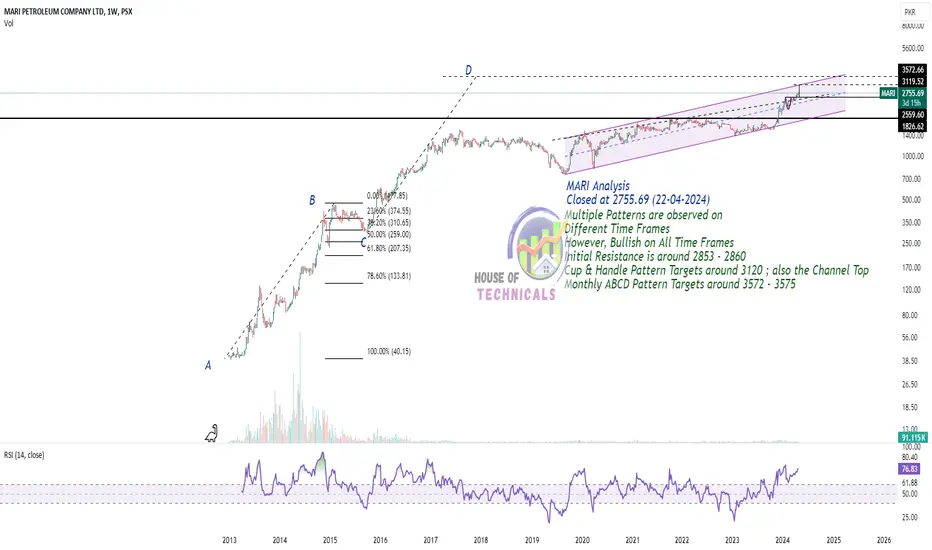
Play on LevelsMARI Energies Analysis
Closed at 689.76 (03-07-2026)
Currently Trading around Important Resistance zone (690 - 705)
Sustaining this Range may lead it towards a Breakout Level, targeting
around 760 - 770 initially & then around 800.
On the flip side, 650 - 660 may act as a Good Support Zone.
Breaki
Mari Energies Limited
No trades
No trades
57.11 PKR
65.37 B PKR
177.10 B PKR
227.31 M
Next report date
—
Report period
—
EPS estimate
—
Revenue estimate
—
Profile
Sector
Industry
CEO
Faheem Haider
Website
Headquarters
Islamabad
Founded
1984
IPO date
Dec 12, 1994
ISIN
PK0066301018
FIGI
BBG000GN6ZS7
Identifiers
ISIN PK0066301018
Mari Energies Ltd. is engaged in the exploration, development, and production of hydrocarbon potentials, which includes natural gas, crude oil, condensate and LPG. The company was founded on December 4, 1984 and is headquartered in Islamabad, Pakistan.
MARI PROBABLY IN WAVE '' C ''This is in continuation to our ongoing tracking of MARI.
Our preferred wave count suggests that we are in wave C of an ABC wave correction upward which will target 720 - 740 level.
Alternately, we can be in wave A of (C) which will take price downward below 540 levels directly or by reversing from
MARI ENERGIESMARI (Mari Energies Limited): Symmetrical Triangle Breakout
MARI has officially transitioned into a strong bullish structure following a definitive upside breakout from a multi-month Symmetrical Triangle consolidation pattern. This explosive price expansion is technically validated by a massive sur
MARI Breakout Setup Above 693.10MARI has broken out of its recent consolidation range and is now testing the 693.10 breakout level. Holding above this level could signal the start of a fresh bullish move.
A sustained close above 693.10 may attract further buying interest, with the first upside target around 749.50. The trade setu
MARI: The Real Battle Isn't 900, It's 705Mari Energies (MARI) has been quietly building a strong base over the past few months, and the chart is starting to look increasingly interesting.
After recovering from the March lows, the stock has been making a series of higher lows while respecting a rising trendline. This tells us that buyers c
MARI Buying StrategyMari Buying Strategy
option1
MAri current Price 613
if Mari close above 624 then its next target 🎯640-660 stop loss 600
option 2
if Mari close below ❌ 600
then we are wait Price come at buying zone 🟩 570-540
target 🎯620-🎯640-🎯660
My Recommendation
we must waiting for price come at our buy zo
MARI PROBABLY IN WAVE '' C '' OR " B "This is in continuation to our ongoing tracking of MARI.
Our preferred wave count suggests that we are in wave C of an ABC wave correction downward which will target the green trendline or the orange trendline and if the momentum continues it will easily go beyond 606 level.
Alternately, we can st
MARI PSX Chart Analysis 01-Dec-25Stop Loss: 680 PKR
Buy Stop: 716 PKR
Take Profit 1: 798 PKR
Take Profit 2: 899 PKR
No Divergence is found in (RSI).According to the chart the stock will perform well and be bullish untill it hit the all time high 899 PKR. After that the market will berish because at top there is potential reversal
See all ideas
Summarizing what the indicators are suggesting.
Neutral
SellBuy
Strong sellStrong buy
Strong sellSellNeutralBuyStrong buy
Neutral
SellBuy
Strong sellStrong buy
Strong sellSellNeutralBuyStrong buy
Neutral
SellBuy
Strong sellStrong buy
Strong sellSellNeutralBuyStrong buy
An aggregate view of professional's ratings.
Neutral
SellBuy
Strong sellStrong buy
Strong sellSellNeutralBuyStrong buy
Neutral
SellBuy
Strong sellStrong buy
Strong sellSellNeutralBuyStrong buy
Neutral
SellBuy
Strong sellStrong buy
Strong sellSellNeutralBuyStrong buy
Displays a symbol's price movements over previous years to identify recurring trends.
Weight6.61%
Market value212.66 K
Explore more ETFs
Frequently asked questions
The current price of MARI is 678.62 PKR — it has increased by 0.44% in the past 24 hours. Watch Mari Energies Limited stock price performance more closely on the chart.
Depending on the exchange, the stock ticker may vary. For instance, on PSX exchange Mari Energies Limited stocks are traded under the ticker MARI.
MARI stock has fallen by −0.20% compared to the previous week, the month change is a 4.40% rise, over the last year Mari Energies Limited has showed a 5.74% increase.
We've gathered analysts' opinions on Mari Energies Limited future price: according to them, MARI price has a max estimate of 935.00 PKR and a min estimate of 662.00 PKR. Watch MARI chart and read a more detailed Mari Energies Limited stock forecast: see what analysts think of Mari Energies Limited and suggest that you do with its stocks.
MARI reached its all-time high on Dec 16, 2024 with the price of 900.23 PKR, and its all-time low was 0.28 PKR and was reached on Apr 2, 2004. View more price dynamics on MARI chart.
See other stocks reaching their highest and lowest prices.
MARI stock is 1.45% volatile and has beta coefficient of 0.66. Track Mari Energies Limited stock price on the chart and check out the list of the most volatile stocks — is Mari Energies Limited there?
Today Mari Energies Limited has the market capitalization of 811.20 B, it has increased by 2.17% over the last week.
Yes, you can track Mari Energies Limited financials in yearly and quarterly reports right on TradingView.
Mari Energies Limited is going to release the next earnings report on Sep 2, 2026. Keep track of upcoming events with our Earnings Calendar.
MARI net income for the last quarter is 21.04 B PKR, while the quarter before that showed 12.88 B PKR of net income which accounts for 0.00% change. Track more Mari Energies Limited financial stats to get the full picture.
Yes, MARI dividends are paid semi-annually. The last dividend per share was 8.30 PKR. As of today, Dividend Yield (TTM)% is 4.44%. Tracking Mari Energies Limited dividends might help you take more informed decisions.
Mari Energies Limited dividend yield was 3.46% in 2025, and payout ratio reached 39.86%. The year before the numbers were 37.46% and 175.37% correspondingly. See high-dividend stocks and find more opportunities for your portfolio.
As of Jul 10, 2026, the company has 1.76 K employees. See our rating of the largest employees — is Mari Energies Limited on this list?
EBITDA measures a company's operating performance, its growth signifies an improvement in the efficiency of a company. Mari Energies Limited EBITDA is 97.77 B PKR, and current EBITDA margin is 53.58%. See more stats in Mari Energies Limited financial statements.
Like other stocks, MARI shares are traded on stock exchanges, e.g. Nasdaq, Nyse, Euronext, and the easiest way to buy them is through an online stock broker. To do this, you need to open an account and follow a broker's procedures, then start trading. You can trade Mari Energies Limited stock right from TradingView charts — choose your broker and connect to your account.
Investing in stocks requires a comprehensive research: you should carefully study all the available data, e.g. company's financials, related news, and its technical analysis. So Mari Energies Limited technincal analysis shows the buy rating today, and its 1 week rating is buy. Since market conditions are prone to changes, it's worth looking a bit further into the future — according to the 1 month rating Mari Energies Limited stock shows the buy signal. See more of Mari Energies Limited technicals for a more comprehensive analysis.
If you're still not sure, try looking for inspiration in our curated watchlists.